Strategies to Improve Your AGREE Metric Score: A Practical Guide for Sustainable Analytical Methods
This guide provides researchers, scientists, and drug development professionals with a comprehensive framework for understanding, applying, and optimizing the Analytical GREEnness (AGREE) metric.
Strategies to Improve Your AGREE Metric Score: A Practical Guide for Sustainable Analytical Methods
Abstract
This guide provides researchers, scientists, and drug development professionals with a comprehensive framework for understanding, applying, and optimizing the Analytical GREEnness (AGREE) metric. It covers the foundational principles of AGREE, offers methodological guidance for its application, presents actionable troubleshooting strategies for score improvement, and outlines validation and comparative assessment techniques. By integrating these strategies, professionals can systematically enhance the environmental sustainability of their analytical procedures, align with green chemistry goals, and meet the growing demand for greener practices in biomedical and pharmaceutical research.
Understanding AGREE: The Foundation of Green Analytical Chemistry Assessment
Frequently Asked Questions (FAQs)
Q1: What is the AGREE metric and what makes it different from other green assessment tools? AGREE (Analytical GREEnness) is a comprehensive metric designed to evaluate the environmental impact of analytical methods. Its key differentiator is that it is explicitly based on the 12 principles of Green Analytical Chemistry (GAC) [1] [2]. Unlike earlier tools that used binary or limited assessments, AGREE provides a numerical score between 0 and 1 and a circular pictogram for visual interpretation, offering a more nuanced and holistic evaluation of an analytical method's greenness across its entire workflow [2].
Q2: What are the 12 principles of Green Analytical Chemistry that form AGREE's foundation? The 12 principles of GAC provide the conceptual backbone for AGREE's assessment criteria [1]. They are summarized by the mnemonic SIGNIFICANCE [3] [1]:
- S - Direct analytical techniques should be applied to avoid sample treatment.
- I - Minimal sample size and minimal number of samples are goals.
- G - In situ measurements should be performed.
- N - Integration of analytical processes and operations saves energy and reduces reagents.
- I - Automated and miniaturized methods should be selected.
- F - Derivatization should be avoided.
- I - Generation of large waste volumes should be avoided; proper waste management should be in place.
- C - Multi-analyte or multi-parameter methods are preferred versus methods using one analyte at a time.
- A - Reagent usage should be minimized, and safer reagents employed.
- N - The energy demand of the method should be minimized.
- C - Reagents from renewable sources should be preferred.
- E - All operators' safety should be increased, and the risk of accidents minimized.
Q3: Where can I find a calculator to perform an AGREE assessment? AGREE is supported by a user-friendly, open-source software calculator [4] [2]. This tool simplifies the assessment process by guiding users through the input parameters and automatically generating the final pictogram and score, ensuring consistency and ease of use.
Q4: My AGREE score is low due to sample preparation. How can I improve it? The sample preparation stage is often a significant source of environmental impact. To improve your score, consider using the AGREEprep metric, a dedicated tool for evaluating sample preparation [4] [2]. AGREEprep is based on 10 principles of green sample preparation and can help you identify specific areas for improvement, such as:
- Transitioning to micro-extraction or miniaturized techniques.
- Implementing on-line or automated sample preparation to reduce solvent use and waste.
- Exploring solvent-less or alternative green extraction techniques.
Q5: How does AGREE fit into the broader concept of White Analytical Chemistry (WAC)? AGREE is a vital component of the White Analytical Chemistry (WAC) framework, where it represents the "green" dimension [5] [2]. WAC advocates for a balanced method assessment across three pillars:
- Red (Quality): Analytical performance and reliability.
- Green (Environment): Environmental impact, assessed by tools like AGREE.
- Blue (Practicality): Practicality, cost, and feasibility of the method. An ideal method should perform well in all three areas, and AGREE is the premier tool for quantifying the green aspect [2].
Troubleshooting Common AGREE Assessment Issues
Problem: The analytical method receives an AGREE score below 0.5, indicating poor greenness.
Solution: Systematically address the principles with the highest penalty. The table below outlines common root causes and targeted mitigation strategies.
Table 1: Troubleshooting a Low AGREE Score
| Root Cause | Diagnostic Check | Corrective Action |
|---|---|---|
| High Hazard Reagent Use | Review safety data sheets (SDS) for all chemicals. | Substitute toxic solvents (e.g., acetonitrile, methanol) with safer alternatives (e.g., water, ethanol, acetone) where chromatographically feasible [6]. |
| Excessive Waste Generation | Calculate total waste volume per analysis. | Miniaturize the method (e.g., use UPLC instead of HPLC, micro-extraction), and investigate solvent recycling programs [2]. |
| High Energy Consumption | Note instrument type and runtime. | Shorten method runtime, use lower-temperature techniques, and turn off instruments when not in use [6]. |
| Inefficient Sample Prep | Audit the number and scale of sample preparation steps. | Automate processes, integrate steps, eliminate unnecessary derivatization, and reduce sample/solvent volumes [1] [4]. |
Inconsistent Scoring
Problem: Different users obtain different AGREE scores for the same method.
Solution: This is often due to subjectivity in interpreting criteria and assigning weights [5]. To ensure consistency:
- Define Objective Metrics: Establish internal guidelines for common criteria. For example, define what constitutes a "high," "medium," or "low" amount of waste based on volume ranges.
- Use Default Weights Judiciously: The AGREE calculator allows for adjusting the weight of each of the 12 principles [5] [4]. For comparative purposes, always use the default weights unless a specific, justified reason exists to change them. Document any weight modifications.
- Cross-Verification: Have a second team member review the assessment inputs to ensure alignment with predefined guidelines.
AGREEprep Assessment Challenges
Problem: Difficulty in quantifying the amount of waste or energy consumption specifically for the sample preparation step [4].
Solution:
- For Waste: Meticulously account for all solvents, reagents, and consumables used only in the sample prep stage. If exact data is unavailable, perform the prep procedure and measure the waste generated.
- For Energy: Sum the energy consumption of all equipment used (e.g., heaters, shakers, centrifuges) for their specific operating times. Use manufacturer specifications for power ratings.
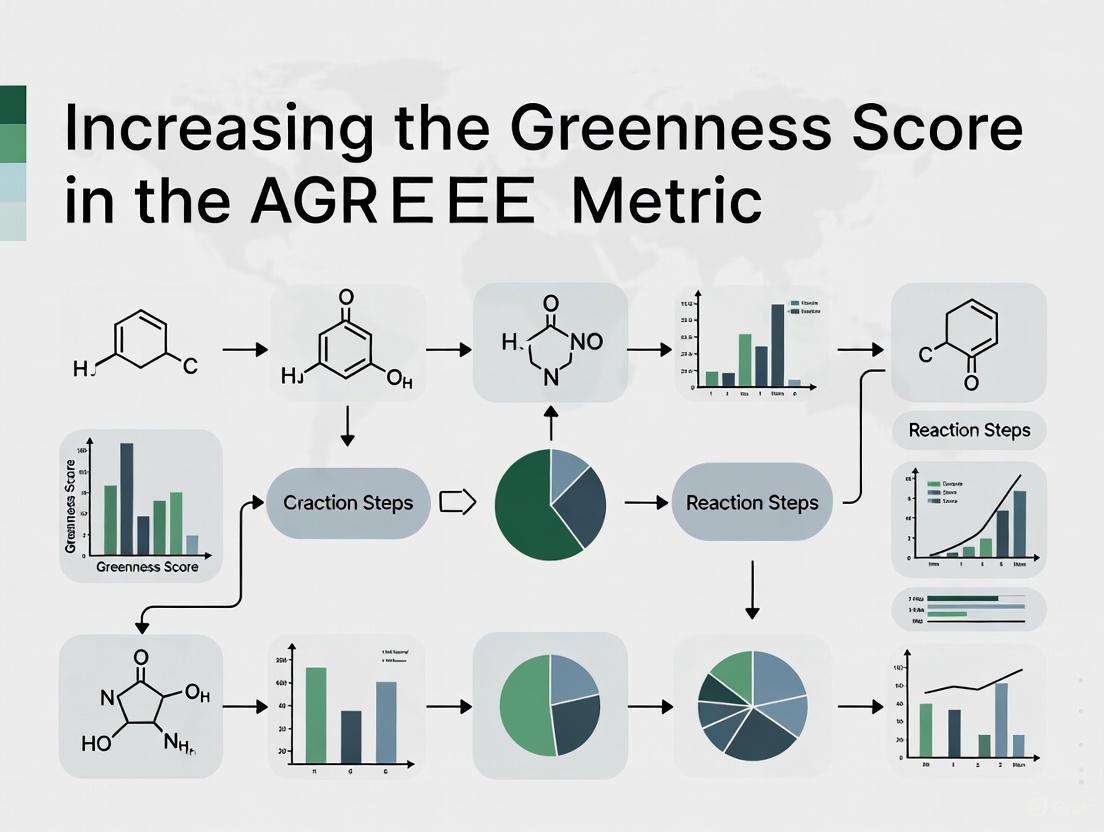
The following workflow diagram illustrates the strategic process for improving your analytical method's greenness using the AGREE metric, from initial assessment to implementation and verification.
Key Reagent Solutions for Greener Methods
Selecting the right reagents and instruments is fundamental to increasing your AGREE score. The following table lists essential items and their role in developing greener analytical methods.
Table 2: Research Reagent Solutions for Improving AGREE Metrics
| Item / Solution | Function in Greener Analysis | Key Benefit |
|---|---|---|
| Safer Solvents (e.g., Water, Ethanol, Acetone) | Replacement for hazardous solvents like acetonitrile and halogenated hydrocarbons in chromatography [6]. | Reduces environmental toxicity and operator risk, directly addressing GAC principles. |
| UPLC/HPLC System | Enables method transfer from HPLC with shorter runtimes and lower solvent flow rates [2]. | Signantly reduces solvent consumption (waste) and energy use per analysis. |
| Micro-extraction Devices (e.g., SPME, MEPS) | Miniaturized sample preparation techniques that require minimal or no solvent [4]. | Dramatically reduces reagent consumption and waste generation. |
| Automated Sample Prep | Integrates and automates steps like dilution, derivation, and extraction [1]. | Improves reproducibility, reduces manual error, and typically uses smaller volumes of reagents. |
| Renewable Sorbents | Use of bio-based materials for sample cleanup and extraction phases [1]. | Lowers the environmental footprint of consumable production and disposal. |
Experimental Protocol: Conducting a Standard AGREE Assessment
This protocol provides a step-by-step methodology for evaluating the greenness of an analytical method using the AGREE metric.
1. Objective: To quantitatively and qualitatively assess the environmental greenness of an analytical method based on the 12 principles of GAC.
2. Materials and Software:
- Description of the analytical method to be assessed (including sample preparation, instrumentation, reagents, and waste data).
- Safety Data Sheets (SDS) for all chemicals used.
- Technical specifications for instruments (e.g., power consumption).
- Access to the open-source AGREE calculator software [2].
3. Procedure: 1. Data Collection: Gather all relevant data for the analytical method. Critical parameters include: * Reagents & Solvents: Type, quantity per analysis, and hazard classifications (from SDS). * Energy: Instrument power consumption (kW) and total runtime per sample. * Waste: Total volume and classification of waste generated per analysis. * Sample Preparation: Number of steps, degree of automation, miniaturization, and use of derivatization. * Operator Safety: Measures taken to reduce exposure to hazardous materials. 2. Software Input: Enter the collected data into the AGREE calculator. The software will prompt for information corresponding to each of the 12 GAC principles. 3. Weight Assignment (Optional): The tool allows for adjusting the importance (weight) of each principle. For standardized comparison, it is recommended to use the default weights unless a specific research context requires a change [5]. 4. Calculation & Visualization: Run the calculation. The software will generate: * A numerical score between 0 (not green) and 1 (ideal green). * A circular pictogram divided into 12 sections, each representing one GAC principle. The sections are colored from red (poor) to green (excellent), providing an immediate visual summary of the method's strengths and weaknesses [2].
4. Interpretation of Results:
- Overall Score: A score >0.75 is generally considered excellent, while a score <0.5 indicates significant room for improvement.
- Pictogram Analysis: Identify the principles with the reddest (least green) sections. These are the primary targets for method optimization. For example, a red section for "Waste" points to a need for miniaturization or solvent recycling, while a red section for "Reagent Toxicity" indicates a need for solvent substitution.
The Analytical GREEness (AGREE) metric is a comprehensive, flexible, and user-friendly assessment tool that evaluates the environmental impact of analytical methods. It calculates a score based on the 12 principles of Green Analytical Chemistry (GAC), which are memorized using the mnemonic SIGNIFICANCE [7]. This framework ensures that all aspects of an analytical procedure—from sample collection to waste disposal—are evaluated for their environmental and safety impacts. The output is an intuitive, clock-like pictogram that provides both an overall score (from 0 to 1) and a visual representation of the method's performance across each of the 12 principles [7]. Understanding this structure is the first step toward systematically improving your method's greenness score.
The SIGNIFICANCE Mnemonic: Principles and Scoring
The 12 principles embedded in the SIGNIFICANCE mnemonic serve as the criteria for the AGREE assessment. The table below decodes each principle, its core requirement, and the typical data required for its evaluation.
Table 1: Decoding the SIGNIFICANCE Mnemonic for AGREE Scoring
| Letter | Principle Number | Principle Description | Key Focus for Data Input |
|---|---|---|---|
| S | 1 | Select direct analytical techniques | Type of analysis (e.g., direct, on-line, off-line); number of sample preparation steps [7]. |
| I | 2 | Integrate analytical processes & operations | Sample size and number of samples; degree of miniaturization [7]. |
| G | 3 | Generate as little waste as possible & perform recycling | Waste volume generated per analysis [7]. |
| N | 4 | Never use large volumes of solvents or reagents; choose safety | Type and volume of solvents/reagents; their safety and hazard profiles [7]. |
| I | 5 | Increase safety for the operator | Operator exposure to hazardous chemicals; use of personal protective equipment (PPE) [7]. |
| F | 6 | Favor methodologies that use minimal energy | Energy consumption of instruments (e.g., kW per sample) [7]. |
| I | 7 | Implement automation and miniaturization of methods | Level of automation; use of miniaturized equipment (e.g., micro-extraction) [7]. |
| C | 8 | Carry out multi-analyte or multi-parameter analyses | Number of analytes determined simultaneously; analytical throughput [7] [8]. |
| A | 9 | Avoid derivatization | Whether a derivatization step is required (which adds reagents and time) [7]. |
| N | 10 | Note that the use of renewable sources is preferred | Source of reagents and materials (e.g., bio-based vs. petroleum-based) [7]. |
| C | 11 | Choose methodologies with a low cost per analysis | Cost of analysis is considered, though not always the primary focus. |
| E | 12 | Eliminate or replace toxic reagents | Toxicity of all chemicals used (solvents, reagents, standards) [7]. |
The relationship between these principles and the final AGREE pictogram is systematic. The AGREE software transforms the input data for each principle into a score on a scale from 0 (not green) to 1 (perfectly green). The final score in the center of the pictogram is a composite of these 12 individual scores. Crucially, the tool allows users to assign a weight to each principle, acknowledging that certain criteria may be more important for a specific application than others [7] [8]. The diagram below illustrates this scoring logic and how individual principle scores are synthesized.
Troubleshooting Guide: Common AGREE Score Issues and Solutions
Researchers often encounter specific challenges when calculating their AGREE score. The following table addresses frequent issues and provides targeted solutions to help improve your score.
Table 2: Frequently Asked Questions (FAQs) for Troubleshooting AGREE Scores
| Question / Issue | Root Cause | Solution / Action |
|---|---|---|
| My score is low due to high waste generation. | Inefficient method design; large solvent volumes in extraction or chromatography [6]. | Miniaturize the method. Switch to micro-extraction techniques (e.g., SPME, MEPS) or use UHPLC with smaller column diameters and lower flow rates to drastically reduce waste volume [7]. |
| How can I improve a poor score in Principle 11 (toxicity)? | Use of hazardous solvents (e.g., chloroform, acetonitrile, n-hexane) [8]. | Replace toxic solvents with safer alternatives. Use solvent selection guides (e.g., ACS GCI's guide). For LC-MS, consider ethanol-water or methanol-water mixtures instead of acetonitrile where possible [6]. |
| The energy consumption (Principle 6) is dragging my score down. | Use of energy-intensive instrumentation over long run times (e.g., traditional GC, HPLC) [7]. | Optimize instrument methods for shorter run times. Use faster heating/cooling cycles. Consider switching to at-line or portable detection systems that consume less energy [7]. |
| Principle 1 (direct analysis) is low, but my sample needs preparation. | Complex samples (e.g., biological, environmental) often require extraction and cleanup, which is penalized [7]. | While direct analysis is ideal, focus on integrating and automating the preparation (Principle 7). Use on-line SPE or in-loop extraction to move from "off-line" to "on-line" analysis, which scores higher [7]. |
| My overall score is acceptable, but I want to optimize it further. | Lack of a strategic approach; not leveraging the weighting feature. | Use the weighting function strategically. If waste and toxicity are your key concerns, assign higher weights (e.g., 4 or 5) to Principles 3, 4, 11, and 12. This highlights your method's superiority in the most critical areas [8]. |
Essential Research Reagent Solutions for a Greener Profile
Selecting the right reagents and materials is a direct and effective way to positively influence your AGREE score, particularly for principles related to toxicity, waste, and the use of renewable sources.
Table 3: Research Reagent Solutions for Improving AGREE Metrics
| Reagent / Material Category | Traditional (Less Green) | Greener Alternative | Principle(s) Impacted |
|---|---|---|---|
| Extraction Solvents | Chloroform, dichloromethane, n-hexane | Ethyl acetate, cyclopentyl methyl ether (CPME), bio-based solvents (e.g., limonene), or deep eutectic solvents (DES) [9]. | P4, P5, P11, P12 |
| Chromatography Mobile Phases | Acetonitrile, methanol with additives | Ethanol-water mixtures, subcritical water chromatography (SWC), or methanol from renewable sources [6] [10]. | P4, P10, P11 |
| Sorbents for Sample Preparation | Synthetic polymers, C18 silica | Bio-sorbents (e.g., chitosan, starch), molecularly imprinted polymers (MIPs), or reusable magnetic nanoparticles [9]. | P10, P12 |
| Derivatization Agents | Highly toxic and unstable reagents (e.g., DNBS, OPA) | Seek direct analysis methods (LC-MS, ICP-MS) to eliminate the derivatization step entirely [7]. | P9, P11, P12 |
| Calibration Standards | Standards prepared in toxic organic solvents | Prepare standards in the initial mobile phase or in water, if solubility allows [6]. | P4, P11 |
Experimental Protocol: A Step-by-Step Guide to AGREE Assessment
To ensure a consistent and accurate evaluation of your analytical method's greenness, follow this detailed experimental protocol. The workflow for this assessment process is summarized in the following diagram.
Step 1: Define Method Scope and Gather Data Clearly outline all steps of your analytical procedure, from sampling to data analysis. Then, systematically collect the quantitative and qualitative data required for each of the 12 SIGNIFICANCE principles as outlined in Table 1 [7]. Key metrics to have on hand include:
- Volumes: Sample size, solvent volumes for extraction and chromatography.
- Quantities: Masses of reagents, sorbents, and other materials.
- Hazard Data: Safety Data Sheets (SDS) for all chemicals to determine toxicity, flammability, and other hazards.
- Energy Data: Power requirements (in kW) of instruments and the total run time per sample.
- Operational Details: Number of samples, number of analytes, degree of automation, and whether derivatization is used.
Step 2: Download and Install the AGREE Software
The AGREE calculator is freely available as open-source software. Download it from the official repository at https://mostwiedzy.pl/AGREE to ensure you are using the correct tool [7].
Step 3: Input Data into the AGREE Software Launch the software and enter the data you gathered in Step 1 into the corresponding fields for each of the 12 principles. The software will typically provide tooltips or guidance for each input. Be as accurate as possible.
Step 4: Assign Weights to the Principles This is a critical step for a meaningful assessment. The default weight for all principles is often 2. However, you should adjust these weights (on a scale of 1 to 5, where 5 is most important) based on your analytical goals and priorities [8]. For example, in a pharmaceutical lab, operator safety (P5) and toxicity (P11) might be weighted higher. In a high-throughput environment, analysis throughput (P8) might be a priority.
Step 5: Calculate the Score and Generate the Pictogram Execute the calculation. The software will generate the characteristic circular pictogram. The overall score (0-1) will be displayed in the center, and the performance for each principle will be shown in the surrounding segments using a color scale (green-yellow-red).
Step 6: Interpret the Results and Identify Improvements Analyze the pictogram. Dark green segments indicate areas where your method is already green. Yellow or red segments highlight aspects that need improvement. Use this diagnostic information to guide your method redevelopment efforts, referring to the troubleshooting guide (Table 2) and reagent solutions (Table 3) for actionable strategies.
This guide helps you accurately interpret the Analytical GREEnness (AGREE) metric pictogram, a key tool for evaluating the environmental friendliness of analytical methods in drug development and scientific research.
The AGREE pictogram provides a visual summary of an analytical method's performance against the 12 principles of Green Analytical Chemistry (GAC). This calculator-based approach transforms complex criteria into an easily interpretable score [7].
The output is a clock-like graph, where the overall score (from 0 to 1) and a color representation appear in the center. Each of the 12 surrounding segments corresponds to one GAC principle, displaying performance through color and segment width [7].
Decoding Scores, Colors, and Segments
The central number and color give an immediate impression of the method's overall greenness:
| Score Range | Color | Interpretation |
|---|---|---|
| 0.8 - 1.0 | Dark Green | Excellent greenness |
| 0.6 - 0.8 | Medium Green | Acceptable greenness |
| 0.4 - 0.6 | Yellow/Yellow-Green | Moderate greenness |
| 0.2 - 0.4 | Orange | Poor greenness |
| 0.0 - 0.2 | Red | Unsatisfactory greenness |
Segment Colors and Widths
Each segment provides specific performance information:
- Segment Color: Indicates performance for that specific principle
- Green → Good performance
- Yellow → Moderate performance
- Red → Poor performance [7]
- Segment Width: Represents the weight assigned to that criterion by the user, reflecting its relative importance in the assessment. Wider segments indicate higher weighted criteria [7].
The 12 Principles of GAC
The AGREE metric evaluates methods against these 12 SIGNIFICANCE principles:
| Principle | Description | High Score Indicator |
|---|---|---|
| 1 | Direct analysis to avoid sample treatment | Remote sensing, non-invasive analysis [7] |
| 2 | Minimal sample size and number of samples | Minimal sample consumption and rapid strategies [7] |
| 3 | In-situ measurements | Measurements taken at the sample location |
| 4 | Integration of analytical operations & device portability | Automated, miniaturized portable equipment |
| 5 | Automated & miniaturized methods | Reduced manual steps and small device footprint |
| 6 | Derivatization avoidance | Direct analysis without chemical modification |
| 7 | Energy reduction & safety | Low energy demand and safe operations |
| 8 | Waste minimization & management | Low waste generation and proper disposal |
| 9 | Multi-analyte or multi-parameter methods | High-throughput simultaneous analysis |
| 10 | Reagent-free or renewable resource use | Alternatives to toxic reagents |
| 11 | Toxicity reduction | Non-toxic chemicals and biodegradable substances |
| 12 | Operator safety | Measures preventing analyst exposure to hazards |
Detailed Scoring for Select Principles
Principle 1: Direct Analytical Techniques
| Sample Pretreatment Activity | Score |
|---|---|
| Remote sensing without sample damage | 1.00 |
| Remote sensing with little physical damage | 0.95 |
| Non-invasive analysis | 0.90 |
| In-field sampling and direct analysis | 0.85 |
| In-field sampling and on-line analysis | 0.78 |
| On-line analysis | 0.70 |
| At-line analysis | 0.60 |
| Off-line analysis | 0.48 |
| External pretreatment (reduced steps) | 0.30 |
| External pretreatment (many steps) | 0.00 |
Principle 2: Minimal Sample Size
This principle uses a complex equation that considers both the mass/volume of sample and the number of samples required. Higher scores are achieved through miniaturized systems and statistical sampling strategies that don't jeopardize sample representativeness [7].
Troubleshooting Common Issues
Problem: The central score is yellow (0.4-0.6) or red (0.0-0.4), indicating poor greenness.
Solutions:
- Identify red or yellow segments in your pictogram - these are your improvement priorities
- For Principle 1 (red/yellow): Explore direct analysis techniques to eliminate sample preparation
- For Principle 8 (red/yellow): Implement waste reduction strategies and proper waste management
- For Principle 11 (red/yellow): Substitute toxic reagents with safer alternatives
Specific Principle Deficiencies
Problem: One or two principles show red segments despite an acceptable overall score.
Solutions:
- Check if the low-scoring principles have been weighted heavily (wider segments)
- Focus improvement efforts specifically on the red-scored principles
- Consult the detailed scoring criteria for those specific principles to identify targeted improvements
Incomplete Data for Assessment
Problem: Missing information makes certain principles difficult to assess accurately.
Solutions:
- Follow Good Evaluation Practice (GEP) rules: use quantitative indicators based on empirical data where possible [11]
- For energy consumption (Principle 7): Use a wattmeter to measure actual electricity usage
- For waste generation (Principle 8): Precisely measure mass/volume of all waste streams
- Document all methodology details to enable accurate assessment
Key Reagents and Materials for Green Chemistry
| Item | Function in Green Chemistry |
|---|---|
| Wattmeter | Measures exact energy consumption of instruments for Principle 7 scoring |
| Miniaturized equipment | Reduces sample and reagent consumption (Principles 2, 5) |
| Portable analytical devices | Enables in-situ measurements (Principles 3, 4) |
| Automated systems | Reduces manual operations and human error (Principle 5) |
| Safer solvent alternatives | Replaces toxic reagents (Principles 10, 11) |
| Waste tracking system | Monitors and quantifies waste generation (Principle 8) |
Frequently Asked Questions
How can I improve my method's AGREE score?
Focus on principles with red or yellow scores in your pictogram. Common improvement areas include reducing sample preparation steps (Principle 1), minimizing waste (Principle 8), replacing toxic reagents (Principle 11), and reducing energy consumption (Principle 7).
Why are some segments wider than others in my pictogram?
Segment width reflects the weight you assigned to each criterion. Wider segments indicate principles you deemed more important for your specific assessment. This allows customization based on analytical goals and priorities.
Is a high AGREE score mandatory for publishing my method?
No, AGREE assessment is not always mandatory but is increasingly recommended. While analytical validation remains essential, greenness assessment provides valuable environmental context, particularly for methods claiming environmental benefits or comparing alternatives [11].
What's the difference between AGREE and other greenness metrics?
AGREE is more comprehensive than earlier metrics like NEMI, evaluating all 12 GAC principles rather than just a few criteria. It provides both quantitative scoring and visual interpretation, with flexibility to weight criteria based on importance [7].
The Analytical GREEnness (AGREE) metric is a comprehensive tool designed to evaluate the environmental impact of analytical methods. Unlike simpler scoring systems, a core feature of AGREE is its incorporation of user-defined weights, allowing researchers to tailor the greenness assessment to their specific priorities and constraints [7].
The AGREE calculator evaluates an analytical procedure against the 12 principles of green analytical chemistry (GACC). Each principle is scored and then combined into a final overall score between 0 and 1, where a score closer to 1 indicates a greener method [7]. The user-assigned weights, which determine the relative importance of each of the 12 principles, are critical in this calculation. This flexibility recognizes that the definition of "greenness" can vary; for one lab, minimizing waste might be paramount, while for another, reducing energy consumption or the use of hazardous solvents could be the primary driver [7]. By adjusting these weights, you directly control how these different aspects of greenness influence the final score, making the AGREE metric a dynamic and customizable tool for driving sustainable practices in research.
Troubleshooting Guide: AGREE Score Calculations
My AGREE score seems incorrect. How can I verify my inputs?
Problem Identification You have calculated an AGREE score, but the result seems unexpectedly high or low, potentially due to an error in how the criteria were scored or weighted.
Troubleshooting Steps [12]
- Re-check Principle Scores: Confirm that you have correctly scored each of the 12 GACC principles. AGREE transforms qualitative descriptions of your method into a unified 0–1 scale for each principle. Ensure your inputs for parameters like sample size, waste amount, and energy consumption are accurate [7].
- Verify Weight Assignments: The most common source of unexpected results is incorrect weight assignment. In the AGREE pictogram, the width of each segment reflects the weight you assigned to that principle [7]. Double-check that you have applied the intended weights (e.g., 1 for low importance, 2 for medium, 3 for high) and that they correctly reflect your priorities.
- Review the Calculation: The final AGREE score is the product of the assessment results for each principle [7]. Use the official, open-source AGREE software to automate this process and reduce human calculation error [7].
- Compare with Default Weights: Run the calculation again with all weights set to the default value (e.g., 1). If the score changes significantly, it confirms that your custom weights are the primary factor influencing the result.
Visual Aid The diagram below illustrates the workflow for troubleshooting an unexpected AGREE score.
Problem Identification You want to optimize your analytical method's AGREE score but are unsure how to strategically assign weights to the 12 principles to reflect improvement efforts best.
Troubleshooting Steps
- Conduct a Baseline Assessment: First, calculate your AGREE score with all weights set equally. This provides a baseline and highlights which principles are naturally scoring low and dragging your overall result down [7].
- Identify Modifiable Principles: Analyze the low-scoring principles from your baseline. Determine which ones can be realistically improved through methodological changes. For example, reducing sample size (Principle 2) or switching to a less hazardous solvent (Principle 6) might be feasible [7].
- Assign Higher Weights to Modifiable Principles: Strategically increase the weights for the principles you have identified as both low-scoring and modifiable. This tells the scoring algorithm that improvements in these critical areas should have a greater positive impact on your final score [7].
- De-emphasize Fixed Constraints: If certain principles have low scores due to unchangeable instrumental or procedural constraints, you can assign them a lower weight. This minimizes their negative impact on the overall score, allowing your improvements in other areas to shine [6].
Visual Aid The following flowchart guides the strategic assignment of weights to optimize an AGREE score.
Frequently Asked Questions (FAQs)
Q1: What is the difference between the AGREE score and the pictogram? The AGREE score is a single number between 0 and 1 in the center of the pictogram, providing a quick, quantitative measure of overall greenness [7]. The pictogram is the circular graph surrounding the score. It offers qualitative insights by showing the performance for each of the 12 principles (via color) and the relative importance you assigned to each principle (via the segment width) [7]. The pictogram helps you understand why you got a certain score.
Q2: Can I directly compare AGREE scores from two studies if they used different weights? No, comparing scores from assessments that used different weight assignments is not valid. Since the user-defined weights directly influence the final score, a higher score might simply reflect a different set of priorities rather than a genuinely greener method [7]. For a fair comparison, you must ensure both methods are evaluated using the same set of weights.
Q3: I've improved my method. Should I change the weights when I re-calculate the score? It depends on your goal. If you want to see the absolute improvement of your method changes, keep the weights the same as your original assessment. This isolates the effect of the methodological improvements. If your organizational priorities have shifted (e.g., a new focus on energy reduction), then updating the weights to reflect these new strategic goals is appropriate for future assessments [7] [6].
Q4: Where can I find the official AGREE calculator? The open-source AGREE software is freely available for download at https://mostwiedzy.pl/AGREE [7]. Using the official software ensures accurate calculations and generates the standardized pictogram output.
Experimental Protocol for Method Greenness Assessment
This protocol provides a step-by-step methodology for evaluating the greenness of an analytical method using the AGREE metric, with a focus on the strategic use of weights.
1. Define Assessment Goal and Scope: Clearly state the objective of the greenness assessment (e.g., internal benchmarking, comparison of two methods, publication). Define the analytical method being evaluated, including all steps from sample collection to data analysis [6].
2. Gather Method Data: Collect all necessary quantitative and qualitative data for the method. Key parameters to document include:
- Sample size and number of samples [7].
- Type, volume, and toxicity of all solvents and reagents used [6].
- Mass of waste generated [7].
- Energy consumption of equipment (e.g., kWh per run) [6].
- Number of procedural steps and degree of automation [7].
3. Establish Weighting Scheme: Convene a team of relevant stakeholders (e.g., lead scientists, lab managers, safety officers) to assign weights to the 12 GACC principles. This can be done through a collaborative discussion or workshop to align on organizational priorities and avoid individual biases [13] [14]. Document the rationale for the assigned weights.
4. Input Data into AGREE Tool: Enter the collected method data and the assigned weights into the official AGREE calculator software [7].
5. Generate and Interpret Results: The software will output the overall AGREE score and the pictogram. Analyze the pictogram to identify segments with poor performance (red or yellow) and correlate them with the corresponding principles.
6. Develop an Improvement Plan: Based on the results, prioritize modifications to the analytical method that target low-scoring, highly-weighted principles. For example, if waste generation (aligned with GACC principles) is a red segment with a high weight, focus on miniaturization or solvent recycling strategies [6].
7. Re-assess and Iterate: After implementing method improvements, repeat the AGREE assessment using the original weighting scheme to quantitatively measure the progress in greenness.
The Scientist's Toolkit: Key Reagents and Concepts for Green Method Development
Table: Essential Concepts and Strategies for Greener Analytical Chemistry
| Concept / Strategy | Function / Role in Increasing Greenness |
|---|---|
| Miniaturization | Reducing the scale of analyses (e.g., using micro-extraction techniques, smaller columns in HPLC) to directly minimize sample size, reagent consumption, and waste generation, positively impacting several AGREE principles [7]. |
| Alternative Solvents | Replacing hazardous solvents (e.g., acetonitrile) with safer, bio-based, or less toxic alternatives (e.g, ethanol) to improve safety profiles and reduce environmental impact [6]. |
| Method Automation | Implementing automated sample preparation and analysis to enhance throughput, improve reproducibility, and reduce manual handling of hazardous materials, while often also optimizing resource use [6]. |
| Energy-Efficient Instrumentation | Utilizing modern analytical equipment designed for lower energy consumption (e.g., UHPLC vs. HPLC) or implementing sleep-mode protocols to directly address the energy-related principles in AGREE [6]. |
| Waste Management Plan | Implementing procedures for sorting, recycling, or treating chemical waste generated from analytical processes, which is a critical factor in the overall greenness assessment [7]. |
Table: AGREE Principle Scoring Examples for a Hypothetical Chromatographic Method
| GACC Principle | Example Assessment Criteria | Low Greenness Score (e.g., 0.2) | High Greenness Score (e.g., 0.9) | User Weight (Example: High Importance) |
|---|---|---|---|---|
| Principle 1: Direct Analysis | Number of sample prep steps | Multi-step offline preparation | Direct, in-line analysis | 2 |
| Principle 2: Sample Size | Volume/Mass required | > 1 mL or 1 g | < 0.1 mL or 0.1 g | 3 |
| Principle 6: Toxicity | Hazard profile of reagents | Use of highly toxic solvents | Use of water or ethanol-based solvents | 3 |
| Principle 9: Waste Generation | Mass of waste per analysis | > 10 g | < 1 g | 2 |
| Principle 12: Operator Safety | Exposure to hazards | High risk, requires extensive PPE | Minimal risk, standard lab attire | 3 |
Final Score Calculation Note: The overall AGREE score is not a simple weighted average but the product of the transformed scores for each principle [7]. This means a very low score in any principle (especially a highly weighted one) can significantly drag down the final result, emphasizing the need for a balanced approach to green method design.
Selecting the right metric is crucial for accurately evaluating the environmental impact of analytical methods in pharmaceutical development. This guide compares four prominent greenness assessment tools—AGREE, NEMI, GAPI, and Analytical Eco-Scale—to help researchers navigate their unique features and applications. The following sections provide a detailed comparison, troubleshooting advice, and practical strategies for improving your method's greenness profile, directly supporting the broader goal of enhancing AGREE metric scores in analytical research.
Understanding the Greenness Assessment Tools
1.1 National Environmental Methods Index (NEMI) NEMI is a simple, pictogram-based tool where a circle is divided into four quadrants. Each quadrant is colored green if a criterion is met or left white if not. The criteria are: the method does not use persistent, bioaccumulative, and toxic (PBT) reagents; it does not use hazardous reagents listed on the TRI (Toxic Release Inventory); the amount of waste generated is less than 50 g; and the pH is not corrosive (2 < pH < 12) [7] [15]. Its primary advantage is simplicity, but this also limits its descriptive power [16].
1.2 Analytical Eco-Scale This tool is a semi-quantitative scoring system. It starts with a base score of 100 points and subtracts penalty points for the use of hazardous reagents, the amount of waste generated, energy consumption, and other health and safety hazards [7] [15]. The final score is interpreted as: >75 representing an excellent green analysis, >50 representing acceptable green analysis, and <50 representing inadequate green analysis [17].
1.3 Green Analytical Procedure Index (GAPI) GAPI uses a multi-criteria pictogram with five pentagrams, each representing a different stage of the analytical process (e.g., sampling, sample preparation, instrumentation). Each segment is colored green, yellow, or red based on the environmental impact of that specific step [16] [15]. It provides a more detailed assessment than NEMI but is also more complex to create [16].
1.4 Analytical GREEnness (AGREE) Metric Approach AGREE is a comprehensive calculator that evaluates methods against all 12 principles of Green Analytical Chemistry (GAC). It uses a user-friendly, open-source software to generate a clock-like pictogram [7]. The tool assigns a score between 0-1 for each principle, and a final overall score from 0-1 is displayed in the center, with a color scale from red to dark green. A key advantage is its ability to assign different weights to each criterion based on user-defined priorities, offering a nuanced and flexible assessment [7] [16].
Table 1: Summary of Greenness Assessment Tool Characteristics
| Tool Name | Type of Output | Scoring Range | Key Advantages | Reported Limitations |
|---|---|---|---|---|
| NEMI | Pictogram (4 quadrants) | Binary (Green/White) | Simple, quick visual assessment [16] | Lacks granularity; poor discriminative power [16] |
| Analytical Eco-Scale | Numerical Score | 0-100 (100 = Ideal) | Semi-quantitative; easy to interpret [16] | Penalty points can be subjective [15] |
| GAPI | Detailed Pictogram | Traffic Light (Red/Yellow/Green) | Comprehensive; covers entire method lifecycle [15] | Complex to create without software [16] |
| AGREE | Circular Pictogram & Numerical Score | 0-1 (1 = Ideal) | Comprehensive; based on 12 GAC principles; flexible weighting [7] | Requires dedicated software for calculation |
Comparative Analysis and Troubleshooting
Direct Comparison of Tool Outputs
Independent studies have applied these tools to evaluate analytical methods, revealing important differences in their discriminatory power.
Table 2: Comparative Greenness Scores from Practical Case Studies
| Case Study | Analytical Method | NEMI | Analytical Eco-Scale | GAPI | AGREE |
|---|---|---|---|---|---|
| Melatonin Analysis [18] | HPLC-PDA | Not Specified | Not Specified | Not Specified | 0.77 (Overall Score) |
| Melatonin Analysis [18] | HPLC-FLD | Not Specified | Not Specified | Not Specified | 0.80 (Overall Score) |
| Melatonin Analysis [18] | HPLC-ELSD | Not Specified | Not Specified | Not Specified | 0.75 (Overall Score) |
| Cannabinoids in Oils [17] | HPLC-UV/MS (8 methods) | Not Specified | 50-80 (7 methods: Acceptable; 1 method: Excellent) | Not Specified | Not Specified |
| Hyoscine N-butyl bromide [16] | 16 Chromatographic Methods | 14 methods had identical pictograms [16] | Scores varied, providing a ranking [16] | Pictograms showed distinct differences [16] | Scores varied (e.g., 0.27 vs. 0.49), highlighting weakest points [16] |
Frequently Asked Questions (FAQs)
Q1: My method received a low AGREE score. How can I improve it? Start by examining the AGREE pictogram's outer segments, which are colored red or yellow. These indicate the GAC principles where your method performs poorly. Common improvements include: replacing toxic solvents with safer alternatives (e.g., ethanol or water), miniaturizing the method to reduce waste and sample size, automating procedures to increase throughput and safety, and integrating sample preparation and analysis to eliminate off-line steps [18] [7].
Q2: Why should I use multiple tools to assess my method's greenness? Each tool has a different focus. Using only one can give an incomplete picture. For example, a method might score well on the simple NEMI scale but poorly on the more comprehensive AGREE metric. Employing multiple tools (e.g., AGREE, Analytical Eco-Scale, and GAPI) provides a more robust and holistic evaluation, ensuring you don't overlook significant environmental impacts [16] [15].
Q3: What is the most significant advantage of AGREE over other tools? AGREE's two greatest advantages are its comprehensiveness, as it is the only tool that directly incorporates all 12 principles of GAC, and its flexibility, allowing users to assign different weights to each principle based on their specific analytical goals and priorities [7] [16].
Q4: I find GAPI complex. Is there a simpler alternative that is still descriptive? Yes, the AGREE tool is an excellent alternative. While both GAPI and AGREE provide detailed, multi-criteria assessments, AGREE automates the calculation and score visualization through its software, making it simpler and faster to implement while providing an easily interpretable result [16].
Troubleshooting Common Assessment Issues
Problem: Inconsistent greenness scores between different tools.
- Cause: This is expected, as each tool uses different criteria and algorithms. NEMI is binary and simple, while AGREE and GAPI are multi-parametric and more sensitive.
- Solution: Do not view this as an error. Instead, analyze the discrepancies. For instance, a good NEMI score but a poor AGREE score suggests your method meets basic criteria but fails on more nuanced GAC principles. Use the outcome of multiple tools to guide comprehensive method optimization [16].
Problem: Difficulty in calculating the energy consumption for the AGREE metric.
- Cause: Exact energy consumption of instrumentation is often not provided in analytical method literature.
- Solution: Make reasonable estimations based on the equipment used. For example, a standard HPLC system consumes more energy than a capillary electrophoresis system. AGREE allows for scoring based on these general energy demands. Refer to the AGREE tutorial and software for guidance on standardized scoring for this principle [7].
Problem: The AGREE software gives a low score for a method I believe is green.
- Cause: The default settings in AGREE assign equal weight to all 12 principles. Your method might excel in the areas you prioritize but perform poorly in others the tool deems important.
- Solution: Use the weighting function in the AGREE software. If your method requires a specific, less-green reagent for sensitivity reasons, you can lower the weight of that principle, providing a more tailored and realistic greenness assessment for your specific context [7].
Experimental Protocols for Green Method Development
Protocol: Transition to a Greener HPLC Mobile Phase
This protocol is based on a study that developed green HPLC methods for Melatonin using ethanol-water mobile phases [18].
- Initial Method Assessment: Begin with your existing HPLC method (e.g., using an acetonitrile-water or methanol-water mobile phase). Assess its starting greenness using AGREE to establish a baseline.
- Solvent Substitution: Replace the organic solvent (ACN or MeOH) with a greener alternative, such as ethanol (EtOH) or isopropanol [18].
- Method Re-optimization: Re-optimize the chromatographic conditions (gradient, flow rate, column temperature) with the new ethanol-water mobile phase to achieve baseline separation of your analytes. This may require testing different ratios of ethanol and water.
- Validation: Validate the new method according to ICH guidelines to ensure it meets required parameters for sensitivity, linearity, precision, and accuracy.
- Final Greenness Assessment: Recalculate the AGREE score for the new method. The replacement of a toxic solvent with ethanol should significantly improve the score in the relevant categories [18].
Protocol: AGREEprep for Sample Preparation
AGREEprep is a dedicated metric for evaluating the greenness of sample preparation steps, which are often the least green part of an analytical process [4].
- Define the Sample Preparation Workflow: List every step of your sample preparation, including the type and volume of solvents, materials (e.g., sorbents for SPE), energy consumption, and waste generation.
- Input Data into Software: Use the dedicated, open-source AGREEprep software. Input the collected data for the ten assessment criteria, which correspond to the ten principles of green sample preparation.
- Interpret the Pictogram: The software will generate a pictogram similar to AGREE. Analyze the results to identify the aspects of your sample prep with the highest environmental impact (red and yellow segments).
- Optimize and Reassess: Modify your sample preparation to address the weak points—for example, by reducing solvent volumes, switching to a less toxic solvent, or implementing miniaturized techniques like micro-extraction. Re-run the AGREEprep assessment to quantify your improvement [4].
Visualization of the AGREE Assessment Framework
The diagram below illustrates the logical workflow and criteria behind the AGREE metric, showing how the 12 principles contribute to the final score.
AGREE Metric Calculation Workflow: This diagram shows how data for each of the 12 Green Analytical Chemistry (GAC) principles are input into the AGREE software, which processes them to generate the final circular pictogram and overall score [7].
The Scientist's Toolkit: Key Reagents for Greener Chromatography
Table 3: Research Reagent Solutions for Improving Method Greenness
| Reagent / Material | Traditional Less-Green Alternative | Function in Analysis | Greenness Benefit |
|---|---|---|---|
| Ethanol | Acetonitrile, Methanol | HPLC mobile phase solvent [18] | Lower toxicity, biodegradable, renewable source [18]. |
| Water | Buffers with toxic additives | HPLC mobile phase solvent | Non-toxic, non-hazardous, readily available. |
| C18 Column | Specialized columns requiring harsh solvents | Stationary phase for separation | Enables use of green mobile phases like ethanol-water [18]. |
| Micro-Scale SPE Cartridges | Conventional SPE cartridges | Sample preparation / clean-up | Reduces solvent consumption and waste generation per sample. |
Practical Application: Implementing AGREE in Your Analytical Workflow
Step-by-Step Guide to Using the AGREE Open-Source Software
Frequently Asked Questions (FAQs)
Q1: What is the AGREE metric, and why is it important for my research? AGREE (Analytical GREEnness) is a comprehensive metric tool designed to evaluate the environmental impact of analytical methods. It provides a visual and numerical score based on the 12 principles of Green Analytical Chemistry (GAC), offering a quick and interpretable assessment of a method's sustainability [19] [20]. For researchers and drug development professionals, using AGREE is crucial for minimizing the environmental footprint of laboratory work, aligning with global sustainability goals, and meeting increasing regulatory and peer-review expectations for green method reporting [6] [19].
Q2: Where can I access the AGREE open-source software? The AGREE calculator is available online. The tool was developed and made accessible to help analysts easily evaluate their methods [20].
Q3: My AGREE score is low. What are the most effective ways to improve it? A low overall score indicates significant environmental impact. The most effective strategy is to focus on the criteria with the lowest individual scores, as these are your method's biggest sustainability weaknesses. Common areas for improvement include:
- Reducing solvent and energy consumption [6].
- Substituting hazardous solvents with safer, greener alternatives [6].
- Minimizing waste generation and enabling waste recycling [5].
- Automating the procedure or implementing real-time analysis to reduce resource use [20].
Q4: Can I use AGREE for techniques other than chromatography? Yes. While some metric tools are specific to chromatography, AGREE is a general tool applicable to a wide range of analytical techniques [20]. It was designed to provide a consistent framework for assessing greenness across different methodological approaches [5].
Q5: How does AGREE differ from other greenness assessment tools like GAPI or NEMI? AGREE offers a more comprehensive and nuanced evaluation than earlier tools. Unlike NEMI, which uses a simple pass/fail system for four criteria, or the semi-quantitative Eco-Scale, AGREE provides a weighted score based on 12 criteria corresponding to the GAC principles. It also generates an intuitive circular pictogram, offering a clearer visual overview of the method's performance across all principles compared to GAPI [19] [20].
Q6: What are the common sources of error or subjectivity when using the AGREE calculator? Subjectivity can arise from the interpretation of certain input parameters that are not directly measurable. The overall score can also be influenced by the default weights assigned to each of the 12 principles. While the tool allows weight adjustment, most users rely on the defaults, which assume all principles are of equal importance. Ensuring accurate, consistent, and justified inputs for each criterion is key to obtaining a reliable and reproducible score [5].
Troubleshooting Common AGREE Issues
Issue 1: Difficulty Interpreting the AGREE Pictogram and Score
| Symptom | Likely Cause | Solution |
|---|---|---|
| The overall score is low, but it's unclear which areas to improve. | The circular pictogram has several red or yellow sections, but the specific weaknesses are not prioritized. | Hover over or examine each of the 12 sections of the pictogram. Each section corresponds to one GAC principle. Identify the sections with the lowest scores (closest to red) and focus your method optimization efforts on those specific principles first [5]. |
| Uncertainty about what a specific section of the pictogram represents. | Lack of familiarity with the 12 principles of Green Analytical Chemistry. | Consult the original AGREE publication or supporting documentation to understand the exact meaning of each principle (e.g., principle 1: direct analysis, principle 2: waste minimization, etc.) [20]. |
Issue 2: Challenges in Selecting Input Parameters for the AGREE Calculator
| Symptom | Likely Cause | Solution |
|---|---|---|
| Not knowing the exact energy consumption of an instrument for a single analysis. | Instruments are often not monitored for per-method energy use. | Calculate energy use by multiplying the instrument's power rating (in kW) by the method's runtime (in hours). If the power rating is unknown, use a standard default value for the instrument type or consult the manufacturer's specifications [6]. |
| Difficulty in assessing the "greenness" of a solvent or chemical. | Lack of a standardized, multi-faceted metric for solvent safety, toxicity, and environmental impact. | Use established solvent selection guides, such as the CHEM21 guide, or refer to the safety, health, and environment (EHS) scores and life cycle assessment (LCA) data that tools like the Analytical Method Greenness Score (AMGS) utilize [6]. |
| Uncertainty about how to account for sample preparation steps. | AGREE evaluates the entire method, but sample preparation can be complex. | Use AGREEprep, a sister metric tool specifically designed for a more detailed assessment of the sample preparation stage. This allows for a more accurate and granular greenness evaluation of the entire workflow [20]. |
Issue 3: Strategies for Improving a Low AGREE Score
| Symptom | Likely Cause | Solution |
|---|---|---|
| High solvent energy and EHS penalty (e.g., from using acetonitrile in HPLC). | Use of hazardous, energy-intensive, or toxic solvents. | Switch to greener solvents. For example, replace acetonitrile with alternatives like ethanol or methanol. The ACS Solvent Selection Guide can help identify suitable alternatives with better environmental profiles [6]. |
| High penalty from waste generation. | Large volumes of solvent waste per analysis, with no recycling. | Miniaturize the method. Scale down to micro- or nano- flow rates in LC to drastically reduce solvent consumption and waste. Implement waste recycling protocols for non-hazardous solvents where possible [6] [20]. |
| Low score on automation and direct analysis principles. | Manual, multi-step sample preparation and offline analysis. | Automate sample preparation to improve efficiency and reduce solvent use. Explore direct analysis techniques (e.g., spectroscopic probes) that require little to no sample preparation, thereby addressing multiple GAC principles at once [20]. |
Experimental Protocol for AGREE Score Assessment and Improvement
This protocol provides a step-by-step methodology to evaluate an analytical method using the AGREE metric and implement changes to increase its greenness score.
1. Method Scoping and Baseline Assessment
- Objective: Establish the current greenness profile of your existing analytical method.
- Procedure:
- Compile all method parameters: instrument type, runtime, solvent types and volumes for mobile phases and sample preparation, sample size, and waste volumes.
- Access the online AGREE calculator.
- Input all gathered parameters into the corresponding fields of the calculator. Be as accurate as possible; estimate using the troubleshooting guide above if precise data is unavailable.
- Record the overall AGREE score (from 0 to 1) and download or screenshot the resulting pictogram. This is your baseline assessment.
2. Data Analysis and "Green Bottleneck" Identification
- Objective: Analyze the AGREE output to identify the specific principles with the lowest scores, which represent the largest opportunities for improvement.
- Procedure:
- Systematically examine each of the 12 sections of the AGREE pictogram.
- Create a table to list the three principles with the lowest individual scores.
| Principle Number | Score | Related Method Parameter | Improvement Strategy |
|---|---|---|---|
| e.g., Principle 6 (Energy Consumption) | 0.3 | HPLC system, 30-minute runtime | Switch to UHPLC to reduce runtime to 10 minutes. |
| e.g., Principle 2 (Waste Generation) | 0.4 | 2 mL/min flow rate, 60 mL waste per run | Reduce flow rate to 1 mL/min or implement a waste recycling system. |
| Principle 4 (Operator Safety) | 0.5 | Use of toxic solvent (e.g., chloroform) | Substitute with a less hazardous solvent (e.g., ethyl acetate). |
3. Method Optimization and Redevelopment
- Objective: Implement practical changes to the analytical method to address the identified "green bottlenecks."
- Procedure:
- Based on the table above, prioritize and test the proposed improvement strategies. A holistic approach often yields the best results. For example, switching from HPLC to UHPLC not only reduces runtime (saving energy) but also typically uses lower flow rates (saving solvent and reducing waste) [6].
- A key strategy is method substitution or simplification. Explore if a different, greener analytical technique can achieve the same analytical goal. For instance, Near-Infrared (NIR) spectroscopy often requires minimal sample preparation and no solvents, significantly improving the greenness profile [20].
- After each modification, re-run the AGREE calculator to quantify the improvement in the score and pictogram.
4. Validation and Verification
- Objective: Ensure that the optimized "greener" method maintains the required analytical performance (accuracy, precision, sensitivity).
- Procedure:
- Perform a full method validation according to ICH or other relevant guidelines on the optimized method.
- Compare the validation results (e.g., precision, accuracy, LOD, LOQ) with those of the original method to confirm that analytical quality has not been compromised. The core tenet of Green Analytical Chemistry is that sustainability should not come at the expense of patient safety or data quality [6].
The Scientist's Toolkit: Research Reagent & Material Solutions
The following table details key materials and strategies for developing greener analytical methods, directly impacting AGREE scores.
| Item/Strategy | Function in Green Method Development | Example & Impact on AGREE Score |
|---|---|---|
| Greener Solvents | To replace hazardous, toxic, or energy-intensive solvents in mobile phases and sample preparation. | Substituting acetonitrile with ethanol or methanol in HPLC reduces penalties for operator safety and toxicity, improving scores in Principles 4 and 8 [6]. |
| Method Miniaturization | To drastically reduce the consumption of solvents, samples, and other reagents. | Using UHPLC with 2.1 mm columns at 0.2 mL/min instead of HPLC with 4.6 mm columns at 1.5 mL/min can reduce solvent consumption and waste by over 85%, positively impacting Principles 2, 6, and 12 [6]. |
| Automated Sample Preparation | To improve efficiency, reduce manual labor, minimize human error, and lower solvent/reagent use. | An automated solid-phase extraction (SPE) system uses precise, small volumes of solvent, enhancing scores for waste (Principle 2), energy (Principle 6), and potentially operator safety (Principle 4) [20]. |
| Direct Analysis Techniques | To enable analysis with minimal or no sample preparation steps, eliminating associated solvents and waste. | Using a direct-injection mass spectrometry technique or a spectroscopic probe avoids all sample preparation solvents, dramatically increasing scores for Principles 1 (direct analysis) and 2 (waste minimization) [20]. |
| Solvent Recycling Systems | To collect, purify, and reuse solvents from analytical runs, reducing waste and consumption. | Implementing an acetonitrile recycling system for HPLC waste reduces the net amount of hazardous waste generated, directly improving the score for Principle 2 [6]. |
AGREE Evaluation and Optimization Workflow
The diagram below illustrates the logical workflow for assessing and improving your analytical method's greenness score using the AGREE metric.
Frequently Asked Questions
What is the AGREE metric and what does it assess?
The AGREE (Analytical GREEnness) metric is a comprehensive assessment tool that evaluates the environmental impact and safety of analytical procedures based on the 12 principles of Green Analytical Chemistry (GAC). It provides a score from 0-1, with higher scores indicating greener methods, and presents results in an intuitive clock-like pictogram that shows performance across all criteria [7].
Why is proper data collection crucial for an accurate AGREE assessment?
Proper data collection ensures your greenness assessment is reproducible, meaningful, and comparable. Incomplete or inaccurate data leads to misleading scores that don't reflect your method's true environmental impact. Standardized data collection also allows for meaningful comparisons between different analytical methods and helps identify specific areas for improvement [9].
What are the most common data gaps in AGREE assessments?
Researchers most frequently lack precise data on waste generation, energy consumption of equipment, and toxicity profiles of all reagents used. Sample preparation steps often lack detailed documentation of solvent volumes and number of procedural steps. Many also struggle with quantifying the "greenness" of their final determination technique [4] [9].
Troubleshooting Guides
Problem: Inconsistent AGREE Scores Between Similar Methods
Symptoms: Two analytically similar procedures yield significantly different AGREE scores without clear justification.
Solution:
- Verify all input data uses consistent units (particularly for waste, energy, and sample size)
- Ensure identical weighting factors are applied to all assessment criteria
- Confirm toxicity assessments use the same data sources for all reagents
- Cross-validate with a second metric tool (like Analytical Eco-Scale) to identify discrepancies [9]
Symptoms: Final assessment shows predominantly red/orange segments in the pictogram.
Solution:
- For waste reduction: Implement micro-extraction techniques or method miniaturization
- For energy reduction: Switch to ambient temperature procedures or automated systems that power down when idle
- For toxicity issues: Replace hazardous solvents with safer alternatives (e.g., water, ethanol, or bio-based solvents)
- For sample treatment: Combine preparation steps or eliminate unnecessary derivatization [7] [9]
Problem: Specific Low Scores in Sample Preparation (AGREEprep)
Symptoms: Poor performance in Principles 1 (direct analysis), 2 (minimal sample size), and 5 (miniaturization) in the AGREEprep assessment.
Solution:
- Document exact sample volumes and number of preparation steps
- Calculate total waste generated including all solvents and materials
- Switch to in-field or on-line analysis where possible to avoid sample transport
- Reduce sample size through miniaturized extraction techniques
- Automate preparation steps to improve reproducibility and reduce reagent consumption [4]
Essential Data Collection Tables for AGREE Assessment
Sample and Reagent Documentation
Table 1: Data requirements for sample and reagent documentation
| Data Category | Specific Information Needed | Measurement Units | Source Documentation |
|---|---|---|---|
| Sample Size | Mass or volume used per analysis | g or mL | Method protocol |
| Number of Samples | Total samples analyzed in batch | Count | Study design |
| Reagents & Solvents | Exact names, quantities, concentrations | mL, mg, mmol | Laboratory notebook |
| Solvent Origins | Renewable vs. petroleum-based | Categorical (Yes/No) | Safety Data Sheets |
| Toxicity Data | GHS hazard classifications, LD50 values | Categorical, mg/kg | Safety Data Sheets |
Waste and Energy Documentation
Table 2: Data requirements for waste and energy assessment
| Data Category | Specific Information Needed | Measurement Units | Calculation Method |
|---|---|---|---|
| Total Waste | Sum of all waste streams per analysis | g or mL | Sum of all inputs minus analytes |
| Energy Consumption | Power requirements of all equipment | kWh per analysis | (Power rating × time)/samples per batch |
| Sample Preparation | Number of discrete steps | Count | Method protocol |
| Analysis Type | Remote, in-field, on-line, at-line, off-line | Categorical | Method description |
| Throughput | Samples analyzed per hour | Samples/hour | Total samples/total analysis time |
AGREE Assessment Workflow
AGREE Assessment Workflow
Research Reagent Solutions for Greener Methods
Table 3: Alternative reagents and materials for improving greenness scores
| Material Category | Traditional Materials | Greener Alternatives | Environmental Benefit |
|---|---|---|---|
| Extraction Solvents | Chloroform, hexane, dichloromethane | Ethyl acetate, cyclopentyl methyl ether, bio-based solvents | Reduced toxicity, biodegradability |
| Solvents for Chromatography | Acetonitrile, methanol | Ethanol, water with modifiers | Reduced hazardous waste |
| Sorbents | Synthetic polymers | Natural materials (silica, chitosan) | Renewable sources |
| Derivatization Agents | Highly toxic catalysts | Biocatalysts, milder conditions | Reduced hazard potential |
| Energy Sources | Conventional heating | Microwave, ultrasound, ambient temperature | Reduced energy consumption |
Key Experimental Protocols for Data Collection
Protocol 1: Accurate Waste Calculation
Purpose: Precisely determine total waste generated per analytical procedure.
Methodology:
- List all materials, solvents, and consumables used in a single analysis
- Convert all inputs to mass or volume units
- Subtract the mass of extracted analytes (typically negligible)
- Include all waste streams: liquid, solid, and gaseous if applicable
- Express results as grams or milliliters per single analysis [4]
Protocol 2: Energy Consumption Profiling
Purpose: Measure total energy requirements of analytical equipment.
Methodology:
- Record power ratings (kW) of all instruments used
- Document exact operating times for each instrument (hours)
- Include ancillary equipment (heaters, pumps, chillers)
- Calculate: (Power × Time) / Number of samples per batch
- Express as kWh per sample [7]
Protocol 3: Toxicity Assessment of Reagents
Purpose: Systematically evaluate environmental and safety impacts of all chemicals used.
Methodology:
- Obtain Safety Data Sheets for all reagents
- Document GHS hazard classifications for each substance
- Record acute toxicity data (LD50) when available
- Note persistence and bioaccumulation potential
- Classify as high, medium, or low concern [9]
The Analytical GREEnness (AGREE) metric is a comprehensive tool designed to evaluate the environmental impact of analytical procedures based on the 12 principles of Green Analytical Chemistry (GAC) [7]. Unlike simpler metrics, a key feature of AGREE is its flexibility, allowing users to assign different weights to each of the 12 principles during an assessment [7]. This means you can tailor the evaluation to reflect your specific environmental priorities or the unique constraints of your analytical method. Setting strategic weights is not just a step in the process—it is a critical action to ensure the greenness score provides a meaningful and relevant assessment that aligns with your organization's sustainability goals.
Frequently Asked Questions (FAQs)
1. What are weights in the AGREE calculator? Weights in the AGREE calculator are importance factors you assign to each of the 12 green analytical chemistry principles. You can increase the weight for a principle that is a high priority for your lab (e.g., waste generation) and decrease it for a less critical one. The calculator uses these weights to calculate a final, prioritized greenness score [7].
2. Why should I change the default weights? The default setting treats all principles as equally important. However, in practice, some factors are more critical than others depending on your context. For example, a lab focusing on operator safety might assign a higher weight to principles concerning toxic reagents, while a lab aiming to reduce its carbon footprint might prioritize energy consumption. Adjusting weights ensures the score reflects your strategic goals [7].
3. How do I assign weights strategically? Strategic weight assignment should be a team decision based on your organization's green chemistry policies, specific regulatory concerns, the type of analysis being performed, and the potential for improvement in certain areas. The AGREE software allows you to easily adjust weights, and the output pictogram visually reflects your choices [7].
4. The final score changed after I adjusted the weights. Is this normal? Yes, this is expected. The overall score is a composite result based on the performance of the method in each principle and the importance (weight) you have assigned to each one. A change in weights will change the final score to better reflect your new priorities [7].
5. Can I save different weight profiles for different types of methods? Yes, for a rigorous approach, it is good practice to create and document standardized weight profiles tailored to different categories of analytical methods (e.g., chromatography vs. spectroscopy) or different project phases. This ensures consistent and comparable evaluations across your portfolio.
Troubleshooting Guides
Issue 1: My AGREE score is low, but I'm not sure which principles to prioritize for improvement.
Diagnosis: The AGREE pictogram shows red or yellow segments, but you lack a strategy for improvement.
Solution: Use the following table to diagnose low scores and identify targeted actions. The principles listed are common high-impact areas for chromatographic methods in pharmaceutical development [6].
Table: Troubleshooting Low Scores in Key AGREE Principles
| GAC Principle | Common Causes of Low Score | Corrective Actions |
|---|---|---|
| #1: Direct Analysis | Off-line sample preparation; multiple treatment steps [7]. | Switch to on-line or at-line analysis; automate and combine steps [6]. |
| #2: Sample Size | Using large sample volumes unnecessarily [7]. | Scale down to micro-extraction techniques; use instrumentation with lower volume requirements [6]. |
| #5: Derivatization | Using reagents that are toxic or generate hazardous waste [7]. | Develop a direct analysis method to avoid derivatization; seek safer alternative reagents [6]. |
| #8: Multianalyte Determination | Methods that measure only one analyte per run [7]. | Develop methods to determine multiple analytes simultaneously to reduce runs and solvent use [6]. |
| #9: Energy Consumption | Using energy-inefficient instruments (e.g., old HPLC systems) [6]. | Replace with modern, energy-efficient equipment; switch to techniques like UPLC that have shorter run times [6]. |
Issue 2: The final AGREE score seems counterintuitive after I changed the weights.
Diagnosis: The relationship between individual principle scores, their weights, and the final score is not fully understood.
Solution: The final score is not a simple average. It is a calculation that considers your assigned weights. To better understand the outcome, follow this logical workflow.
Issue 3: I need to justify my weight choices to my team or management.
Diagnosis: The strategic reasoning behind custom weights needs to be documented and communicated.
Solution: Create a brief justification document. Use the following table to structure your reasoning, linking your weight choices to overarching business or research goals.
Table: Framework for Documenting Strategic Weight Choices
| Strategic Goal | High-Priority AGREE Principles | Example Weight Assignment | Business/Research Justification |
|---|---|---|---|
| Operator Safety | 3 (Use of safe reagents), 12 (Operator safety) [7]. | Increase weights for P3 and P12 to 2.0. | To minimize health risks for laboratory personnel and reduce costs associated with handling hazardous materials. |
| Reducing Environmental Footprint | 4 (Minimize waste), 9 (Reduce energy consumption) [7] [6]. | Increase weights for P4 and P9 to 1.5 or 2.0. | To align with corporate sustainability targets and lower the ecological impact of analytical activities. |
| Method Speed & High Throughput | 8 (Multianalyte determination), 10 (Simplify sample prep) [7]. | Increase weights for P8 and P10. | To accelerate drug development timelines and increase laboratory testing capacity. |
Table: Essential Components for an AGREE Evaluation
| Tool or Resource | Function in AGREE Assessment |
|---|---|
| AGREE Free Software | The open-source calculator that transforms input data and weights into a final score and pictogram [7]. |
| The 12 SIGNIFICANCE Principles | The foundational criteria for the assessment; a checklist for evaluating your method's greenness [7]. |
| Solvent Selection Guide | A critical reference for scoring principles related to reagent toxicity, safety, and waste (e.g., P3, P4) [6]. |
| Method Validation Protocol | Ensures that any changes made to improve greenness do not compromise the method's analytical validity [6]. |
| Energy Consumption Data | Information on instrument power use, required for accurately scoring Principle 9 (Energy Consumption) [6]. |
Experimental Protocol: A Step-by-Step Guide to a Strategic AGREE Assessment
Objective: To consistently evaluate the greenness of an analytical method using the AGREE metric, incorporating strategic weight assignments for a relevant and actionable result.
Materials:
- AGREE software (download from https://mostwiedzy.pl/AGREE) [7].
- Detailed procedure of the analytical method to be assessed.
- Data on solvents, reagents, sample amounts, waste, energy use, and instrument type.
Procedure:
- Gather Inputs: Collect all quantitative and qualitative data for your method, mapping each aspect to one of the 12 SIGNIFICANCE principles [7].
- Set Your Strategy: Before inputting data, convene with stakeholders to decide on strategic priorities. Use the Framework for Documenting Strategic Weight Choices (see above) to guide the discussion and record decisions.
- Input Base Data: Enter the objective data about your method into the AGREE calculator for all 12 principles.
- Assign Weights: In the software, adjust the importance slider for each principle according to your pre-defined strategy.
- Calculate and Interpret: Generate the AGREE pictogram. The final score (0-1) in the center provides a quantitative measure. The colored rings provide a qualitative visual of your method's performance across all principles, with the width of each segment indicating the weight you assigned [7].
- Iterate and Improve: Use the output to identify poorly performing principles (red and yellow segments) and consult the Troubleshooting Guide to brainstorm and test modifications to your method. Re-run the assessment to quantify your greenness improvement.
In the pharmaceutical industry, the principles of Green Analytical Chemistry (GAC) are becoming increasingly crucial for developing sustainable and environmentally friendly analytical methods. The Analytical GREEnness (AGREE) metric has emerged as one of the most comprehensive and user-friendly tools for assessing the environmental impact of analytical methodologies, particularly chromatographic methods used in drug development and quality control. This case study explores the practical application of the AGREE assessment tool to evaluate and improve the greenness profile of chromatographic methods within pharmaceutical analysis, providing troubleshooting guidance and frequently asked questions to assist researchers in implementing greener practices.
The AGREE tool stands out from other greenness assessment methods due to its comprehensive coverage of all 12 principles of GAC, abbreviated as SIGNIFICANCE [7]. Unlike earlier metric systems that considered only a few criteria or used binary assessments, AGREE provides both qualitative and quantitative evaluation through an intuitive pictogram score ranging from 0-1, with higher scores indicating greener methods [8]. This comprehensive approach is particularly valuable in pharmaceutical analysis, where methods must balance greenness with rigorous performance requirements for regulatory compliance.
Understanding the AGREE Assessment Tool
The 12 Principles of Green Analytical Chemistry
The AGREE metric is built upon the 12 principles of Green Analytical Chemistry, which provide a comprehensive framework for evaluating the environmental impact of analytical methods. These principles cover the entire analytical procedure, from sample collection and preparation to energy consumption and operator safety [7]. The 12 principles, abbreviated as SIGNIFICANCE, include:
- Direct analytical techniques should be applied to avoid sample treatment
- Minimal sample size and minimal number of samples are goals
- In-situ measurements should be performed
- Integration of analytical processes and operations saves energy and reduces the use of reagents
- Automated and miniaturized methods should be selected
- Derivatization should be avoided
- Generation of a minimal volume of waste and proper management
- Multi-analyte or multi-parameter methods are preferred versus methods using one analyte at a time
- Minimal energy consumption
- Reagents from renewable source should be preferred
- Toxic reagents should be eliminated or replaced
- Safety of the operator should be increased [7]
How the AGREE Calculator Works
The AGREE calculator transforms each of the 12 GAC principles into a score on a unified 0-1 scale, where 1 represents ideal greenness [7]. The tool allows users to assign different weights to each principle based on their relative importance in a specific analytical scenario, providing flexibility to prioritize certain greenness aspects depending on the application [7] [8]. The output is an easily interpretable pictogram that displays the overall score in the center (ranging 0-1) and the performance for each principle in the surrounding segments using a color gradient from red (poor performance) to green (excellent performance) [7].
Table: AGREE Principle Scoring Examples for Sample Preparation
| Sample Pretreatment Activities | AGREE Score |
|---|---|
| Remote sensing without sample damage | 1.00 |
| Noninvasive analysis | 0.90 |
| In-field sampling and direct analysis | 0.85 |
| On-line analysis | 0.70 |
| At-line analysis | 0.60 |
| Off-line analysis | 0.48 |
| External sample pretreatment with multiple steps | 0.00-0.30 |
The AGREE assessment tool is available as open-source software, making it accessible to researchers and analysts throughout the pharmaceutical industry [7]. This accessibility promotes wider adoption of green chemistry principles in analytical method development and provides a standardized approach for comparing the environmental performance of different methodologies.
Troubleshooting Common Chromatography Issues
Chromatographic methods frequently encounter technical challenges that can affect both analytical performance and greenness metrics. This section addresses common issues and provides guidance for resolution while maintaining or improving greenness scores.
Peak Shape Problems
Problem: Peak Tailing Peak tailing compromises quantification accuracy and often indicates issues with secondary interactions between analytes and the stationary phase [21].
- Causes: Secondary interactions with residual polar ionized silanol groups on silica support surfaces (common with basic compounds); column overloading; column contamination; inadequate mobile phase composition [21].
- Solutions:
- Switch to end-capped, highly deactivated columns where silanol groups are masked [21]
- Use mobile phase additives like triethylamine to deactivate silanol groups [21]
- Work at pH <3 for columns that allow it to ensure full protonation of silanol groups [21]
- Reduce sample concentration to prevent column overloading [21]
- Implement gradient elution to improve peak symmetry [21]
Problem: Peak Fronting Peak fronting occurs when asymmetric peaks are broader in the first half than the second half [21].
- Causes: Sample overloading; solvent effect where sample has higher affinity for the injection solvent than the mobile phase [21].
- Solutions:
Baseline and Sensitivity Issues
Problem: Noisy Baseline or Drift Baseline noise or drift interferes with detection and quantification, particularly for low-level analytes [21].
- Causes: Mobile phase contamination; detector instability; system leaks; inconsistent solvent composition; presence of organic modifiers with high cut-off wavelength; dissolved air in mobile phase; dirty flow cell; insufficient mobile phase mixing [21] [22].
- Solutions:
- Use high-purity solvents and filter mobile phase to remove particulates [21]
- Degas mobile phase using sonication or a degassing system [21]
- Regularly calibrate and maintain detector components [21]
- Inspect system for leaks, particularly around seals and connectors [21]
- Lower buffer molarity and organic modifiers percentage if applicable [21]
Problem: Low Sensitivity or Weak Signal Low sensitivity challenges the detection of trace analytes and may necessitate method redevelopment [21].
- Causes: Improper detector settings; column degradation; flow rate issues; system leaks [21].
- Solutions:
System Performance Problems
Problem: Pressure Fluctuations Pressure fluctuations affect flow stability, column performance, and reproducibility [21].
- Causes: Clogged filters; column blockage; system leaks; poor solvent filtration [21].
- Solutions:
Problem: Retention Time Shifts Retention time variations compromise method reproducibility and identification capabilities [22].
- Causes: Faulty pump performance; mobile phase composition changes; temperature fluctuations [22].
- Solutions:
Table: Troubleshooting Guide for Common HPLC Problems
| Problem Symptom | Likely Culprit | Recommended Actions |
|---|---|---|
| Decreasing peak height with same area and retention | Column | Rinse column per manufacturer instructions; replace if needed; add guard column [22] |
| Retention time shifts with same area | Pump | Purge and clean check valves; replace consumables; check for leaks [22] |
| Changing peak area and height | Autosampler | Ensure rinse phase is degassed; prime and purge metering pump [22] |
| Extra peaks in chromatogram | Autosampler or Column | Perform blank injections; adjust needle rinse parameters; ensure all peaks elute [22] |
| Peak splitting | Tubing/Fittings | Check all tubing connections; inspect autosampler rotor for scratches [22] |
Frequently Asked Questions (FAQs)
Q1: How can I quickly improve my method's AGREE score without complete redevelopment? Focus on the high-impact principles: minimize waste generation (Principle 7), increase analysis throughput (Principle 8), replace toxic reagents (Principle 11), and enhance operator safety (Principle 12) [8]. These principles often have the greatest influence on the overall score. For example, switching to less toxic solvents like methanol or acetonitrile instead of tetrahydrofuran (which can form explosive peroxides) improves both safety and waste handling scores [22].
Q2: What are the most common mistakes in analytical procedures that negatively impact greenness scores? Common issues include: using larger sample volumes than necessary; employing multi-step sample preparation instead of direct analysis; using toxic solvents when greener alternatives exist; generating excessive waste through inefficient methods; and failing to implement multi-analyte approaches [7]. Proper method optimization and consideration of green principles during development can address these issues.
Q3: How does miniaturization improve the greenness of chromatographic methods? Miniaturization contributes to multiple AGREE principles: it reduces sample size (Principle 2), decreases reagent consumption (Principle 7), lowers energy requirements (Principle 9), and often enhances operator safety through reduced chemical exposure (Principle 12) [7]. Techniques such as UHPLC and microfluidic chromatography demonstrate these benefits through reduced solvent consumption and waste generation.
Q4: Can I modify a validated method to improve its greenness without requiring complete revalidation? Yes, with proper planning and evaluation. The FDA allows method modifications with appropriate qualification to ensure performance remains acceptable [24]. Changes such as reducing sample volume, switching to less toxic solvents, or optimizing gradient programs to shorten run time can improve greenness while maintaining analytical validity. Any modification should be thoroughly documented and tested for accuracy, specificity, and precision [24].
Q5: How do I handle the trade-off between analytical performance and greenness? The AGREE tool focuses specifically on greenness parameters, while analytical performance (sensitivity, precision, accuracy) is considered a prerequisite [7]. For an analytical procedure to be applicable, it must first be validated with acceptable performance parameters [7]. The optimal approach is to identify method modifications that improve greenness without compromising critical performance criteria, which may require iterative optimization and verification testing.
Q6: What are the key differences between AGREE and other greenness assessment tools? Unlike earlier metrics like NEMI (which uses a binary pictogram with only four criteria) or Eco-Scale (which assigns penalty points), AGREE comprehensively evaluates all 12 GAC principles on a continuous 0-1 scale, provides both numerical and color-coded results, and allows weighting of different principles based on their importance [7] [8]. This comprehensive and flexible approach makes AGREE particularly valuable for comparing complex analytical methods.
Experimental Protocol for AGREE Assessment
Implementing AGREE assessment for chromatographic methods involves a systematic approach to evaluate each of the 12 GAC principles. The following protocol provides a step-by-step methodology for conducting a comprehensive greenness evaluation.
Data Collection Requirements
Before using the AGREE calculator, gather the following method-specific information:
- Sample Preparation: Document all sample treatment steps, including extraction, purification, derivation, and preparation techniques. Note whether methods are direct, on-line, at-line, or off-line [7].
- Sample Size and Throughput: Record sample volumes, number of samples required for analysis, and the number of analytes measured per run [7] [8].
- Instrumentation and Energy: Document instrument type, analysis time, energy consumption per sample, and whether miniaturized or automated systems are used [7].
- Reagents and Solvents: List all chemicals used, their quantities, sources (renewable vs. petrochemical), toxicity classifications, and safety requirements [7] [8].
- Waste Generation: Calculate total waste volume per analysis and identify waste management procedures [7].
AGREE Calculation Procedure
- Download the AGREE software from the official website: https://mostwiedzy.pl/AGREE [7].
- Input baseline data for each of the 12 principles based on your collected method information.
- Assign weighting factors to each principle according to their importance in your specific application. For pharmaceutical analysis, principles 7 (waste), 8 (throughput), 11 (toxicity), and 12 (operator safety) often receive higher weights [8].
- Generate the assessment pictogram and overall score (0-1 scale).
- Interpret results by examining both the overall score and the individual principle scores. Identify principles with the lowest scores as priority areas for improvement.
- Compare alternative methods by repeating the assessment for different methodological approaches to identify greener alternatives.
Case Study: AGREE Assessment of Neurotransmitter Analysis
A recent study applied AGREE assessment to six chromatographic methods for simultaneous analysis of neurotransmitters (serotonin, dopamine, acetylcholine, GABA, and glutamate) [8]. The evaluation with weighted criteria (principles 7, 8, 11, and 12 assigned weight of 4) enabled clear discrimination between methods [8]. The greenest method achieved an AGREE score of 0.66 and offered simultaneous estimation of seven constituents with high sensitivity (detection limits of 2-10 pg) and fast analysis time (5 minutes for all components) [8]. This case demonstrates how AGREE assessment can identify methods that combine excellent greenness profiles with high analytical performance.
AGREE Assessment Workflow
Strategies to Increase AGREE Scores
Method Optimization Techniques
Improving the greenness of chromatographic methods requires a systematic approach targeting the specific principles where current methods underperform. The following strategies have proven effective for increasing AGREE scores in pharmaceutical analysis:
Implement Direct Analysis Techniques: Where possible, utilize direct analysis to avoid sample treatment entirely. Remote sensing, noninvasive analysis, and in-field sampling provide the highest scores for Principle 1 [7]. When sample preparation is necessary, minimize the number of steps and consider on-line versus off-line approaches.
Reduce Sample and Solvent Consumption: Embrace miniaturization strategies to reduce sample sizes and solvent volumes. Micro-extraction techniques, scaled-down chromatography, and reduced injection volumes directly improve scores for Principles 2 and 7 [7]. Modern UHPLC systems with smaller column dimensions (e.g., 2.1 mm ID) significantly reduce mobile phase consumption while maintaining separation efficiency [25].
Replace Toxic Reagents: Systematically evaluate all reagents for greener alternatives. Replace toxic solvents like chloroform or hexane with less hazardous options [7] [8]. When method compatibility allows, prefer methanol over acetonitrile in reversed-phase chromatography, as methanol generally has better environmental and safety profiles [22].
Develop Multi-Analyte Methods: Combine single-analyte methods into comprehensive multi-analyte approaches to improve efficiency and sample throughput (Principle 8) [8]. The ability to measure multiple analytes simultaneously reduces overall resource consumption and analysis time, significantly improving greenness scores.
Optimize Energy Consumption: Reduce analysis time through faster gradients, increased flow rates (where resolution permits), and higher temperature operation [22]. Shorter run times directly reduce energy consumption (Principle 9) while increasing sample throughput (Principle 8).
Technology Integration
Advancements in analytical technology provide significant opportunities for greenness improvement:
Automation and On-line Systems: Implement automated sample preparation and on-line analysis to reduce manual operations, improve reproducibility, and enhance operator safety [7]. Automated systems typically use reagents more efficiently and generate less waste than manual methods.
Alternative Separation Techniques: Evaluate alternative chromatographic methods with inherently greener profiles. Supercritical fluid chromatography (SFC), particularly in its modern UHP-SFC format, often provides superior greenness due to reduced organic solvent consumption [25].
Method Transfer and Modernization: Transfer methods from conventional HPLC to UHPLC systems to leverage the green benefits of smaller particle sizes, higher pressures, and reduced column dimensions [25]. This transition typically reduces solvent consumption by 60-80% while maintaining or improving analytical performance.
Table: Greenness Comparison of Chromatographic Techniques
| Technique | Solvent Consumption | Waste Generation | Energy Demand | Typical AGREE Score Range |
|---|---|---|---|---|
| Conventional HPLC | High | High | Medium | 0.40-0.60 |
| UHPLC | Medium | Medium | Medium | 0.60-0.75 |
| SFC/UHP-SFC | Low | Low | Low-Medium | 0.70-0.85 |
| Capillary LC | Very Low | Very Low | Low | 0.75-0.90 |
Essential Research Reagents and Tools
Successful implementation of green chromatographic methods requires specific reagents, materials, and tools. The following table outlines key solutions for developing methods with improved AGREE scores.
Table: Research Reagent Solutions for Green Chromatography
| Reagent/Tool | Function | Greenness Benefit |
|---|---|---|
| AGREE Calculator Software | Greenness assessment tool | Provides comprehensive evaluation of method environmental impact [7] |
| AMGS Calculator | Alternative greenness metric | Includes solvent impact, energy usage, and waste generation [25] |
| End-capped C18 Columns | Stationary phase for reversed-phase chromatography | Reduces peak tailing, eliminates need for toxic silanol-masking additives [21] |
| Methanol | Mobile phase solvent | Less toxic alternative to acetonitrile with better environmental profile [22] |
| Ethanol/Isopropanol | Mobile phase modifiers | Renewable, less toxic alternatives for normal-phase chromatography [7] |
| Guard Columns | Column protection | Extends analytical column life, reduces waste from column replacement [21] |
| Microfluidic Chips | Miniaturized separation platforms | Dramatically reduces sample and solvent consumption [7] |
| On-line Extraction Cartridges | Automated sample preparation | Reduces manual steps, improves reproducibility, minimizes solvent use [7] |
The AGREE metric provides pharmaceutical analysts with a comprehensive, flexible tool for assessing and improving the environmental profile of chromatographic methods. By systematically addressing the 12 principles of Green Analytical Chemistry, researchers can develop methods that maintain rigorous performance standards while reducing environmental impact, minimizing waste generation, and enhancing operator safety. The troubleshooting guides and FAQs presented in this technical support center offer practical solutions for common chromatography problems while maintaining focus on greenness objectives. As the pharmaceutical industry continues to embrace sustainability goals, the AGREE assessment tool will play an increasingly important role in method development, optimization, and selection processes.
Integrating AGREE with Method Development and Validation Processes
Troubleshooting Guides and FAQs
Frequently Asked Questions
Q1: What are the most critical parameters in the AGREE metric that influence the greenness score? The AGREE metric evaluates 12 principles of green chemistry. The most significant parameters often include energy consumption (Principle 6), use of renewable feedstocks (Principle 7), and waste prevention (Principle 1). Focusing optimization efforts on these high-impact areas typically yields the greatest improvements in your overall score.
Q2: How can I improve the greenness score of my chromatographic method? Consider these strategies: replace acetonitrile with greener alternatives like ethanol or methanol, reduce solvent consumption by optimizing gradient elution, implement temperature-assisted techniques to decrease backpressure, and automate method development to minimize trial runs. Each modification should be validated to ensure analytical performance is maintained.
Q3: My method scores poorly on Principle 12 (accident prevention). What practical steps can I take? Address Principle 12 by: substituting hazardous solvents with safer alternatives, implementing in-line monitoring to reduce manual handling, lowering storage quantities of hazardous materials, and designing closed-system processes to prevent exposure. Document these safety features explicitly in your validation reports.
Q4: How do I handle conflicting outcomes between AGREE and other green assessment tools? It's common for tools to prioritize different principles. When conflicts occur, document the rationale for your choices, use complementary tools like GAPI or HPLC-EAT for a comprehensive view, and prioritize substitutions that address the most significant environmental impacts for your specific process while maintaining analytical validity.
Q5: What is the minimum acceptable color contrast ratio for text in experimental workflow diagrams? For technical diagrams, ensure a minimum contrast ratio of 4.5:1 for normal text and 3:1 for large text (18pt or 14pt bold) between text and background colors [26] [27] [28]. This ensures accessibility for all researchers, including those with low vision or color vision deficiencies [29] [30].
Common Experimental Issues and Solutions
Problem: Inconsistent AGREE scores between similar methods Solution: Standardize your data collection process. Create a checklist for all input parameters (solvent volumes, energy consumption, waste quantities) and use the same software version for all assessments. Verify that system boundaries are consistently defined.
Problem: Green solvent substitution compromises chromatographic performance Solution: Implement a phased validation approach. First, identify the critical method attributes (resolution, peak symmetry). Then systematically test ethanol-water or methanol-water mixtures with small adjustments to pH and temperature. Use computer-assisted method development tools to predict optimal conditions.
Problem: High energy consumption in sample preparation Solution: Evaluate alternative techniques such as room-temperature extraction, ultrasound-assisted extraction, or automated solid-phase microextraction. Calculate energy savings using standardized formulas and document both the environmental benefit and method performance data.
Problem: Difficulty quantifying waste for complex analytical methods Solution: Develop a waste inventory template that accounts for all process outputs: solvents, packaging, consumables, and energy-associated emissions. Use life cycle inventory databases for accurate conversion factors and document assumptions transparently.
AGREE Principle Weighting and Scoring
Table 1: AGREE Metric Principles and Optimization Strategies
| Principle | Description | Max Points | Common Improvement Strategies |
|---|---|---|---|
| 1 | Waste Prevention | 10 | Miniaturization, recovery/reuse systems |
| 2 | Atom Economy | 10 | Alternative derivatization methods |
| 3 | Less Hazardous Synthesis | 10 | Substitute toxic reagents |
| 4 | Designing Safer Chemicals | 10 | Benign stationary phase selection |
| 5 | Safer Solvents/Auxiliaries | 10 | Green solvent databases |
| 6 | Energy Efficiency | 10 | Ambient temperature operations |
| 7 | Renewable Feedstocks | 10 | Bio-derived solvents |
| 8 | Reduce Derivatives | 10 | Direct analysis techniques |
| 9 | Catalysis | 10 | Catalytic sample preparation |
| 10 | Design for Degradation | 10 | Biodegradable solvents |
| 11 | Real-time Analysis | 10 | In-line monitoring |
| 12 | Accident Prevention | 10 | Process automation |
Solvent Environmental Impact Comparison
Table 2: Greenness Assessment of Common HPLC Solvents
| Solvent | AGREE Score | GAPI Score | HPLC-EAT Score | Key Advantages | Key Limitations |
|---|---|---|---|---|---|
| Water | 0.92 | 0.95 | 0.94 | Non-toxic, renewable | High energy for purification |
| Ethanol | 0.88 | 0.89 | 0.87 | Renewable, biodegradable | Higher viscosity |
| Methanol | 0.76 | 0.72 | 0.74 | Versatile application | Toxicity concerns |
| Acetonitrile | 0.45 | 0.48 | 0.42 | Excellent chromatographic properties | High toxicity, petrochemical |
| Tetrahydrofuran | 0.38 | 0.41 | 0.39 | Good solubility | Peroxide formation, toxic |
Experimental Protocols
Protocol 1: AGREE Assessment Implementation
Purpose: Systematically evaluate and improve the greenness of analytical methods using the AGREE metric.
Materials:
- AGREE software or spreadsheet calculator
- Method validation documents
- Solvent consumption records
- Energy monitoring equipment
- Waste inventory logs
Procedure:
- Compile all input data for the 12 principles of green chemistry
- Enter data into AGREE assessment tool
- Generate initial score and identify weak areas
- Develop improvement plan targeting lowest-scoring principles
- Implement modifications and revalidate method performance
- Recalculate AGREE score post-optimization
- Document all changes and their impact on greenness
Validation Parameters:
- Method precision before and after changes
- Accuracy recovery rates
- Resolution of critical peak pairs
- System suitability test results
Protocol 2: Green Solvent Substitution Strategy
Purpose: Replace hazardous solvents with greener alternatives while maintaining analytical performance.
Materials:
- Alternative solvent candidates (ethanol, methanol, ethyl acetate)
- HPLC system with PDA detector
- Reference standards
- Method robustness testing software
Procedure:
- Identify target solvent for replacement
- Select potential alternatives using green solvent selection guides
- Test chromatographic performance with alternatives
- Optimize method parameters to address performance gaps
- Validate the modified method following ICH guidelines
- Calculate environmental impact reduction using AGREE
- Document method transfer parameters
Acceptance Criteria:
- Resolution of critical peak pairs ≥1.5
- Precision RSD ≤2%
- Accuracy within 95-105% recovery
- No significant increase in analysis time
Method Development Workflow
AGREE Scoring System
Research Reagent Solutions
Table 3: Essential Materials for Green Method Development
| Reagent/Category | Function | Green Alternatives | Application Notes |
|---|---|---|---|
| HPLC Solvents | Mobile phase composition | Ethanol, methanol, water | Use solvent selection guides for appropriate substitutions |
| Extraction Solvents | Sample preparation | Ethyl acetate, cyclopentyl methyl ether | Consider temperature-assisted extraction to reduce volume |
| Derivatization Reagents | Analyte modification | Microwave-assisted, catalyst-based | Reduce steps and quantity through optimization |
| Stationary Phases | Separation mechanism | Superficially porous, hybrid | Enable faster separations with reduced solvent consumption |
| Buffers/Salts | Mobile phase modifiers | Ammonium acetate, ammonium bicarbonate | Biodegradable options with MS compatibility |
| Cleaning Solvents | System maintenance | Aqueous-based solutions | Implement recycling systems for solvent recovery |
Score Optimization: Actionable Strategies to Boost Your AGREE Rating
Troubleshooting Guides
FAQ 1: How can I reduce solvent waste in my analytical method to improve its AGREE score?
Problem: My analytical method uses large volumes of hazardous solvents, negatively impacting its AGREE greenness score.
Solution: Several strategies can help reduce solvent consumption and waste.
Quick Fix (5 minutes):
- Shorten Run Times: Reduce chromatographic method run times by optimizing the gradient program. A case study on Rosuvastatin calcium showed that a typical LC method using 0.75 mL/min for 70 minutes consumes 18 L of mobile phase per batch; scaling this to 1000 batches annually results in 18,000 L of waste [6].
- Switch to Greener Solvents: Consult the AGREE metric's solvent selection criteria to replace hazardous solvents like acetonitrile with safer alternatives (e.g., ethanol, methanol) where method performance allows [3] [6].
Standard Resolution (Involves Method Re-development):
- Use Narrow-Bore Columns: Transition from standard 4.6 mm ID columns to narrow-bore (e.g., 2.1 mm ID) columns. This directly reduces mobile phase flow rates and solvent consumption proportionally to the square of the diameter change.
- Implement Automated Method Scouting: Use software and instrument platforms that automatically screen multiple short, generic methods to identify the most effective one, minimizing the number of manual experiments and associated solvent use [6].
Root Cause Fix (Strategic Approach):
- Adopt Direct Analysis Techniques: Explore methods that require minimal to no sample preparation, such as direct injection mass spectrometry or automated sample introduction, which inherently reduce solvent and consumable use [6].
- Apply Life Cycle Assessment (LCA): Formally evaluate the environmental impact of all solvents and reagents from production to disposal, using tools like LCA to make informed, holistic green choices beyond just waste volume [6].
FAQ 2: My method requires extensive sample preparation. What are the most effective strategies to simplify this and minimize steps?
Problem: Complex, multi-step sample preparation is time-consuming, increases error, and lowers my method's AGREE score due to high energy and reagent consumption.
Solution: Focus on integrating automation, reducing steps, and leveraging modern techniques.
Quick Fix (Immediate Actions):
- Evaluate Step Necessity: Critically review each preparation step. Can any steps, like drying, evaporation, or derivatization, be eliminated or combined without affecting data quality?
- Use Disposable Pipette Tips for Extraction: Replace traditional liquid-liquid extraction or solid-phase extraction (SPE) cartridges with simpler, single-use tip-based extraction methods that can be automated.
Standard Resolution (Process Improvement):
- Automate Sample Preparation: Implement robotic liquid handlers or automated SPE systems. Automation not only reduces manual labor but also improves reproducibility and allows for more efficient use of smaller reagent volumes [31].
- Apply In-situ Analysis: Where possible, use techniques that analyze samples in their native state or environment, such as near-infrared (NIR) spectroscopy, to avoid sample treatment entirely.
Root Cause Fix (Methodology Overhaul):
- Adopt a "Direct Analysis" Mindset: Develop methods using advanced instrumentation that can handle complex matrices directly. Examples include:
- Direct Injection LC-MS/MS: For relatively clean samples like biofluids.
- Ambient Mass Spectrometry: Techniques like DESI or DART that require no sample preparation.
- Turbulent Flow Chromatography: Automates online sample cleanup before analysis, drastically reducing manual steps.
- Utilize Experimental Design (DoE): Instead of testing one variable at a time, use DoE to understand the interaction of multiple sample preparation variables (e.g., pH, solvent strength, time) simultaneously. This significantly reduces the total number of experiments needed to optimize a method, saving time, reagents, and energy [32] [33].
FAQ 3: How does instrument energy consumption affect my AGREE score, and how can I reduce it?
Problem: I have not considered the energy footprint of my analytical instruments, which is a key parameter in the AGREE metric.
Solution: Energy consumption is a direct input in the AGREE metric, with lower energy use contributing to a higher score [6].
Quick Fix (Behavioral Changes):
- Power Down Instruments: Develop a lab policy to switch off instruments like HPLCs, spectrometers, and lab computers when not in use, especially overnight and on weekends.
- Use Standby Modes: Utilize energy-saving modes during short idle periods between sample sequences.
Standard Resolution (Strategic Instrument Use):
- Consolidate Analyses: Batch samples to maximize instrument usage time and minimize the number of times an instrument must be started, calibrated, and shut down.
- Choose Efficient Equipment: When purchasing new equipment, factor in energy consumption specifications. Modern instruments often have better energy-saving features.
Root Cause Fix (Method and Technology Shift):
- Develop Faster Methods: A shorter chromatographic run time or a faster analysis cycle directly reduces the energy consumed per sample.
- Explore Low-Energy Techniques: Consider alternative techniques that inherently consume less energy than standard methods (e.g., capillary electrophoresis vs. HPLC). The AGREE metric tool can help quantify this benefit [3] [6].
Experimental Protocols for Key Scenarios
Protocol 1: Developing a Direct Injection LC-MS/MS Method for Biofluid Analysis
Objective: To quantify an analyte in plasma with minimal sample preparation, reducing solvent use and waste.
Materials:
- LC-MS/MS system with a binary pump and autosampler.
- C18 analytical column (e.g., 2.1 x 50 mm, 1.8 µm).
- Methanol, Acetonitrile, Water (HPLC grade), Formic Acid.
- Centrifuge and vortex mixer.
Methodology:
- Sample Dilution: Dilute a small volume of plasma (e.g., 10 µL) with an internal standard solution in a diluent compatible with the mobile phase (e.g., 90 µL of water:acetonitrile 90:10 v/v).
- Protein Precipitation: Vortex mix for 30 seconds and centrifuge at high speed (e.g., 15,000 x g) for 10 minutes.
- Direct Injection: Transfer the supernatant to an autosampler vial and inject 1-5 µL directly into the LC-MS/MS system.
- Chromatography:
- Mobile Phase A: Water with 0.1% Formic Acid.
- Mobile Phase B: Methanol with 0.1% Formic Acid.
- Flow Rate: 0.4 mL/min (optimized for a 2.1 mm ID column).
- Gradient: Rapid gradient from 5% B to 95% B over 2-3 minutes.
- MS Detection: Use Multiple Reaction Monitoring (MRM) for specific and sensitive detection.
AGREE Score Impact: This protocol eliminates lengthy extraction and evaporation steps, significantly reducing organic solvent use, energy consumption, and waste generation, all of which positively impact the AGREE score [6].
Protocol 2: Implementing an Automated Online SPE-LC Method
Objective: To automate sample cleanup and analysis, reducing manual steps and improving reproducibility.
Materials:
- LC system configured with additional pumps and valves for online SPE.
- Online SPE cartridge (e.g., C18, HLB) and analytical column.
- Appropriate solvents for loading, washing, and eluting the SPE cartridge.
Methodology:
- Sample Preparation: Simply dilute the sample (e.g., urine, tissue homogenate) with a compatible buffer and centrifuge.
- Online SPE Process:
- Loading: The autosampler injects the sample supernatant onto the SPE cartridge. Weak solvents (e.g., aqueous buffer) load the analyte onto the cartridge while unretained matrix components are washed to waste.
- Elution & Transfer: A valve switches, and the LC gradient back-flushes the trapped analytes from the SPE cartridge onto the analytical column for separation.
- Analysis: Standard LC separation and detection proceed.
AGREE Score Impact: Automation reduces human error and labor. It often uses smaller total volumes of solvents compared to manual offline SPE and improves overall process efficiency, which is favorable in the AGREE evaluation [31].
Workflow Diagram: Traditional vs. Minimalist Sample Treatment
The diagram below contrasts a traditional multi-step sample preparation workflow with an optimized, minimalist approach, highlighting the reduction in resources and waste.
Research Reagent & Solution Guide for Green Sample Treatment
The following table details key reagents, tools, and methodologies essential for implementing minimized sample treatment protocols.
| Item/Reagent | Function in Minimizing Treatment | Key Consideration for AGREE Score |
|---|---|---|
| Narrow-Bore LC Columns (e.g., 2.1 mm ID) | Reduces mobile phase flow rates and solvent consumption by over 75% compared to standard 4.6 mm columns. | Directly reduces waste generation and the environmental impact of solvent production/disposal [6]. |
| Automated Liquid Handlers | Enables precise, low-volume dispensing for sample dilution and preparation, improving reproducibility while reducing reagent use. | Reduces human error and the consumption of plasticware and reagents. Aligns with principles of safer and more efficient analysis [31]. |
| Green Solvents (e.g., Ethanol, Methanol) | Replaces more hazardous solvents (e.g., acetonitrile) in mobile phases and extraction procedures. | Lower toxicity and safer for operator health and the environment, a core principle of GAC [3] [6]. |
| Direct Injection Probes (e.g., for MS) | Allows introduction of minimally processed samples directly into the detector, eliminating chromatographic separation and its associated solvent use. | Drastically reduces solvent waste and energy consumption. A paradigm shift towards direct analysis [6]. |
| Experimental Design (DoE) Software | A methodological tool that optimizes methods with fewer experiments by testing multiple variables simultaneously. | Reduces the total number of experiments, saving significant amounts of solvents, energy, and time [32] [33]. |
Frequently Asked Questions (FAQs)
1. What are the most impactful first steps to improve the greenness of my analytical method? The most impactful steps are substituting hazardous organic solvents with greener alternatives like ethanol or water, and minimizing overall solvent consumption through method miniaturization or reduced flow rates. These actions directly address key AGREE metric criteria concerning waste, toxicity, and energy consumption [34] [35]. Integrating tools like the CHEM21 Selection Guide during the initial design phase ensures environmental and health factors are considered from the start [35].
2. Which solvents are considered "greenest" according to major selection guides? Solvents like ethanol, water, and certain acetates are frequently recommended. The CHEM21 guide classifies solvents based on safety, health, and environmental impact. For instance, ethanol is often "recommended," while solvents like hexane are "hazardous" due to their environmental toxicity and health risks. These rankings are aligned with the Globally Harmonized System of Classification and Labelling of Chemicals (GHS) [35].
3. How can I effectively reduce solvent waste in my laboratory processes? Adopting a solvent recycling strategy is highly effective. Process design studies show that recycling solvents from extraction and raffinate streams can significantly minimize waste generation, reducing CO2 emissions by up to 86% and production costs by 2% compared to single-use approaches [36]. Furthermore, techniques like Aqueous Two-Phase Systems (ATPS) can eliminate the need for volatile organic solvents entirely in extraction and purification steps [37] [38].
4. Are there digital tools to help with solvent selection and process design? Yes, several data-driven platforms are available. Tools like SolECOs use machine learning to predict optimal single or binary solvents for over 1,000 Active Pharmaceutical Ingredients (APIs) and rank them using Life Cycle Assessment indicators [39]. GreenSOL is an interactive, web-based guide that evaluates 49 common solvents across their full lifecycle [40]. Digital tools for liquid-liquid extraction design can also model pH-dependent extraction efficiency, enabling virtual screening to reduce experimental trial runs [41].
5. What is the role of Quality-by-Design (QbD) in developing greener methods? QbD, particularly through Design of Experiments (DoE), is a powerful enabler of green chemistry. It allows for the systematic optimization of method parameters, which can reduce the number of experiments required for development, thereby conserving resources, time, energy, and solvents. This approach ensures the method is robust and minimizes its environmental footprint from the outset [34].
Troubleshooting Guides
Problem: Poor Extraction Efficiency with a Green Solvent
Symptoms: Low recovery of the target analyte, poor separation from impurities.
| Possible Cause | Diagnostic Steps | Recommended Solution |
|---|---|---|
| Insufficient Solubility | Check Hansen Solubility Parameters or use predictive tools like SolECOs [39]. | Switch to a green solvent with similar polarity to the original, effective solvent, or consider a binary solvent mixture. |
| Incorrect pH | Model the extraction using a digital tool [41] to visualize the fraction of compound extracted across a pH range. | Adjust the pH of the aqueous phase to maximize the concentration of the neutral form of the analyte, facilitating its transfer to the organic phase. |
| Unoptimized Phase Ratio | Perform a simple screening experiment with varying volume ratios of the two phases. | Alter the phase volume ratio (e.g., Vorg/Vaq) to shift the distribution equilibrium and improve recovery. |
Problem: High Solvent Waste Volume
Symptoms: Large quantities of waste solvent generated per sample, high process mass intensity (PMI).
| Possible Cause | Diagnostic Steps | Recommended Solution |
|---|---|---|
| Inefficient Process Design | Perform a system-level analysis of the process, including reaction and extraction solvents [36]. | Optimize solvent combinations for the entire workflow and implement a closed-loop recycling system for waste solvents. |
| Over-sized Chromatography | Review the HPLC method parameters (column dimensions, flow rate). | Scale down to a narrower-bore or shorter column and reduce the flow rate. This can cut solvent consumption by over 80%. |
| Use of Sub-Optimal Solvent | Consult a lifecycle-based guide like GreenSOL [40] to assess the solvent's environmental footprint. | Replace high-impact solvents with biodegradable alternatives like ethanol or 2-methyltetrahydrofuran (2-MeTHF). |
Featured Experimental Protocol: Developing a Greener HPLC Method Using QbD
This protocol outlines the development and validation of an eco-friendly HPLC method for simultaneous drug analysis, integrating Green Analytical Chemistry and Quality-by-Design principles to achieve a high AGREE score [34].
Research Reagent Solutions
| Item | Function/Justification |
|---|---|
| Ethanol (99.8%) | Primary Green Solvent: Used in the mobile phase. It is biodegradable, has low toxicity, and is derived from renewable resources, making it an excellent replacement for acetonitrile or methanol [34]. |
| 0.1% Formic Acid in Water | Aqueous Mobile Phase Component: Provides the necessary pH adjustment (pH ~2.5) to ensure proper analyte ionization and separation without the need for harsh inorganic buffers [34]. |
| Octadecyl Silica (ODS) Column | Stationary Phase: A standard C18 column demonstrates that greener methods can be successfully developed using conventional, widely available equipment [34]. |
| Analytical Greenness Metric (AGREE) Calculator | Assessment Tool: A software tool that evaluates the method against the 12 principles of GAC, providing a quantitative greenness score (0-1) to validate environmental claims [34]. |
Methodology
Step 1: QbD-based Method Scoping
- Define Analytical Target Profile (ATP): Clearly state the method's goal: to simultaneously separate and quantify Nebivolol, Telmisartan, Valsartan, and Amlodipine.
- Identify Critical Method Parameters (CMPs): Using prior knowledge, select factors like mobile phase pH, ethanol-to-water ratio, and column temperature as potential CMPs.
Step 2: Experimental Design (DoE) for Optimization
- Design: Employ a screening design (e.g., Full Factorial or Plackett-Burman) to efficiently study the impact of the CMPs on Critical Quality Attributes (CQAs) such as resolution, peak symmetry, and analysis time.
- Execution: Run the experiments as per the design matrix.
- Analysis & Optimization: Use statistical software to build models and identify the optimal combination of parameters that delivers robust performance within the "design space".
Step 3: Method Validation Thoroughly validate the final optimized method as per ICH guidelines, assessing:
- Linearity: Over specified ranges (e.g., 25–75 μg/mL for Telmisartan). Correlation coefficient (r) should be >0.999.
- Accuracy: Determine via recovery studies (98-100%).
- Precision: Evaluate both intra-day and inter-day precision (%RSD <2%).
- LOD and LOQ: Establish sensitivity, aiming for low μg/mL levels.
Step 4: Greenness Assessment
- Input the final method parameters (solvent type and volume, energy consumption, waste produced, etc.) into the AGREE calculator to obtain a final greenness score [34].
- Use additional tools like the Green Solvent Selection Tool (GSST) to confirm the sustainability choice of ethanol [34].
Workflow Diagram
Frequently Asked Questions
Q1: What is energy optimization in a research context, and why is it important for improving our lab's greenness score? Energy optimization involves using energy strategically to maximize benefits and minimize waste and environmental impact [42]. For a research lab, this means ensuring that the energy consumed by instruments and processes is used as efficiently as possible. This is crucial for improving a greenness score because metrics like GEMAM and AMGS explicitly consider energy consumption as a key factor in evaluating the environmental impact of analytical methods [3] [43]. Reducing energy waste directly contributes to a better score.
Q2: How can I reduce the energy consumption of our computational chemistry workflows, such as binding free energy calculations? You can focus on two main strategies. First, utilize more efficient computational algorithms. For instance, newer path-based methods combined with machine learning can provide accurate binding free energy estimates and are designed for straightforward parallelization, significantly reducing the time-to-solution compared to some traditional methods [44]. Second, ensure you are using appropriate hardware, such as GPUs, for which many modern computational chemistry codes are optimized [44].
Q3: Our lab's HPLC system is a major energy consumer. What are some modern, efficient alternatives? A key transition is moving from traditional High-Performance Liquid Chromatography (HPLC) to more modern techniques like Ultra-High-Performance Liquid Chromatography (UHPLC) and Ultra-High-Performance Supercritical Fluid Chromatography (UHPSFC) [43]. These methods use improved instrumentation and column particle technologies to achieve faster and more efficient separations. This directly reduces run times, solvent volume consumption, and, consequently, the energy required per analysis.
Q4: What are some common signs of energy-inefficient equipment or processes in the lab? Common signs include:
- Instruments with long cycle times or extended run times (e.g., traditional chromatographic methods with longer columns) [43].
- Older equipment that lacks modern energy-saving features or sleep modes.
- Processes that generate significant waste heat, indicating energy loss.
- High baseload energy consumption when equipment is not in active use.
Q5: How does automating workflows contribute to energy optimization? Automation introduces consistency and precise control, which can streamline energy management [42]. Automated systems can trigger threshold-based alerts for inefficient performance, schedule energy-intensive operations for off-peak hours, and remotely power down idle equipment. This reduces unnecessary energy use and the need for energy-inefficient travel to facilities for manual checks [42].
Troubleshooting Guides
Table 1: Troubleshooting Common Instrumentation and Process Issues
| Symptom | Possible Cause | Solution | Greenness Impact |
|---|---|---|---|
| Long analysis times with HPLC | Use of outdated methods with longer columns and extended run times [43]. | Transition to UHPLC methods. Use columns with smaller particle sizes (<2μm) for higher efficiency and faster flow rates [43]. | Reduces solvent and energy use per analysis, improving AGREE/AMGS score. |
| High energy baseload from computational servers | Inefficient allocation of computational resources; running non-optimized simulations. | Implement job scheduling to maximize server utilization. Switch to more efficient algorithms like path-based binding free energy calculations for faster convergence [44]. | Lowers direct energy consumption and associated carbon emissions. |
| Frequent instrument calibration or validation | Use of less stable or inefficient analytical methods requiring frequent checks. | Develop and validate more robust, modernized methods (e.g., UHPLC, SFC) that require fewer repeated analyses [43]. | Reduces consumption of reagents, solvents, and energy over time. |
| Use of hazardous solvents (e.g., hexanes, heptanes) | Reliance on normal-phase liquid chromatography [43]. | Replace normal-phase methods with greener alternatives like Supercritical Fluid Chromatography (SFC), which uses supercritical CO₂ as the primary mobile phase [43]. | Minimizes environmental and safety hazards, a key principle in GAC [3]. |
Table 2: Troubleshooting High Energy Consumption in Computational Drug Design
| Symptom | Possible Cause | Solution |
|---|---|---|
| Slow convergence in binding free energy simulations | Inadequate sampling of the protein-ligand conformational space; inefficient sampling methods [44]. | Employ enhanced sampling techniques, such as metadynamics or bidirectional nonequilibrium simulations, which can be combined with path collective variables to improve sampling efficiency [44]. |
| Low accuracy in affinity predictions | Limitations in force field accuracy or poorly chosen collective variables for path-based methods [44]. | Utilize integrated physics-plus-machine learning platforms [45]. Consider using path collective variables (PCVs) that more accurately represent the binding pathway instead of simple distance metrics [44]. |
Experimental Protocols for Greenness Improvement
Protocol 1: Transitioning from HPLC to a Greener UHPLC Method
This protocol outlines the steps to modernize a chromatographic separation, reducing its environmental impact as measured by metrics like AMGS [43].
1. Initial Method Scoping:
- Analyze the current method: Note the column dimensions, particle size, flow rate, run time, and solvent composition.
- Set goals: Define the required resolution, peak capacity, and the green objectives (e.g., reduce solvent consumption by 50%, reduce run time by 60%).
2. Method Translation and Optimization:
- Column selection: Choose a UHPLC column with a similar stationary phase but smaller particle size (e.g., 1.7-1.9 μm) and narrower diameter (e.g., 2.1 mm ID) compared to the original HPLC column (5 μm, 4.6 mm ID).
- Translate parameters: Use scaling equations to adjust the flow rate and gradient time to maintain linear velocity and the same gradient steepness. Typically, flow rates are reduced to ~0.4-0.6 mL/min for a 2.1 mm column.
- Optimize gradient: Fine-tune the gradient program to achieve separation in a shorter time. A steeper gradient can often be used without sacrificing resolution due to the higher efficiency of UHPLC.
3. Validation:
- Perform a method validation according to ICH guidelines to ensure the new UHPLC method meets all required analytical performance criteria (precision, accuracy, linearity, specificity).
- Document the reductions in solvent use, waste generation, and analysis time.
Protocol 2: Setting Up a Path-Based Absolute Binding Free Energy Calculation
This protocol describes a semiautomatic computational pipeline for estimating standard binding free energies, which is more efficient than some traditional alchemical methods [44].
1. System Preparation:
- Obtain the atomic coordinates of the protein-ligand complex, the unbound protein, and the free ligand in solution.
- Parameterize the ligand using an appropriate force field. Solvate all systems in a water box and add ions to neutralize the charge.
2. Defining the Path and Collective Variables:
- Generate a reference pathway: This is a string of consecutive conformations tracing the ligand's unbinding path from the bound state to the unbound state in solution. This can be done with targeted MD or other path-generation algorithms.
- Set up Path Collective Variables (PCVs): Define the S(X) and Z(X) variables as described in the methodology. S(X) measures progress along the path, and Z(X) measures the deviation from it [44].
3. Enhanced Sampling Simulation:
- Option A (Equilibrium): Use Metadynamics simulations, using the S(X) PCV as the biased variable, to recover the potential of mean force (PMF) along the binding coordinate [44].
- Option B (Non-Equilibrium): Use the PCVs to initiate a series of bidirectional nonequilibrium pulling simulations. The binding free energy is then calculated using an estimator like Jarzynski's equality. This protocol allows for easy parallelization [44].
4. Analysis:
- The PMF from the bound state (S=1) to the unbound state (S=0) provides an estimate of the absolute binding free energy, ΔG_b.
The Scientist's Toolkit: Essential Research Reagents & Materials
Table 3: Key Research Reagent Solutions for Greener Analytical Chemistry
| Item | Function/Description | Greenness Consideration |
|---|---|---|
| UHPLC System | Instrumentation designed for high-pressure operations (>1000 bar), enabling faster separations with smaller particle columns [43]. | Dramatically reduces solvent consumption and analysis time per sample, directly lowering energy use and waste. |
| SFC System | Chromatography system using supercritical CO₂ as the primary mobile phase [43]. | Replaces large volumes of hazardous organic solvents (e.g., heptanes, hexanes) with non-toxic, recyclable CO₂. |
| Solid-Phase Extraction (SPE) Microplates | High-throughput sample preparation format. | Allows for miniaturization and automation of sample cleanup, reducing solvent volumes compared to traditional liquid-liquid extraction. |
| Path Collective Variables (PCVs) | A type of collective variable used in molecular simulations to describe complex transitions like ligand binding [44]. | Enables more efficient and accurate free energy calculations, reducing the computational energy and time required to get a result. |
Workflow and Signaling Pathways
Diagram 1: Green Method Implementation Workflow
Diagram 2: Energy-Optimized Binding Free Energy Calculation
Embracing Miniaturization and Automation for Higher Scores
The Analytical GREEnness (AGREE) metric is a comprehensive tool designed to evaluate the environmental friendliness of analytical methods. It translates the 12 principles of Green Analytical Chemistry (GAC), summarized by the mnemonic SIGNIFICANCE, into a quantifiable score [7] [8]. The output is an intuitive, clock-like pictogram that provides an at-a-glance overview of a method's greenness, featuring a final score between 0 and 1 (where 1 is ideal) and a color-coded performance breakdown for each principle [7] [2]. This tool helps researchers, especially those in drug development, make informed decisions to reduce the environmental footprint of their analytical procedures, which is critical given that the cumulative impact of methods like liquid chromatography can be substantial when scaled across global manufacturing [6].
Troubleshooting Guides
- Problem: My analytical method is receiving a low overall AGREE score (e.g., below 0.5). I don't know where to begin to improve it.
- Investigation: First, closely examine the AGREE pictogram. The color of each segment indicates performance against a specific GAC principle. Identify the segments with the reddest colors (lowest scores) and note their corresponding principle numbers [7] [8].
- Solution: Prioritize improving the principles with the lowest scores. Common culprits include a high number of sample preparation steps (Principle 1), large waste generation (Principle 7), low analysis throughput (Principle 8), high energy consumption (Principle 9), and the use of toxic reagents (Principle 11) [7] [8]. The following guides address these specific areas.
Improving Score for Sample Treatment (Principle 1)
- Problem: My method has a low score in the "Direct Analytical Techniques" segment (Principle 1) due to extensive, multi-step sample preparation.
- Investigation: Audit your current sample preparation workflow. Count the number of discrete steps, such as extraction, filtration, derivatization, and concentration. Each step adds to environmental impact by consuming reagents, time, and energy [7].
- Solution: Embrace automation and miniaturization. Implement on-line sample preparation techniques that integrate directly with the analysis instrument. This eliminates manual handling, reduces reagent consumption, and minimizes the number of procedural steps, directly improving your score for this principle [7] [8]. Explore automated liquid handlers or on-line solid-phase extraction (SPE) to replace manual methods.
Improving Score for Waste & Throughput (Principles 7 & 8)
- Problem: The "Waste" and "Number of Analytes per Run" segments (Principles 7 & 8) are colored yellow or red.
- Investigation: Quantify the total volume of waste generated per analysis and calculate your method's throughput (samples analyzed per hour). AGREE penalizes high waste volumes and low throughput [7] [8].
- Solution: Scaling down your method is key. Miniaturization directly addresses both issues.
- For Waste (Principle 7): Transition to micro-extraction techniques or scale down chromatographic methods to UHPLC or nano-LC, which use significantly lower solvent flow rates [8] [2]. This can reduce waste from tens of mL per sample to less than 1 mL.
- For Throughput (Principle 8): Develop methods that can analyze multiple analytes simultaneously in a single run [8]. Furthermore, automation drastically increases the number of samples that can be processed in a given time, directly boosting your throughput score.
Improving Score for Energy & Toxicity (Principles 9 & 11)
- Problem: The "Energy Consumption" and "Toxicity of Reagents" segments (Principles 9 & 11) show poor performance.
- Investigation: Review the energy demand of your equipment and the safety data sheets (SDS) of all solvents and reagents used.
- Solution:
- For Energy (Principle 9): Automate processes to run outside of peak energy hours and use modern, energy-efficient instruments. Shorter run times, achieved through faster chromatographic methods, also lower energy use per sample [11] [2].
- For Toxicity (Principle 11): Perform a solvent and reagent substitution. Replace toxic solvents (e.g., acetonitrile, methanol) with safer, bio-based alternatives where chromatographically feasible [8] [2]. The AGREE software allows you to model the score improvement from this change before wet-lab experimentation.
Frequently Asked Questions (FAQs)
General Questions
Q1: Where can I find the AGREE calculator?
Q2: My method is analytically valid, but the AGREE score is low. Should I still publish it?
- A2: Analytical validity is mandatory. A greenness assessment provides complementary information about environmental impact and safety. While not always mandatory, it is highly recommended as it demonstrates a broader view of your method's value, especially if it is an alternative to existing methods [11].
Q3: What is the difference between AGREE and other metrics like GAPI or AMGS?
Technical & Implementation Questions
Q4: How are the weights in the AGREE tool used, and how should I set them?
- A4: Weights (on a scale of 1-5) allow you to emphasize the importance of different GAC principles based on your specific laboratory context or priorities. For chromatographic methods, it is common practice to assign higher weights (e.g., 4) to critical principles like waste generation (7), analysis throughput (8), reagent toxicity (11), and operator safety (12) to better discriminate between methods [8].
Q5: Can I use AGREE for non-chromatographic methods?
Q6: My sample requires complex preparation. How can I ever get a good score for Principle 1?
- A6: While direct analysis is ideal, it is not always possible. You can still improve your score by miniaturizing and automating the preparation steps. Using an automated, on-line sample preparation system that is directly coupled to the analyzer is scored more favorably than a manual, multi-step off-line preparation [7].
Experimental Protocols & Workflows
Protocol: Transitioning from HPLC to UHPLC for Higher Scores
This protocol outlines the key steps to modernize a liquid chromatography method, focusing on changes that improve the AGREE score.
- Objective: To reduce solvent consumption, waste generation, and analysis time by migrating an existing HPLC method to UHPLC, thereby improving scores for AGREE Principles 7 (Waste), 8 (Throughput), and 9 (Energy).
Materials:
- UHPLC system capable of withstanding high pressures.
- UHPLC column with sub-2µm particle size.
- Solvent viscosity calculator.
- Appropriate solvents and reagents.
Methodology:
- Column Selection: Choose a UHPLC column with the same stationary phase chemistry as your original HPLC column but packed with smaller (e.g., 1.7-1.9 µm) particles and a shorter length (e.g., 50-100 mm).
- Scaling Calculations: Calculate the scaled method parameters to maintain linear velocity. Key formulas include:
- Flow Rate: ( F{UHPLC} = F{HPLC} \times \left( \frac{d{p,HPLC}}{d{p,UHPLC}} \right)^2 \times \left( \frac{L{UHPLC}}{L{HPLC}} \right) )
- Injection Volume: ( V{inj, UHPLC} = V{inj, HPLC} \times \left( \frac{L{UHPLC}}{L{HPLC}} \right) \times \left( \frac{d{c, UHPLC}}{d{c, HPLC}} \right)^2 )
- Gradient Re-profiling: Scale the HPLC gradient time to the new column dead volume. The gradient time should be scaled proportionally to the column volume change.
- Method Validation: Re-validate the new UHPLC method according to ICH guidelines to ensure analytical performance (precision, accuracy, LOD/LOQ) is maintained or improved.
The impact of this transition on key AGREE parameters is visualized in the following workflow:
Protocol: Implementing an Automated Solid-Phase Extraction (SPE) System
This protocol describes the automation of a manual sample preparation step to enhance greenness.
- Objective: To replace a manual SPE procedure with an automated on-line SPE system, reducing manual labor, solvent use, and improving scores for AGREE Principles 1 (Sample Treatment) and 12 (Operator Safety).
Materials:
- Liquid chromatograph with switching valve capability and a second pump for sample loading/extraction.
- On-line SPE cartridges.
- Standard solutions and samples.
Methodology:
- System Configuration: Configure the LC system with a 6-port/2-position switching valve. Position the SPE cartridge in the external loop.
- Method Programming: Develop a two-step method:
- Step 1 (Load & Clean-up): The sample is loaded onto the SPE cartridge using the loading pump with a weak solvent. Impurities are washed to waste.
- Step 2 (Elute & Analyze): Activate the switching valve. The analytical pump flow elutes the analytes from the SPE cartridge directly onto the analytical column for separation and detection.
- Optimization: Optimize the loading flow rate, wash solvent composition, and elution profile to maximize recovery and minimize carryover.
- Validation: Validate the automated method against the manual procedure for accuracy, precision, and recovery.
The logical progression from manual to automated SPE and its effect on the AGREE assessment is shown below:
Key Reagents & Materials for Greener Analysis
Table: Essential Reagents and Tools for Improving AGREE Scores
| Item | Function in Green Method Development | AGREE Principle Impact |
|---|---|---|
| Bio-based Solvents (e.g., Ethanol, Ethyl Lactate) | Safer, renewable alternatives to traditional toxic solvents like acetonitrile and chlorinated hydrocarbons. | Principle 11 (Toxicity) ↑ [8] |
| UHPLC System | Enables separations with smaller particle sizes, lower flow rates, and shorter run times, reducing solvent and energy use. | Principles 7 (Waste), 9 (Energy) ↑ [2] |
| Automated Liquid Handler | Automates sample preparation and dilution, improving throughput, reproducibility, and reducing analyst exposure. | Principles 1 (Treatment), 8 (Throughput), 12 (Safety) ↑ [7] |
| On-line SPE Cartridges | Integrated cartridges for automated sample clean-up and concentration directly coupled to the LC system. | Principles 1 (Treatment), 7 (Waste) ↑ [2] |
| Micro-extraction Devices (e.g., SPME fibers) | Miniaturized solvent-less or low-solvent techniques for sample preparation. | Principles 1 (Treatment), 7 (Waste) ↑ [2] |
Enhancing Operator Safety and Implementing Green Waste Management
Frequently Asked Questions (FAQs)
Green Chemistry & AGREE Metric
Q1: What is the AGREE metric and why is it important for analytical methods in drug development?
AGREE (Analytical GREEnness) is a comprehensive metric tool that evaluates the environmental impact of analytical methods based on the 12 principles of green analytical chemistry (GAC). It provides both a numerical score (0-1) and a visual radar chart representation across twelve criteria, including energy consumption, solvent toxicity, waste generation, and safety [6] [5]. For pharmaceutical companies like AstraZeneca, which aim for carbon-zero analytical laboratories by 2030, employing AGREE is crucial for systematically reducing the environmental footprint of quality control methods while maintaining regulatory compliance and data quality [6]. Even a single liquid chromatography method, when scaled across global manufacturing, can consume thousands of liters of mobile phase annually, making greenness assessment essential for sustainability goals [6].
Q2: How can I practically improve the AGREE score of my chromatographic method?
Improving your AGREE score involves strategic modifications focused on solvent reduction, reagent substitution, and energy optimization. The table below summarizes key optimization strategies:
Table: Strategies for Improving Method Greenness
| Parameter to Optimize | Action | Expected Impact on AGREE Score |
|---|---|---|
| Solvent Volume | Reduce flow rate, shorten runtime, use narrower-bore columns | Increases score by minimizing waste [6] |
| Solvent Hazard | Replace toxic solvents (e.g., acetonitrile) with safer alternatives (e.g., ethanol) | Increases score by improving safety/toxicity profile [6] |
| Energy Consumption | Use lower column temperatures, modern energy-efficient instruments | Increases score by reducing energy use [6] [5] |
| Sample Preparation | Minimize steps, use smaller samples, automate where possible | Increases score by reducing reagent use and waste [3] |
Q3: What are the common pitfalls when interpreting AGREE results, and how can I avoid them?
A common pitfall is the assumption that all criteria in the AGREE assessment carry equal weight, which can lead to misinterpretation of the overall environmental impact. While the standard AGREE pictogram displays twelve criteria, their relative importance can vary [5]. To avoid this, use the AGREE calculator which allows for the adjustment of weights for each criterion, enabling a more nuanced assessment tailored to your specific environmental priorities [5]. Furthermore, never compromise the analytical method's quality and regulatory compliance for the sake of a higher greenness score, as patient safety remains paramount [6].
Operator Safety & Waste Handling
Q4: What are the critical safety procedures for operators handling pharmaceutical waste solvents?
Operators must adhere to rigorous protocols for segregation, containment, and personal protective equipment (PPE). Hazardous pharmaceutical waste, including certain solvents and pharmaceuticals like warfarin or chemotherapeutic agents, must be segregated from general biohazardous waste, as treatment like autoclaving does not neutralize chemical hazards [48]. Containers must be secure, chemically compatible, and clearly labeled. Staff must receive rigorous training in hazard communication, PPE usage, and emergency response protocols per OSHA standards [49]. A key rule is to never compact suspicious or unknown chemicals, as this can cause explosions or toxic gas release [49].
Q5: How should we manage empty containers that previously held hazardous chemicals?
The management of empty containers is strictly regulated under the EPA's "RCRA empty" standard [48]. For containers that held P-listed hazardous waste (e.g., arsenic trioxide), the container must be triple-rinsed to be considered empty, which is often not feasible. Therefore, such containers typically must be managed as hazardous waste themselves [48]. For U-listed wastes (e.g., many chemotherapeutic agents), a container is "RCRA empty" if no more than 3% by weight of the original contents remains after removing all possible material by normal means. If this criterion is met, it can often be disposed of as trace chemotherapy waste [48].
Q6: What are the essential components of a robust pre-task safety inspection for laboratory and waste handling personnel?
A robust inspection protocol should be systematic and cover personal, environmental, and equipment checks. The following workflow outlines the critical decision points:
Troubleshooting Guides
Issue 1: High Environmental Impact Score in AGREE Metric (Solvent-Related)
Problem: Your analytical method receives a low score in the "Green Solvents" and "Waste" sections of the AGREE metric.
Solution:
- Step 1: Profile Solvent Usage. Calculate the total volume of solvent used per analysis (Flow Rate × Run Time × Analyses per Batch). For example, a method with a 0.75 mL/min flow rate over 70 minutes uses 52.5 mL per injection [6].
- Step 2: Substitute Hazardous Solvents. Refer to the ACS Solvent Selection Guide. Replace high-hazard solvents like hexane or chlorinated solvents with safer alternatives such as ethanol or ethyl acetate [6].
- Step 3: Minimize Volume. If solvent substitution is not viable, reduce the method's flow rate, use narrower-bore columns (e.g., 2.1 mm ID instead of 4.6 mm), or explore gradient elution to shorten run times [6].
- Step 4: Implement Recycling. For methods used in non-GMP settings, investigate on-site solvent recovery or recycling programs to drastically reduce the net volume of virgin solvent purchased and waste generated [50].
Issue 2: Inefficient and Unsafe Segregation of Pharmaceutical Waste
Problem: Cross-contamination of waste streams, leading to increased disposal costs and safety risks.
Solution:
- Step 1: Implement Clear Categorization. Use a tool like the PharmE Waste Wizard to correctly classify waste as hazardous (P- or U-listed), non-hazardous, or biohazardous based on EPA RCRA regulations [48].
- Step 2: Use Color-Coded and Specialized Containers. Deploy a unified system across the lab:
- Step 3: Train Staff Rigorously. Conduct mandatory, annual training on hazard communication, waste segregation protocols, and container-specific use. Use Computer-based Training Programs and Policy Templates for consistency [48].
- Step 4: Audit and Provide Feedback. Regularly audit waste stations and provide immediate feedback to reinforce correct practices.
Issue 3: Operator Exposure to Hazardous Materials During Waste Handling
Problem: Potential for operator exposure to toxic, reactive, or ignitable materials during waste collection and processing.
Solution:
- Step 1: Engineering Controls. Ensure all waste handling is performed within a properly functioning fume hood or ventilated enclosure.
- Step 2: Administrative Controls. Develop and enforce a "Lone Worker" policy for isolated tasks, potentially employing monitoring devices that alert 24/7 services in case of a fall, gas leak, or manual activation [52].
- Step 3: Personal Protective Equipment (PPE). Conduct a task-specific risk assessment to determine required PPE. This may include chemical-resistant gloves (e.g., nitrile), lab coats, safety goggles, and face shields. The "life critical rules" must be enforced with a zero-tolerance policy [52].
- Step 4: Emergency Preparedness. Ensure all operators are trained in emergency procedures, including the location and use of safety showers, eye wash stations, and spill kits. Fire extinguishers must be charged and accessible [49].
The Scientist's Toolkit: Essential Research Reagents & Materials
Table: Key Reagents and Solutions for Green Method Development and Safe Waste Management
| Item Name | Function / Application | Green & Safety Considerations |
|---|---|---|
| Ethanol | A greener substitute for acetonitrile or methanol in reversed-phase chromatography [6]. | Lower toxicity and higher biodegradability. Classified as a Class 3 solvent with low risk by ICH Q3C. |
| Ethyl Acetate | A greener substitute for hexane or dichloromethane in normal-phase chromatography or extraction [6]. | Safer profile compared to chlorinated solvents. Derived from renewable resources. |
| Triple-Rinse Solvent Bottles | For decontaminating empty containers that held U-listed hazardous waste to achieve "RCRA empty" status [48]. | Allows for safe disposal as non-hazardous waste, reducing hazardous waste volume. Must use an appropriate solvent. |
| Chemical-Resistant Gloves (Nitrile) | Protects operators from dermal exposure to hazardous chemicals during waste handling and method preparation [49]. | Essential PPE. Must be compatible with the chemicals being handled. Should be inspected before use. |
| Color-Coded & Labeled Waste Containers | Ensures strict segregation of different waste streams (e.g., hazardous, biohazardous, sharps) [51] [48]. | Critical for compliance and safety. Prevents cross-contamination and reactive incidents. |
| High-Efficiency (e.g., C18) HPLC Columns | Enables method development with shorter run times and lower flow rates, reducing solvent consumption [6]. | Directly reduces solvent waste and energy use, improving the AGREE score for "Waste" and "Energy" criteria. |
Validation and Comparative Analysis: Ensuring Credible Greenness Claims
What are the AGREE and AGREEprep metrics?
AGREE (Analytical GREEnness Metric) and AGREEprep (Analytical Greenness Metric for Sample Preparation) are comprehensive software-based tools designed to evaluate the environmental impact of analytical methods. AGREE provides a holistic assessment of entire analytical procedures based on the 12 principles of green analytical chemistry (GAC), while AGREEprep is specifically optimized for evaluating the sample preparation stage of analytical workflows [20] [5] [53].
Both tools transform multiple assessment criteria into a unified score on a 0-1 scale, where 1 represents ideal greenness. The output includes an intuitive pictogram that displays the final score alongside performance in each criterion, providing an easily interpretable assessment of method sustainability [53].
Table: Overview of AGREE and AGREEprep Tools
| Feature | AGREE | AGREEprep |
|---|---|---|
| Scope | Entire analytical procedure | Sample preparation stage |
| Assessment Basis | 12 principles of GAC | Criteria specific to sample preparation |
| Output Scale | 0-1 | 0-1 |
| Output Format | Circular pictogram with colored segments | Circular pictogram with colored segments |
| Software Availability | Open-source | Open-source |
| Primary Application | General method evaluation | Sample preparation optimization |
Troubleshooting Common Implementation Issues
FAQ 1: Why does my method receive a low overall score despite having excellent performance in some criteria?
This typically occurs due to the comprehensive nature of AGREE assessment. The tool evaluates 12 principles of green analytical chemistry, and weakness in even a few criteria can significantly impact the overall score [53]. The calculator does not average scores but provides a balanced assessment across all principles. To diagnose specific issues:
- Examine the colored segments in your output pictogram - lightly colored segments indicate problem areas
- Prioritize improving criteria with the lowest individual scores
- Note that the overall score is particularly sensitive to hazardous reagent usage, waste generation, and energy consumption [5]
Solution Strategy: Focus on the principles with the lowest scores first. Even significant improvements in one or two areas can substantially increase your overall greenness score.
FAQ 2: How should I handle subjective criteria during assessment?
Some criteria in AGREE, such as "miniaturization" or "degree of automation," require professional judgment [5]. To ensure consistent and reproducible assessments:
- Establish internal scoring guidelines within your organization
- Document the rationale for each subjective assessment
- Use standardized benchmarking against reference methods
- Involve multiple assessors for critical evaluations
Recent studies indicate that the variable interpretation of subjective elements contributes to assessment inconsistencies across users [5].
FAQ 3: What is the proper way to compare methods with different application requirements?
Direct comparison of methods with different analytical targets is challenging. For valid comparisons:
- Normalize scores based on method purpose and requirements
- Use AGREE as a relative improvement tool rather than an absolute benchmark
- Consider implementing custom weighting schemes that reflect your organizational priorities
- Document all weighting modifications for transparency
AGREEprep specifically addresses this through its focused assessment on sample preparation, allowing more valid comparisons of sample treatment approaches [5].
Integration with Complementary Assessment Tools
How do AGREE and AGREEprep fit within the broader White Analytical Chemistry framework?
AGREE and AGREEprep primarily address the "Green" component of the White Analytical Chemistry (WAC) framework, which also includes "Red" (analytical performance) and "Blue" (practicality) dimensions [20] [54]. For comprehensive method evaluation, AGREE should be used alongside complementary tools:
- RAPI (Red Analytical Performance Index): Evaluates analytical performance parameters including sensitivity, precision, and accuracy [20] [5]
- BAGI (Blue Applicability Grade Index): Assesses practical aspects such as cost, time, and operational complexity [20] [5]
- VIGI (Violet Innovation Grade Index): A newer tool that evaluates method innovation across 10 criteria, complementing the RGB metrics [20]
Table: Complementary Assessment Tools for Comprehensive Method Evaluation
| Tool | Focus Dimension | Primary Application | Output Format |
|---|---|---|---|
| RAPI | Red (Analytical Performance) | General method evaluation | Score with colored indicators |
| BAGI | Blue (Practicality) | General method evaluation | Numerical score |
| VIGI | Violet (Innovation) | General method evaluation | 10-pointed star pictogram |
| AMGS | Green (Environmental) | Chromatographic methods | Numerical score |
| GAPI | Green (Environmental) | General method evaluation | Pictogram with pentagrams |
White Analytical Chemistry Assessment Framework
Methodologies for Improving AGREE Scores
Experimental Protocol: Systematic Approach to Enhancing Method Greenness
Step 1: Baseline Assessment
- Conduct initial evaluation using AGREE for the entire method and AGREEprep specifically for sample preparation
- Document all individual criterion scores and overall pictogram
- Identify the three lowest-scoring principles for prioritization
Step 2: Solvent and Reagent Optimization
- Replace hazardous solvents with safer alternatives based on chlorTox scale or similar assessments [5]
- Implement solvent reduction strategies including miniaturization and microextraction techniques
- Explore reagent recycling systems for valuable components
Step 3: Energy and Waste Reduction
- Evaluate alternative techniques with lower energy requirements
- Implement waste stream separation for more effective treatment
- Optimize method parameters to reduce analysis time while maintaining data quality
Step 4: Validation and Reassessment
- Verify that modifications maintain analytical performance (using RAPI or validation protocols)
- Reassess with AGREE/AGREEprep to quantify improvements
- Document the improvement process for knowledge management
Method Greenness Improvement Workflow
Advanced Implementation Strategies
How can we address weighting limitations in AGREE assessments?
While AGREE allows users to adjust weights for different criteria according to their specific needs [5], many users default to standard weighting. For more sophisticated implementations:
- Organizational Weighting Schemes: Develop organization-specific weighting profiles that align with corporate sustainability goals
- Application-Specific Profiles: Create weighting templates for different analytical applications (e.g., regulatory testing vs. research methods)
- Stakeholder-Based Weighting: Involve multiple stakeholders (EHS, operations, R&D) in establishing relevant weightings
What are the best practices for tracking greenness improvements over time?
- Establish Baselines: Document AGREE scores for all standard methods
- Set Improvement Targets: Define specific, measurable targets for greenness improvement
- Implement Trend Analysis: Use software tools to track AGREE scores across method portfolios, as demonstrated in pharmaceutical industry case studies [6]
- Correlate with Operational Data: Link AGREE scores with actual solvent consumption, energy usage, and waste generation data
Research Reagent Solutions for Green Method Development
| Reagent Category | Green Alternatives | Function | AGREE Impact |
|---|---|---|---|
| Organic Solvents | Bio-based solvents, water-based systems, | Extraction, separation, mobile phase | Reduces toxicity, improves safety profile |
| Derivatization Agents | Microwave-assisted derivatization, | Analyte modification for detection | Reduces reaction time and energy |
| Sorbents | Molecularly imprinted polymers, | Extraction and clean-up | Enables miniaturization and reusability |
| Catalysts | Immobilized enzymes, nanocatalysts | Reaction acceleration | Reduces quantity required, enables reuse |
| Additives | Volatile alternatives, | Mobile phase modification | Reduces toxicity and waste impact |
What emerging developments will affect AGREE implementation?
The field of analytical metrics continues to evolve rapidly, with several trends impacting AGREE implementation:
- Integration Platforms: Development of unified platforms that combine multiple assessment tools (AGREE, RAPI, BAGI) is underway [20]
- Digital Dashboards: Interactive interfaces for real-time method evaluation are emerging
- AI-Supported Scoring: Algorithmic approaches to reduce subjectivity in assessments [20]
- Standardization Initiatives: Efforts like the PRISM framework promote consistency across metric tools [5]
Where can I find community resources and support?
- Software Downloads: AGREE calculator is available as open-source software from https://mostwiedzy.pl/AGREE [53]
- Educational Materials: Increasing number of publications include detailed AGREE assessments for reference
- Case Studies: Pharmaceutical industry implementations provide practical examples of large-scale deployment [6]
The progression toward more sustainable analytical practices requires robust assessment tools like AGREE and AGREEprep. By implementing the troubleshooting guides and methodologies outlined in this technical support document, researchers and drug development professionals can systematically enhance their method greenness scores while maintaining analytical quality and practicality.
The analysis of Ultraviolet (UV) filters is crucial for environmental monitoring, consumer product safety, and regulatory compliance. These compounds, widely used in sunscreens and cosmetics, are increasingly detected as emerging contaminants in water systems and atmospheric particulate matter, raising concerns about their ecological and health impacts [55] [56]. Concurrently, the field of analytical chemistry faces a mandate to align with the principles of Green Analytical Chemistry (GAC), which aims to minimize the environmental impact of analytical procedures. This case study operates within the context of a broader thesis exploring strategies to increase the greenness score in AGREE metric research. The AGREE (Analytical GREEnness) metric tool, explicitly structured around the 12 principles of GAC, provides a comprehensive, visual, and quantitative evaluation of an analytical method's environmental footprint [57] [5]. By applying the AGREE metric to various methodologies for UV filter analysis, this study identifies key leverage points for improving sustainability without compromising analytical performance, thereby offering a practical framework for researchers in drug development and environmental science.
Theoretical Background: Green Metric Tools
The AGREE Metric and Its Significance
The AGREE metric is a state-of-the-art tool designed to evaluate the greenness of analytical methods. Its primary strength lies in its foundation on the 12 core principles of GAC. The tool outputs a circular pictogram with twelve sections, each corresponding to one GAC principle, providing an at-a-glance visual assessment. An overall score between 0 and 1 is calculated, facilitating direct comparison between different methods [57] [5]. Key principles addressed include the reduction of reagent and energy consumption, the use of safer solvents, the minimization of waste generation, and the improvement of operator safety. For researchers aiming to enhance the sustainability of their workflows, AGREE offers a scientifically rigorous and holistic framework for method development and optimization.
The Analytical Landscape: AGREE Among Other Metrics
While AGREE is a powerful tool, it is part of a broader ecosystem of green assessment metrics. Understanding its position helps in selecting the right tool for a given assessment:
- Analytical Eco-Scale: Provides a quantitative score but lacks a visual component [57] [6].
- Green Analytical Procedure Index (GAPI): Offers a visual evaluation but does not provide a single, composite score, making direct comparisons challenging [57] [56].
- Analytical Green Star Area (AGSA): A newer, comprehensive, and visually intuitive tool that includes built-in scoring and is designed to be resistant to user bias [57].
- White Analytical Chemistry (WAC): This concept expands beyond greenness, advocating for a balance between analytical quality (red), practical/economic aspects (blue), and ecological footprint (green). A method that harmonizes these three pillars is considered "white" [56]. Tools like the RGB 12 algorithm and the Blue Applicability Grade Index (BAGI) are used for WAC assessments [56].
- AGREEprep: A specialized metric derived from AGREE, tailored specifically for evaluating the sample preparation stage against the 10 principles of Green Sample Preparation (GSP) [56] [5].
For a focused assessment of a method's alignment with GAC principles, AGREE remains a top-tier choice due to its explicit structure, visual output, and quantitative scoring.
Case Study: AGREE Assessment of Sample Preparation Methods for UV Filters in Water
This case study evaluates ten different sample preparation methods for determining UV filters in water samples prior to analysis by Gas Chromatography–Mass Spectrometry (GC-MS) [56]. The assessment uses a multi-metric approach, including AGREEprep (for sample preparation greenness), BAGI (for practicality), and the RGB 12 algorithm (for a white assessment). The evaluated methods range from classical techniques to modern microextraction approaches, including:
- Classical Methods: Solid-Phase Extraction (SPE), Liquid-Liquid Extraction (LLE), and QuEChERS.
- Microextraction Techniques: Dispersive Liquid-Liquid Microextraction (DLLME), Solid-Phase Microextraction (SPME), Stir Bar Sorptive Extraction (SBSE), and Single-Drop Microextraction (SDME).
The following table synthesizes the quantitative results from the multi-metric assessment of the most prominent methods, highlighting their performance across green, practical, and analytical dimensions.
Table 1: Comparative Greenness and Practicality Scores of Sample Preparation Methods for UV Filter Analysis [56]
| Sample Preparation Method | AGREEprep Score (Greenness) | BAGI Score (Practicality) | Key Strengths | Key Weaknesses |
|---|---|---|---|---|
| Dispersive Liquid-Liquid Microextraction (DLLME) | 0.64 | ~8 | High greenness, fast, low solvent consumption | Requires a disperser solvent |
| Solid-Phase Microextraction (SPME) | 0.62 | ~7 | Solvent-free, integrable with automation | Fiber cost, fragility, potential carryover |
| Stir Bar Sorptive Extraction (SBSE) | 0.60 | ~6 | High sensitivity, solvent-free | Longer extraction time, higher cost of bars |
| Single-Drop Microextraction (SDME) | 0.58 | ~5 | Extremely low solvent use, simple setup | Drop instability, not high-throughput |
| Solid-Phase Extraction (SPE) | 0.45 | ~8 | Well-established, high throughput | High solvent consumption, generates significant waste |
| Liquid-Liquid Extraction (LLE) | 0.42 | ~7 | Simple, no specialized equipment | Highest solvent consumption and waste generation |
Detailed Experimental Protocols
Protocol 1: Ultrasounds-Assisted Dispersive Liquid-Liquid Microextraction (USA-DLLME) This method is highlighted for its favorable greenness and practicality profile [56].
- Sample Collection: Collect 10 mL of the environmental water sample in a glass centrifuge tube.
- Extraction: Rapidly inject a mixture containing 1.0 mL of acetone (disperser solvent) and 150 µL of chloroform (extraction solvent) into the sample using a syringe.
- Sonication: Place the tube in an ultrasonic bath for 1 minute. A cloudy solution forms, indicating the dispersion of fine extraction solvent droplets throughout the sample.
- Centrifugation: Centrifuge the mixture at 4000 rpm for 5 minutes to sediment the extraction solvent at the bottom of the tube.
- Analysis: Carefully remove the aqueous layer with a pipette. Withdraw a defined volume of the sedimented organic phase (typically ~50 µL) using a microsyringe and transfer it to a vial for GC-MS analysis.
Protocol 2: Solid-Phase Microextraction (SPME) A solvent-free alternative praised for its green credentials [56].
- Fiber Conditioning: Condition the SPME fiber according to the manufacturer's instructions in the GC injection port.
- Sample Preparation: Place a 15 mL water sample in a sealed headspace vial with a magnetic stirrer.
- Extraction: Immerse the SPME fiber into the sample or expose it to the headspace above the sample. Stir for 30 minutes at a constant speed to allow the UV filters to partition into the fiber coating.
- Desorption: Retract the fiber and immediately introduce it into the hot GC injection port for 5 minutes to desorb the analytes onto the chromatographic column.
The Scientist's Toolkit: Research Reagent Solutions
Selecting the right materials is fundamental to developing an efficient and green analytical method.
Table 2: Essential Reagents and Materials for UV Filter Analysis
| Item | Function/Application | Greenness & Practical Considerations |
|---|---|---|
| Microextraction Solvents (e.g., Chloroform, 1-Octanol) | Used in tiny volumes (µL) as extraction solvents in DLLME and SDME. | Minimizes hazardous waste and reagent consumption. Prioritize less toxic solvents where possible. |
| SPME Fibers (e.g., PDMS, PA, DVB) | Solvent-free extraction; coating type dictates selectivity and sensitivity. | Eliminates solvent use but requires careful handling and has a finite lifetime, impacting cost and waste. |
| Stir Bars for SBSE (PDMS coating) | Provides a larger extraction phase volume than SPME for higher sensitivity. | Solvent-free; but is more expensive and has a longer extraction time. |
| Green Solvents for Dilution (e.g., Ethanol, Water) | Used for sample reconstitution or as a less toxic alternative to acetonitrile or methanol in mobile phases. | Reduces environmental and safety hazards. Using ethanol-water mixtures in HPLC can significantly improve greenness scores. |
Troubleshooting Guides & FAQs for AGREE-Driven Method Development
This section directly addresses common challenges researchers face when developing or adapting methods to improve their AGREE score.
Troubleshooting Guide: Improving Your AGREE Score
Problem Statement: Our current method for UV filter analysis (using traditional SPE or LLE) has a low AGREE score. How can we systematically improve it? Symptoms: High solvent consumption, large waste generation, high energy use, and use of hazardous reagents.
Table 3: Troubleshooting Guide for Low AGREE Scores
| Step | Action | Expected Outcome & AGREE Principle Addressed |
|---|---|---|
| 1. Identify Weaknesses | Input your current method parameters (solvent types, volumes, energy, waste) into the AGREE calculator. | A visual pictogram highlights the red sections (e.g., Principle #5: Toxicity of Reagents; Principle #8: Waste Generation). |
| 2. Prioritize Solvent Replacement | Replace hazardous solvents (e.g., acetonitrile, chloroform) with safer alternatives (e.g., ethanol, water) where chromatographically feasible. | Directly improves scores for reagent toxicity, operator safety, and waste hazard. [6] |
| 3. Miniaturize Sample Preparation | Switch from LLE/SPE to a microextraction technique like DLLME or SPME (see Protocols in Section 3.3). | Drastically reduces solvent use (to µL levels) and waste generation, boosting multiple AGREE principles. [56] |
| 4. Optimize Instrumentation | Shorten chromatographic run times, use micro-flow LC systems, and implement instrument sleep modes. | Reduces energy consumption (Principle #9) and mobile phase waste. [6] |
| 5. Automate and Integrate | Implement online or automated sample preparation (e.g., online-SPE). | Reduces manual handling, improves safety, and can enhance throughput while minimizing errors. |
Frequently Asked Questions (FAQs)
Q1: We need high sensitivity for trace-level UV filters in environmental water. Won't switching to a greener microextraction method compromise our detection limits? A1: Not necessarily. Many microextraction techniques are designed for high enrichment factors. For instance, SBSE offers excellent sensitivity due to a larger volume of extraction phase compared to SPME. The key is to optimize the extraction conditions (time, pH, salting-out effect) to ensure the green method also meets your analytical performance requirements (the "red" pillar of WAC) [56].
Q2: Our lab is cost-constrained. Is investing in SPME or SBSE equipment truly justified? A2: While the initial investment is higher, the long-term savings from drastically reduced solvent purchase and waste disposal costs can be significant. Furthermore, the avoidance of hazardous solvents reduces lab safety costs and personal protective equipment needs. A cost-benefit analysis over a year is recommended to evaluate the return on investment, considering both economic and environmental benefits.
Q3: How can we objectively compare two methods that have similar AGREE scores? A3: The AGREE score is an excellent starting point, but for a full "white" assessment, you should supplement it with tools that evaluate other dimensions. Use the Blue Applicability Grade Index (BAGI) to assess practicality (cost, time, operational simplicity) and ensure your method validation parameters (accuracy, precision, LOD/LOQ) meet requirements (the "red" aspect). A method is optimal when it scores high in all three areas [56] [5].
Q4: The AGREEprep score for our method is low due to a long sample preparation time. What is the best way to address this? A4: Long preparation times negatively impact energy use and throughput. To improve this, investigate techniques that allow for parallel sample processing or automation. For example, using a multi-syringe setup for DLLME or an autosampler capable of performing SPME can significantly reduce hands-on time and increase efficiency, thereby improving the greenness score related to energy consumption and operator time.
Workflow Visualization: Pathways to a Greener Analytical Method
The following diagram synthesizes the core strategies discussed in this study into a logical workflow for developing a method with a high AGREE score.
This comparative case study demonstrates that significant improvements in the greenness profile of analytical methods for UV filters are not only possible but also practical. The transition from classical, resource-intensive techniques like LLE and SPE to modern microextraction methodologies such as DLLME and SPME represents the most impactful strategy for elevating the AGREE score. This transition directly addresses critical GAC principles by minimizing solvent consumption, reducing hazardous waste, and enhancing operator safety. By integrating the AGREE metric as a core component of the method development workflow—supported by the detailed protocols, troubleshooting guides, and strategic visualizations provided—researchers and drug development professionals can systematically engineer more sustainable analytical practices. This approach successfully balances the imperative of scientific rigor with the equally important goal of environmental responsibility, contributing directly to the broader thesis of advancing greenness in analytical chemistry.
Frequently Asked Questions (FAQs) on AGREE Metric Implementation
Q1: What is the AGREE metric, and why is it important for tracking greenness over time? The Analytical GREEnness (AGREE) metric is a comprehensive, software-based tool designed to evaluate the environmental impact of analytical methods. It assesses methods against all 12 principles of green analytical chemistry (GAC), providing a score on a 0-1 scale and a visual pictogram for easy interpretation [7] [2]. It is crucial for trend analysis because it offers a standardized, quantitative basis for comparing the greenness of different methods or tracking the improvement of a single method after re-optimization. This allows researchers and organizations to measure progress toward sustainability goals objectively [6].
Q2: I've obtained an initial AGREE score for my method. How can I use this to plan improvements? The AGREE pictogram is diagnostic. Each of its 12 segments corresponds to a GAC principle, color-coded to show performance (green=good, red=poor) [7]. To plan improvements, identify the red and yellow segments in your initial assessment. These represent the least green aspects of your procedure. For instance, if segment 7 (waste) is red, your improvement strategy should focus on waste reduction, perhaps through miniaturization or solvent recycling. This targeted approach ensures efficient use of resources to maximize your score gain [8].
Q3: What are the most impactful changes I can make to improve my AGREE score? Based on case studies, the most impactful changes often involve:
- Miniaturization and Automation: Reducing sample size and automating sample preparation directly improves scores for principles 1 (direct analysis), 2 (minimal sample size), and 5 (miniaturization) [7] [2].
- Solvent Management: Replacing hazardous solvents with safer, bio-based alternatives and reducing total solvent volume significantly enhances scores for principles 11 (toxicity), 7 (waste), and 12 (operator safety) [6] [8].
- Increasing Throughput: Developing methods that analyze multiple analytes simultaneously improves the score for principle 8 (analysis throughput) [8].
- Energy Efficiency: Using instruments with lower energy consumption or optimizing methods for shorter run times benefits principle 9 (energy consumption) [6].
Q4: My method requires specific, sometimes hazardous, reagents for analytical performance. Can I still achieve a good AGREE score? Yes. The AGREE tool allows for flexible weighting of its 12 criteria [7]. If certain principles are less critical for your analytical goal, you can assign them a lower weight. However, the tool encourages a holistic view. You can compensate for a lower score in one area by excelling in others, such as implementing top-tier waste reduction, energy efficiency, and automation. The goal is to make the entire method as green as possible without compromising the quality of the analytical results [20].
Troubleshooting Common AGREE Implementation Challenges
Problem: Inconsistent scores when comparing methods from different years.
- Cause: The AGREE software or its underlying criteria may have been updated, or different users may have applied different weightings to the 12 principles.
- Solution: For a valid longitudinal study, recalculate all historical AGREE scores using the same version of the tool and an identical weighting scheme. Document the weighting choices (e.g., giving higher weight to waste and toxicity [8]) in your standard operating procedure (SOP) to ensure future consistency.
Problem: Lack of published data for a full AGREE assessment of a literature method.
- Cause: Many scientific publications omit fine details required for a precise AGREE score, such as exact energy consumption, sample preparation steps, or waste disposal methods.
- Solution: Make reasonable assumptions based on standard laboratory practices and clearly state these assumptions in your report. For example, you might assume a standard energy consumption for a type of instrument if it is not specified. This allows for a comparative assessment while highlighting the need for more transparent reporting in the scientific literature [4].
Problem: Difficulty translating a low AGREE sub-score into a practical improvement.
- Cause: The AGREE pictogram highlights a problem area (e.g., principle 9: energy) but does not prescribe a solution.
- Solution: Consult a green chemistry alternatives guide. For high energy consumption, consider switching to a technique with lower power requirements, reducing analysis time, or using a more energy-efficient instrument. The key is to use the low sub-score as a starting point for targeted research into greener technical alternatives [6] [2].
Quantitative Data and Benchmarking Tables
The following table summarizes core AGREE metrics and their benchmarks for tracking improvements. These examples are derived from chromatographic method case studies [8].
Table 1: Key AGREE Metrics and Benchmarks for Chromatographic Methods
| Metric | Description | Poor Performance (Red) | Good Performance (Green) | Impact on Overall Score |
|---|---|---|---|---|
| Solvent Volume per Run | Total volume of mobile phase and sample diluent used. | > 10 mL per sample [2] | < 1 mL per sample (e.g., microscale) | High [8] |
| Analysis Throughput | Number of analytes measured per unit time. | Single analyte, long run time | Multiple (5-7) analytes simultaneously in short run (< 5 min) [8] | High [8] |
| Hazardous Reagent Use | Presence of toxic, corrosive, or flammable solvents. | Use of solvents with multiple GHS hazard pictograms [2] | Use of water, ethanol, or other safe solvents | High [8] |
| Sample Preparation Steps | Number of manual off-line steps before analysis. | Multi-step, external pre-treatment [7] | Direct analysis, on-line, or in-field | Medium-High [7] |
| Energy Consumption | Instrument power requirement per analysis. | High-energy equipment (e.g., some MS systems) | Low-energy equipment or short run times | Medium [6] |
To effectively track trends, establish an internal scoring log. The table below provides a template.
Table 2: Method Greenness Improvement Tracking Log
| Method ID / Version | Assessment Date | AGREE Overall Score | Key Weaknesses (from Pictogram) | Implemented Improvements | Post-Improvement AGREE Score |
|---|---|---|---|---|---|
| MTHD-A_v1.0 | Jan 2025 | 0.48 | High waste (P7), Toxic reagents (P11), Low throughput (P8) | - | Baseline |
| MTHD-A_v1.1 | Apr 2025 | 0.66 | Low throughput (P8), Moderate energy (P9) | - Replaced acetonitrile with a safer alcohol/water mix - Reduced injection volume | 0.66 [8] |
| MTHD-A_v1.2 | Jul 2025 | Target: 0.75 | - | - Scaled down to UHPLC - Developed for 7 analytes | Projected |
Experimental Protocols for Enhancing AGREE Scores
Protocol 1: Systematic Solvent Replacement for Improved Toxicity and Waste Scores
This protocol outlines a methodology for replacing hazardous solvents with greener alternatives, directly addressing principles 11 (toxicity) and 7 (waste).
- Audit: List all solvents and reagents used in your current method, noting their volume and safety/hazard classifications (e.g., from GHS or SDS).
- Consult Green Solvent Selection Guides: Use resources like the ACS Solvent Selection Guide to identify less hazardous alternatives for each solvent [6].
- Design Scaled Experiments: Systematically test the green alternatives. A suggested workflow for a chromatographic method is shown in the diagram below.
- Validate Performance: After identifying a promising alternative, fully validate the new method to ensure analytical figures of merit (precision, accuracy, sensitivity) are maintained [58].
- Re-calculate AGREE Score: Input the new parameters (less toxic solvent, potentially reduced volume) into the AGREE calculator to quantify the improvement.
The following workflow diagram visualizes the experimental process for solvent replacement.
Solvent Replacement Workflow
Protocol 2: Method Miniaturization and Throughput Enhancement
This protocol focuses on reducing scale and increasing multiplexing to improve scores for principles 2 (minimal sample size), 5 (miniaturization), and 8 (throughput).
- Feasibility Study: Investigate if your analytical technique can be scaled down (e.g., transitioning from HPLC to UHPLC, reducing column diameter, or employing micro-extraction techniques) [2].
- Parameter Optimization: Use experimental design (e.g., Design of Experiments, DoE) to optimize the scaled-down method for critical parameters like flow rate, injection volume, and gradient profile. The goal is to maintain detection sensitivity while reducing run time and solvent consumption [58].
- Multiplexing Development: Explore if the method can be adapted to analyze multiple analytes simultaneously without interference. In chromatography, this may involve refining the separation, while in spectroscopy, it could involve developing chemometric models for mixture analysis [8].
- AGREE Re-assessment: Input the new data (reduced sample volume, solvent consumption, and increased number of analytes per run) into the AGREE tool. Case studies show that methods analyzing 7 analytes in under 5 minutes can achieve scores of 0.66 and higher [8].
The Scientist's Toolkit: Essential Reagents and Tools for Green Method Development
Table 3: Research Reagent Solutions for Improving AGREE Metrics
| Item / Tool | Function in Green Method Development | Relevant AGREE Principles |
|---|---|---|
| AGREE Calculator Software | The primary tool for calculating the greenness score. It is open-source and freely available online. [7] [8] | All 12 Principles |
| Green Solvent Guide (e.g., ACS GCI) | A reference for identifying and selecting safer, bio-based, or less hazardous solvent alternatives. [6] | 11 (Toxicity), 12 (Safety) |
| UHPLC or Micro-Scale Chromatography Systems | Instrumentation that operates at higher pressures with smaller particle columns, enabling reduced solvent consumption and faster run times. | 2 (Sample Size), 7 (Waste), 9 (Energy) |
| Experimental Design (DoE) Software | Software to plan efficient experiments for method optimization, reducing the number of trials needed and saving resources. [58] | 4 (Number of Steps) |
| Waste Management Log | A dedicated log for tracking the type and volume of waste generated per analysis, which is critical data for AGREE assessment. | 7 (Waste) |
| Automated Sample Preparation Systems | Equipment that minimizes manual handling, reduces human error, and can often operate with smaller reagent volumes. | 1 (Directness), 5 (Miniaturization), 12 (Safety) |
The AGREE (Analytical GREEnness) metric is a comprehensive tool for evaluating the environmental impact of analytical procedures based on the 12 principles of Green Analytical Chemistry (GAC). As its adoption grows across pharmaceutical development and other research fields, ensuring assessment reproducibility has become critical. Inconsistencies in interpretation, data collection, and scoring can undermine the tool's value for comparing methods and driving meaningful sustainability improvements. This technical support center provides targeted guidance to help researchers minimize subjectivity and perform reliable, reproducible AGREE evaluations.
Core Concepts: Understanding AGREE and Reproducibility
What is the AGREE metric and what does it assess?
The Analytical GREEnness (AGREE) metric is a comprehensive assessment tool that evaluates analytical procedures against the 12 principles of Green Analytical Chemistry [7]. Unlike earlier metric systems that considered only a few assessment criteria, AGREE transforms each of the 12 GAC principles into a score on a unified 0-1 scale, providing both a final composite score and detailed performance information across all criteria [7]. The output is an intuitive clock-like pictogram where the overall score appears in the center, and performance on each principle is reflected with a red-yellow-green color scale [7].
Why does reproducibility matter in greenness assessments?
Reproducibility ensures that different researchers assessing the same analytical method arrive at consistent greenness scores, enabling valid comparisons and tracking improvements over time. Recent research highlights that assessment reproducibility is a significant concern with greenness metrics, as unintentional abuses and inconsistent application can lead to misleading conclusions [9]. From a metrology perspective, reproducibility represents "precision in measurements under conditions that may involve different locations, operators, measuring systems, and replicate measurements on the same or similar objects" [59]. High reproducibility indicates that the assessment method itself introduces minimal uncertainty.
Troubleshooting Guides
Problem: Inconsistent Scores Between Different Assessors
Issue: Different team members evaluating the same analytical method obtain significantly different AGREE scores.
Solution:
- Develop Standardized Operating Procedures (SOPs): Create detailed documentation defining how to interpret and score each of the 12 AGREE criteria, including specific examples and boundary cases [9].
- Implement Cross-Training: Conduct collaborative assessment sessions where team members independently score the same method, then discuss discrepancies to align understanding.
- Utilize the Weighting Feature Consistently: AGREE allows users to assign different weights to criteria based on their importance in a given scenario [7]. Document weighting rationales for different types of analyses to ensure consistency across assessments.
- Establish Reference Methods: Maintain a library of well-documented analytical methods with agreed-upon AGREE scores to serve as calibration standards for new assessors.
Problem: Handling Missing or Ambiguous Method Data
Issue: Critical information needed for AGREE assessment (e.g., exact energy consumption, waste disposal methods) is not reported in the method documentation.
Solution:
- Create Data Estimation Guidelines: Develop standardized approaches for estimating missing parameters based on equipment specifications or analogous methods, clearly documenting all assumptions [4].
- Implement Tiered Scoring: Establish a tiered approach where methods with complete data receive "verified" scores, while those with estimated parameters receive "preliminary" scores with noted uncertainties.
- Contact Original Method Developers: When possible, reach out to method authors for clarification on missing parameters to improve assessment accuracy.
- Document All Data Sources: Clearly record whether assessment data came from original publications, manufacturer specifications, or estimations.
Problem: Managing Subjectivity in Multi-Criteria Assessments
Issue: Certain AGREE principles require subjective judgment (e.g., operator safety, method simplicity), leading to inconsistent scoring.
Solution:
- Create Decision Trees: Develop flowcharts or decision trees for ambiguous criteria to standardize scoring approaches [60].
- Implement Multi-Assessor Review: For critical assessments, require independent scoring by multiple trained assessors with discussion to resolve significant discrepancies.
- Reference Safety Data Sheets: Use standardized hazard classifications from safety data sheets rather than personal judgment for safety-related criteria [9].
- Leverage Automated Tools: Use the official AGREE open-source software to minimize calculation errors and ensure consistent application of scoring algorithms [7].
Frequently Asked Questions (FAQs)
How can we reduce variability when assessing sample preparation steps?
Sample preparation is often the most resource-intensive part of analytical procedures and a significant source of assessment variability. Use AGREEprep, a dedicated metric tool specifically designed for evaluating the environmental impact of sample preparation methods [4]. AGREEprep provides a standardized framework based on ten principles of green sample preparation, with detailed guidance on calculating waste generation and energy requirements [4]. For complex sample preparation involving novel materials, clearly distinguish between the greenness of the analytical procedure itself and the environmental impact of material synthesis, which typically falls under the broader domain of green chemistry [9].
What is the role of weighting factors in AGREE reproducibility?
Weighting factors allow customization of AGREE assessments to reflect organizational priorities or specific analytical contexts, but they introduce a potential source of variability if applied inconsistently [7]. To maintain reproducibility while using this feature:
- Document weighting rationales for different assessment scenarios
- Establish organization-wide weighting profiles for common analysis types
- Include weighting information when reporting AGREE scores to provide context for comparisons
- Consider using equal weights as a default for general method comparisons unless specific priorities justify customization
How do newer metrics like AGREE compare to older tools like NEMI or Eco-Scale in terms of reproducibility?
Earlier tools like NEMI (National Environmental Methods Index) and Analytical Eco-Scale offered simplicity but limited granularity, which inherently constrained their reproducibility potential [2]. NEMI used binary assessments (green/uncolored) for just four criteria [7], while Eco-Scale relied on penalty points subtracted from a base score of 100 [6]. AGREE provides a more comprehensive framework with twelve specific principles and continuous scoring from 0-1, offering greater precision but requiring more careful implementation to maintain reproducibility [7]. The key advantage of AGREE is its transparent structure that makes scoring criteria explicit rather than implicit.
Can software tools improve assessment reproducibility?
Yes, dedicated software tools significantly enhance reproducibility by standardizing calculations and providing consistent interfaces. The official AGREE software is open-source and available online, ensuring all users apply the same computational approach [7]. Similarly, AGREEprep offers user-friendly software that standardizes assessment of sample preparation methods [4]. Pharmaceutical companies like AstraZeneca have developed internal tools that trend data as a mode of continuous process verification, further enhancing consistency across organizational assessments [6].
Experimental Protocols for Reproducible Assessments
Standardized AGREE Assessment Methodology
Purpose: To provide a systematic approach for performing reproducible AGREE evaluations of analytical methods.
Materials:
- Official AGREE software (downloadable from https://mostwiedzy.pl/AGREE)
- Complete method documentation including reagents, equipment, and procedures
- Safety Data Sheets for all chemicals used
- Equipment energy specifications
- Standardized data collection template
Procedure:
- Data Collection: Gather complete methodological details including sample size, reagent types and quantities, equipment energy requirements, number of procedural steps, and waste management approaches [7].
- Software Input: Enter data into the AGREE software, ensuring all 12 principles are addressed with specific, quantified inputs where possible.
- Weighting Assignment: Apply standardized weighting factors based on assessment purpose and organizational guidelines.
- Score Calculation: Generate the AGREE pictogram and numerical score using the software.
- Documentation: Record all input data, assumptions, weighting factors, and final scores in the standardized reporting template.
- Peer Review: Submit completed assessment for independent verification by a second trained assessor.
Method Comparison Protocol
Purpose: To reproducibly compare the greenness of multiple analytical methods for the same application.
Procedure:
- Define Comparison Scope: Clearly establish the analytical problem and validation requirements that all methods must meet.
- Standardize Assessment Conditions: Apply identical weighting factors and data collection approaches across all methods being compared.
- Perform Individual Assessments: Conduct AGREE evaluations for each method using the standardized methodology above.
- Comparative Analysis: Tabulate results focusing on key differentiators across the methods.
- Sensitivity Analysis: Test how sensitive conclusions are to variations in weighting factors or data assumptions.
Table 1: AGREE Assessment Criteria and Data Requirements
| AGREE Principle | Key Data Requirements | Common Sources of Variability |
|---|---|---|
| Directness of analysis | Number of preparation steps, analysis type (remote, in-field, online, at-line, off-line) | Classification of analysis type, counting of procedural steps |
| Sample size and number | Sample volume/mass, number of samples required | Distinction between minimal possible vs. typically used sample sizes |
| Reagent toxicity | Safety Data Sheet classifications, quantities used | Interpretation of hazard statements, accounting for metabolite toxicity |
| Waste generation | Waste volume, composition, disposal methods | Estimation of laboratory cleaning solvents, treatment of recyclable materials |
| Energy consumption | Equipment power requirements, run times | Inclusion of auxiliary equipment, standby power consumption |
Research Reagent Solutions for Greenness Assessment
Table 2: Essential Tools for Reproducible AGREE Assessments
| Tool Name | Function | Role in Reducing Subjectivity |
|---|---|---|
| AGREE Software | Calculates scores and generates pictograms | Standardizes calculations and visualization [7] |
| Safety Data Sheets | Provides chemical hazard information | Replaces subjective judgment with standardized hazard classifications [9] |
| AGREEprep Tool | Specialized assessment of sample preparation | Provides dedicated framework for variable-intensive process step [4] |
| Electronic Lab Notebooks | Documents assessment parameters and assumptions | Ensures traceability of all scoring decisions |
| Equipment Monitors | Measures actual energy consumption | Replaces estimates with empirical data [6] |
Assessment Workflow and Troubleshooting Diagrams
Achieving reproducible AGREE assessments requires systematic approaches to data collection, standardized interpretation of criteria, and consistent application of weighting factors. By implementing the troubleshooting guides, standardized protocols, and verification processes outlined in this technical support center, research organizations can significantly reduce subjectivity in greenness evaluations. This enhances the reliability of sustainability comparisons between analytical methods and strengthens the overall value of green chemistry principles in pharmaceutical development and analytical science. As the field evolves, continued refinement of assessment standards and integration of automated tools will further support reproducible, meaningful greenness evaluations.
FAQs and Troubleshooting Guides
Frequently Asked Questions (FAQs)
Q1: What is the AGREE metric, and how does it differ from other green chemistry assessment tools? The AGREE (Analytical GREEnness) metric is a comprehensive, open-source software tool for assessing the environmental impact of analytical procedures. Unlike earlier tools like NEMI (binary pictogram) or the Analytical Eco-Scale (penalty points), AGREE evaluates methods based on all 12 principles of Green Analytical Chemistry (GAC). It provides a unified score between 0 and 1 and a clock-like pictogram for easy interpretation, offering a more sensitive and informative assessment [7] [2].
Q2: Why is my analytical method receiving a low overall AGREE score? Low scores typically originate from specific, high-impact areas. Common culprits include:
- High energy consumption from non-miniaturized equipment or lengthy procedures.
- Large waste generation without treatment protocols [2].
- Use of hazardous or toxic reagents instead of safer, bio-based alternatives [2].
- Low sample throughput and a high number of manual sample preparation steps [7] [2]. Check the colors in your AGREE pictogram; red or yellow segments will pinpoint the specific GAC principles where your method underperforms [7].
Q3: How can I improve the "Sample Treatment" score (Principle 1) in AGREE? Principle 1 penalizes extensive off-line sample preparation. To improve this score:
- Shift to direct analysis techniques where possible to avoid sample treatment entirely [7].
- Implement in-field or on-line analysis to integrate sampling and analysis, reducing steps [7].
- Automate and miniaturize sample preparation (e.g., using microextraction techniques) to reduce solvent use, waste, and manual handling [4] [2].
Q4: My method uses a "green" solvent, but the "Reagents" score is still low. Why? The AGREE assessment considers more than just the origin of a solvent. The score for reagent use (addressed under multiple GAC principles) is also influenced by:
- Toxicity and Hazard: The inherent hazardousness of all reagents used, including those for sample preparation [2].
- Quantity: The total volume or mass consumed per sample. Even a green solvent used in large volumes will lower your score [7].
- Renewability and Degradability: The environmental fate of the reagents. Prioritize reagents that are biodegradable and derived from renewable sources [2].
Q5: How does AGREEprep relate to the main AGREE metric? AGREEprep is a complementary, dedicated metric for evaluating the greenness of the sample preparation stage, often the least green part of an analytical workflow. It is based on the 10 principles of Green Sample Preparation. For a holistic view, you should use AGREEprep to optimize your sample prep and the main AGREE metric to evaluate your entire method from sample to result [4] [2].
Troubleshooting Common AGREE Calculation and Application Issues
Issue 1: Inconsistent AGREE Scores When Comparing Similar Methods
- Problem: Different research groups assign different AGREE scores to comparable methods.
- Solution: Ensure consistent and transparent data reporting. The AGREE score is highly sensitive to input data that is often omitted from publications, such as exact energy consumption (kWh per sample), detailed waste management protocols, and precise reagent volumes. Establish and report a standardized set of experimental parameters for your lab, as shown in the table below.
Issue 2: Difficulty in Quantifying Energy Consumption and Waste for AGREE Input
- Problem: Lack of direct measurements for energy use (Principle 6) and complex calculation of total waste (Principle 3).
- Solution:
- Energy: For instrumentation, use the formula:
Energy (kWh) = (Instrument Power in kW) × (Analysis Time in hours). A power meter can provide accurate measurements. For heating/cooling steps, include the energy required by ovens, block heaters, or refrigerators [4]. - Waste: Sum all waste streams, including unused samples, extraction phases, cleaning solvents, and used columns. The AGREEprep tutorial provides detailed guidance on these calculations. The table below summarizes key metrics to track.
- Energy: For instrumentation, use the formula:
Essential Quantitative Data for Robust AGREE Assessment Table 1: Key Parameters to Document for Accurate AGREE Scoring
| Parameter Category | Specific Data to Record | Relevant AGREE Principle(s) |
|---|---|---|
| Sample & Reagents | Sample volume/mass; Type, volume, and hazard profile of all reagents and solvents | 2, 4, 5 |
| Energy | Power rating of all instruments; Total runtime for each step; Standby energy consumption | 6 |
| Waste | Volume and mass of all waste generated; Toxicity and treatment method for waste streams | 3 |
| Throughput & Steps | Number of samples processed per hour; Number of procedural steps (e.g., extraction, dilution, derivatization) | 1, 8 |
Issue 3: Integrating AGREE with Other Metrics for a Holistic View (The Whiteness Concept)
- Problem: An excellent green (AGREE) score might come at the cost of poor analytical performance (e.g., low sensitivity).
- Solution: Adopt a "White Analytical Chemistry" (WAC) framework. WAC balances the green (environmental impact, measured by AGREE), red (analytical performance), and blue (practicality and cost-effectiveness) aspects of a method. Use AGREE in conjunction with other metrics to ensure your method is not only green but also analytically sound and practically feasible [19] [2].
Experimental Protocols for Method Assessment and Validation
Protocol 1: Standardized Procedure for AGREE Score Calculation
Objective: To ensure a consistent, repeatable, and transparent process for calculating the AGREE metric for any analytical procedure.
Materials:
- Analytical procedure to be assessed.
- AGREE software (freely downloadable from https://mostwiedzy.pl/AGREE).
- Complete data on reagents, energy, waste, and workflow (refer to Table 1).
Methodology:
- Data Compilation: Gather all quantitative and qualitative data for the 12 GAC principles. This is the most critical step.
- Software Input: Launch the AGREE software. For each of the 12 input fields corresponding to the GAC principles, enter the collected data.
- Weight Assignment: Assign importance weights (from 0 to 1) to each principle. If all are equally important, use a default of 1. For a method focused on operator safety, you might assign a higher weight to principles concerning hazardous reagents.
- Score Generation: The software will automatically generate the overall score (0-1) and the colored pictogram.
- Interpretation: Analyze the pictogram. Identify segments with red (poor performance) or yellow (moderate performance) colors. These areas represent the primary opportunities for greenness improvement in your method [7].
Protocol 2: Experimental Workflow for AGREE Score Validation Against Environmental Impact
Objective: To empirically correlate improvements in the AGREE score with reductions in concrete environmental impact metrics.
Materials:
- An analytical method (e.g., based on a case study like SULLME for antivirals) [2].
- Standard laboratory equipment (balances, glassware).
- Power meter for energy measurement.
- Waste collection containers.
- AGREE and complementary metric software (e.g., AGREEprep, CaFRI).
Methodology:
- Baseline Assessment:
- Run the unoptimized analytical method for a set number of samples (e.g., n=10).
- During this run, meticulously measure and record: total energy consumed (kWh), total waste mass (g) and volume (mL), and exact reagent volumes used.
- Calculate the baseline AGREE score using Protocol 1.
- Method Optimization:
- Target the weak points identified in the baseline AGREE pictogram. Example optimizations include:
- Post-Optimization Assessment:
- Run the optimized method for the same number of samples (n=10).
- Repeat the measurements of energy, waste, and reagents.
- Calculate the new AGREE score.
- Correlation Analysis:
- Compare the baseline and optimized data. A successful optimization will show a higher AGREE score concurrent with a measurable decrease in kWh/sample, waste/sample, and reagent toxicity/volume. This validates the AGREE score as a predictor of environmental impact reduction.
Workflow Visualization: The following diagram illustrates the experimental workflow for validating AGREE score improvements.
The Scientist's Toolkit: Research Reagent and Material Solutions
Table 2: Essential Materials for Developing Greener Analytical Methods
| Item / Solution | Function / Relevance to AGREE |
|---|---|
| Bio-based Solvents (e.g., Cyrene, Ethyl Lactate) | Safer, renewable alternatives to toxic traditional solvents (e.g., acetonitrile, chlorinated solvents). Directly improves scores for reagent safety and waste toxicity [2]. |
| Microextraction Devices (e.g., SPME fibers, MEPS pipette tips) | Enable miniaturization of sample preparation, drastically reducing solvent consumption (to < 1 mL) and waste generation. Improves scores for sample size, waste, and energy [4] [2]. |
| Automated Liquid Handlers / Flow Analysis Systems | Reduce manual steps, improve throughput, and enhance reagent dispensing precision. Addresses principles related to automation, throughput, and direct analysis [7] [2]. |
| Power Meter | Essential for obtaining accurate energy consumption data (kWh) from instruments, which is a critical but often estimated input for AGREE Principle 6 [4]. |
| AGREE & AGREEprep Software | The open-source calculators that transform experimental data into the greenness score and pictogram. The primary tool for quantitative assessment and decision-making [7] [4]. |
Conclusion
Mastering the AGREE metric provides a powerful pathway for researchers and drug development professionals to systematically enhance the environmental sustainability of their analytical methods. By understanding its foundational principles, implementing practical application strategies, focusing on key optimization areas like solvent reduction and miniaturization, and validating results through comparative analysis, laboratories can significantly improve their greenness scores. As the pharmaceutical industry moves toward ambitious sustainability goals, including carbon-zero analytical laboratories, the strategic use of AGREE will be crucial for developing analytical methods that are not only scientifically robust but also environmentally responsible. Future directions should focus on integrating AGREE with lifecycle assessment data, developing standardized weighting protocols, and expanding its application to emerging analytical technologies to further advance green analytical chemistry in biomedical research.
References
- 1. The 12 principles of green analytical chemistry and ... [https://www.sciencedirect.com/science/article/abs/pii/S0165993613001234]
- 2. Assessing the Environmental Impact of Analytical Methods [https://www.chromatographyonline.com/view/the-green-component-assessing-the-environmental-impact-of-analytical-methods]
- 3. Greenness evaluation metric for analytical methods and ... [https://www.sciencedirect.com/science/article/pii/S209517792500019X]
- 4. A Tutorial on AGREEprep an Analytical Greenness Metric ... [https://www.sciencedirect.com/science/article/pii/S2772582022000225]
- 5. A Perspective on Current and Future Metric Tools - PMC [https://pmc.ncbi.nlm.nih.gov/articles/PMC12590457/]
- 6. Utilisation of Analytical Method Greenness Score to drive ... [https://pubs.rsc.org/pt-br/content/articlehtml/2025/gc/d5gc01574j]
- 7. AGREE—Analytical GREEnness Metric Approach and ... [https://pmc.ncbi.nlm.nih.gov/articles/PMC7588019/]
- 8. Evaluation of Greenness of LC-MS Chromatographic ... [https://www.mdpi.com/2297-8739/9/6/147]
- 9. Guidelines on the proper selection of greenness and ... [https://www.sciencedirect.com/science/article/abs/pii/S0003267025004465]
- 10. Green analytical chemistry metrics for evaluating the ... [https://pmc.ncbi.nlm.nih.gov/articles/PMC11697060/]
- 11. How to correctly evaluate greenness, whiteness and other ... [https://pubs.rsc.org/en/content/articlehtml/2025/gc/d5gc00615e]
- 12. Troubleshooting Guide Examples: Best Practices for Creating [https://blog.deepconverse.com/troubleshooting-guide-examples/]
- 13. Weighted Scoring Model: Step-by-Step Implementation ... [https://productschool.com/blog/product-fundamentals/weighted-scoring-model]
- 14. A Comprehensive Guide to Using a Weighted Decision ... [https://www.launchnotes.com/blog/a-comprehensive-guide-to-using-a-weighted-decision-matrix-for-prioritization]
- 15. Green analytical chemistry metrics for evaluating the ... [https://www.sciencedirect.com/science/article/pii/S2095177924001102]
- 16. Comparative study of four greenness assessment tools for ... [https://pubs.rsc.org/en/content/articlelanding/2021/ay/d0ay02169e]
- 17. Greenness assessment of analytical methods for ... [https://pubmed.ncbi.nlm.nih.gov/39161240/]
- 18. Greenness assessment and comparison of the developed ... [https://www.sciencedirect.com/science/article/pii/S0026265X24013237]
- 19. Green metrics and green analytical applications [https://www.sciencedirect.com/science/article/pii/S2772577424000685]
- 20. Emerging Tools for Holistic Evaluation of Analytical Methods [https://www.chromatographyonline.com/view/emerging-tools-for-holistic-evaluation-of-analytical-methods]
- 21. Advanced Guide to HPLC Troubleshooting: Solve common ... [https://pharmacores.com/advanced-guide-to-hplc-troubleshooting/]
- 22. Diagnosing Chromatography Problems & Troubleshooting [https://www.ssi.shimadzu.com/service-support/faq/liquid-chromatography/knowledge-base/diagnosing-chromatography-problems-troubleshooting/index.html]
- 23. Drug Analysis Pitfalls: Navigating Common Errors in ... [https://www.linkedin.com/pulse/drug-analysis-pitfalls-navigating-common-errors-pharma-rohan-jindal-9q6rc]
- 24. Troubleshooting & FAQs [https://www.cygnustechnologies.com/resources/faqs/?srsltid=AfmBOooH9onaUlww98FvXM6SCtayGV3JNnSTA98-xOI43NaoJPGUIG0k]
- 25. Analytical Method Greenness Score (AMGS) Calculator [https://chemistryforsustainability.org/tools-metrics/analytical-method-greenness-score-amgs-calculator]
- 26. Text has minimum contrast[proposed] | ACT Rule | WAI [https://www.w3.org/WAI/standards-guidelines/act/rules/afw4f7/proposed/]
- 27. Understanding Success Criterion 1.4.3: Contrast (Minimum) [https://www.w3.org/WAI/WCAG21/Understanding/contrast-minimum.html]
- 28. Contrast Checker [https://webaim.org/resources/contrastchecker/]
- 29. All text elements must have sufficient contrast between ... [https://dequeuniversity.com/rules/axe/4.0/color-contrast-enhanced]
- 30. Understanding WCAG 2 Contrast and Color Requirements [https://webaim.org/articles/contrast/]
- 31. Strategies to reduce drug development time [https://alhena-consult.com/strategies-to-reduce-drug-development-time/]
- 32. Study/Experimental/Research Design: Much More Than ... [https://pmc.ncbi.nlm.nih.gov/articles/PMC2808761/]
- 33. Experimental Design [https://thedecisionlab.com/reference-guide/statistics/experimental-design]
- 34. Evaluation of analytical greenness metric for an eco-friendly method developed through the integration of green chemistry and quality-by-design for the simultaneous determination of Nebivolol hydrochloride, Telmisartan, Valsartan, and Amlodipine besylate - PMC [https://pmc.ncbi.nlm.nih.gov/articles/PMC11365310/]
- 35. Solvent Selection from the Green Perspective [https://www.chromatographyonline.com/view/solvent-selection-from-the-green-perspective]
- 36. Conceptual process design-based solvent selection [https://www.sciencedirect.com/science/article/abs/pii/S0959652625023078]
- 37. Aqueous two-phase system (ATPS): from basic science to ... [https://pmc.ncbi.nlm.nih.gov/articles/PMC11934030/]
- 38. Aqueous two-phase system (ATPS): an overview and ... [https://biologicalproceduresonline.biomedcentral.com/articles/10.1186/s12575-016-0048-8]
- 39. SolECOs : a data-driven platform for sustainable and ... [https://pubs.rsc.org/en/content/articlehtml/2025/gc/d5gc04176g]
- 40. GreenSOL: Green Solvent Guide for Analytical Chemistry ... [https://www.sciencedirect.com/science/article/pii/S0165993625003991]
- 41. A digital tool for liquid–liquid extraction process design [https://pubs.rsc.org/en/content/articlehtml/2025/dd/d5dd00104h]
- 42. 8 Essential Energy Optimization Tips [https://galooli.com/blog/essential-energy-optimization-tips/]
- 43. Making the move towards modernized greener separations [https://pubs.rsc.org/en/content/articlelanding/2019/gc/c8gc03875a]
- 44. On Free Energy Calculations in Drug Discovery - PMC [https://pmc.ncbi.nlm.nih.gov/articles/PMC12548091/]
- 45. Leading AI-Driven Drug Discovery Platforms [https://www.sciencedirect.com/science/article/abs/pii/S0031699725075118]
- 46. AGREEAnalytical GREEnness Metric Approach and ... [https://acs.figshare.com/collections/AGREE_Analytical_GREEnness_Metric_Approach_and_Software/5045160]
- 47. A green chemistry approach to establish a conductometric ... [https://japsonline.com/abstract.php?article_id=3976&sts=2]
- 48. FAQs [https://www.pharmecology.com/Home/FAQs]
- 49. Essential Waste Training Guide for Fleet Operators - HVI App [https://heavyvehicleinspection.com/safety/osha/training/waste-training-operators-guide]
- 50. Waste and Recycling [https://www.pfizer.com/about/responsibility/green-journey/waste-and-recycling]
- 51. Medical & Pharma Waste Disposal FAQ [https://www.gicmd.com/faq]
- 52. Safety [https://sustainability.wm.com/esg-hub/social/safety/]
- 53. AGREEAnalytical GREEnness Metric Approach and ... [https://figshare.com/articles/journal_contribution/AGREE_Analytical_GREEnness_Metric_Approach_and_Software/12588771?backTo=/collections/AGREE_Analytical_GREEnness_Metric_Approach_and_Software/5045160]
- 54. White Analytical Chemistry: An approach to reconcile ... [https://www.sciencedirect.com/science/article/pii/S0165993621000455]
- 55. Concentrations, profiles, and risk assessment of organic ... [https://www.sciencedirect.com/science/article/abs/pii/S1352231025001852]
- 56. A Comprehensive Assessment of Sample Preparation ... [https://www.mdpi.com/2076-3417/14/17/7690]
- 57. Analytical Green Star Area (AGSA) as a new tool to assess ... [https://www.sciencedirect.com/science/article/pii/S2352554125001494]
- 58. A case study of a multipurpose novel janus kinase inhibitor [https://www.sciencedirect.com/science/article/pii/S2772577425000072]
- 59. Reproducibility in Science: A Metrology Perspective [https://hdsr.mitpress.mit.edu/pub/0r4v4k4z]
- 60. Removing Subjectivity from the Assessment of Critical ... [https://www.pharmtech.com/view/removing-subjectivity-assessment-critical-process-parameters-and-their-impact-0]