SIGNIFICANCE Mnemonic: A Practical Guide to the 12 Principles of Green Analytical Chemistry for Pharmaceutical Professionals
This article provides a comprehensive exploration of the SIGNIFICANCE mnemonic and its corresponding 12 principles of Green Analytical Chemistry (GAC), tailored for researchers and drug development professionals.
SIGNIFICANCE Mnemonic: A Practical Guide to the 12 Principles of Green Analytical Chemistry for Pharmaceutical Professionals
Abstract
This article provides a comprehensive exploration of the SIGNIFICANCE mnemonic and its corresponding 12 principles of Green Analytical Chemistry (GAC), tailored for researchers and drug development professionals. It establishes the foundational framework of GAC, moving into methodological applications for greening sample preparation and analysis. The guide addresses common troubleshooting challenges and introduces optimization strategies for balancing sustainability with analytical performance. Finally, it details the validation of green methods using modern metrics like AGREE, GAPI, and NEMI, and positions GAC within the broader context of White Analytical Chemistry and global sustainability goals, offering a complete roadmap for implementing sustainable practices in pharmaceutical analysis.
Foundations of Green Analytical Chemistry: Understanding the SIGNIFICANCE Mnemonic and Core Principles
Analytical chemistry plays a crucial role in determining the composition and quantity of matter, yet its traditional practices raise significant environmental concerns due to reliance on energy-intensive processes, non-renewable resources, and substantial waste generation [1]. The pharmaceutical industry exemplifies this challenge, with carbon emissions estimated to be up to 55% higher than the automotive sector and E-Factor values (ratio of waste to product) ranging from 25 to over 100 [2]. This translates to over 100 kilograms of waste generated for every kilogram of active pharmaceutical ingredient (API) produced. Green Analytical Chemistry (GAC) has emerged as a transformative discipline that addresses these issues by integrating the principles of green chemistry into analytical methodologies [3]. GAC represents a fundamental shift from managing pollution after its creation to preventing it at the molecular level, optimizing analytical processes to ensure they are safe, nontoxic, environmentally friendly, and efficient in their use of materials, energy, and waste generation [4]. This whitepaper provides a comprehensive technical guide to GAC principles, metrics, and methodologies, framing them within the SIGNIFICANCE mnemonic and exploring their critical role in advancing sustainable science, particularly for researchers, scientists, and drug development professionals.
Foundational Principles: The SIGNIFICANCE Mnemonic of GAC
The 12 principles of Green Analytical Chemistry provide a comprehensive framework for designing and implementing environmentally benign analytical techniques [5] [3]. These principles can be remembered through the mnemonic SIGNIFICANCE, which serves as an essential guide for laboratories aiming to implement sustainable practices [5] [6]:
- Select direct analytical techniques that avoid sample preparation
- Integrate analytical processes and operations for streamlined workflows
- Generate as little waste as possible and properly manage any produced
- No derivatization; avoid chemical reactions for analysis when possible
- Incorporate automation and miniaturization to enhance efficiency
- Fast responses through method optimization for reduced analysis time
- Increase safety for the operator through reduced toxicity
- Choose multi-analyte methods to maximize information per analysis
- Avoid excessive energy consumption through energy-efficient equipment
- No additional sample processing; implement direct measurements
- Consume minimal sample volumes through miniaturized approaches
- Eliminate toxic reagents or replace them with safer alternatives
These principles emphasize waste prevention, atom economy, less hazardous chemical syntheses, and designing safer chemicals while prioritizing energy efficiency and real-time analysis for pollution prevention [3] [2]. The foundational philosophy is proactive prevention rather than retrospective treatment of waste and hazards [2].
Quantitative Assessment: GAC Metrics and Evaluation Tools
Proper GAC tools are essential for objectively assessing the greenness of analytical methods, with multiple metrics developed to quantify environmental performance [7].
Table 1: Key Metrics for Assessing Greenness in Analytical Chemistry
| Metric Name | Evaluation Approach | Key Parameters Assessed | Output Format |
|---|---|---|---|
| NEMI (National Environmental Methods Index) | Pictogram with four quadrants | PBT chemicals, hazardous waste, corrosivity, waste amount | Simple pass/fail pictogram |
| Analytical Eco-Scale | Penalty point system | Reagent toxicity, waste, energy consumption | Numerical score (100 = ideal) |
| GAPI (Green Analytical Procedure Index) | Color-coded pictogram | Entire method lifecycle from reagent to waste | Multi-colored pictogram |
| AGREE (Analytical GREEnness) | Software-based calculation | All 12 GAC principles simultaneously | Circular pictogram with score |
| ComplexGAPI | Advanced GAPI extension | Holistic assessment of complex procedures | Detailed multi-stage pictogram |
The Analytical Eco-Scale assigns a total score of 100 points for an ideal green analysis, with penalty points subtracted based on amounts of solvents/reagents, energy consumption, hazards, and waste produced [7]. To be considered an "ideal green analysis," a method must use solvents/reagents with no health, environmental, or physical hazards; consume less than 0.1 kWh per sample; and produce no waste [7]. The AGREE metric provides a comprehensive evaluation using all 12 GAC principles, generating a score from 0-1 where 1 represents perfect greenness [4]. Good Evaluation Practice (GEP) recommends using quantitative indicators based on empirical data alongside assessment models to ensure comprehensive and reliable evaluations [8]. Key empirical indicators include the amount of electricity required for specific analysis counts (measured with a wattmeter), carbon footprint calculations, total mass/volume of waste generated, and mass of hazardous reagents used [8].
Advanced Framework: White Analytical Chemistry (WAC)
White Analytical Chemistry (WAC) represents the next evolution of sustainable analytical chemistry, strengthening traditional GAC by adding criteria for assessing analytical performance and practical usability [5]. WAC follows a holistic framework that integrates all three critical aspects of analytical methods using a color-coded model inspired by the Red-Green-Blue (RGB) color system [5]:
- Red Component: Represents analytical performance, focusing on attributes such as accuracy, precision, sensitivity, selectivity, and linearity
- Green Component: Incorporates traditional GAC metrics addressing environmental impact, safety, and waste generation
- Blue Component: Considers practical and economic aspects including method cost, time of analysis, availability of equipment, and ease of use
Under the WAC framework, the ideal "white" method achieves the optimal balance among all three components, ensuring environmental sustainability without compromising analytical quality or practical applicability [5]. This balanced position makes WAC particularly valuable for pharmaceutical quality control settings, where it enables informed decision-making when evaluating analytical method development or modification [5]. For example, replacing an existing HPLC method consuming high volumes of acetonitrile with a greener alternative would be evaluated not just for solvent reduction (green), but also for maintained analytical performance (red) and cost-effectiveness/throughput (blue) [5].
Diagram 1: WAC Framework Balancing Three Critical Components
Green Methodologies: Practical Applications and Protocols
Green Sample Preparation Techniques
Sample preparation is often the most polluting stage in analytical methods, making it a primary target for green improvements [6]. Key green sample preparation approaches include:
Solid Phase Microextraction (SPME): A solvent-free technique that combines extraction and enrichment using a silica fiber coated with an appropriate adsorbent phase [6]. The method involves exposing the fiber to the sample matrix (either through direct immersion or headspace), allowing analytes to partition into the coating, then thermally desorbing or eluting them into analytical instruments [6].
QuEChERS (Quick, Easy, Cheap, Effective, Rugged, and Safe): A two-stage method featuring solvent extraction with acetonitrile followed by dispersive solid-phase extraction for cleanup [6]. The protocol involves vigorously shaking the sample with buffer salts and magnesium sulfate, then using primary secondary amine (PSA) sorbent to remove matrix interferences, significantly reducing solvent consumption compared to traditional extraction methods [6].
Direct Chromatographic Methods: Eliminating sample preparation entirely through direct injection approaches [6]. Modern cross-linked stationary phases with improved resistance to water enable direct injection of aqueous samples, though pre-columns may be necessary to protect analytical columns from non-volatile residues [6].
Green Analytical Techniques and Instrumentation
Several analytical techniques have been developed or modified to align with GAC principles:
Miniaturized and Portable Devices: Reduced scale instrumentation that decreases solvent consumption, waste generation, and energy requirements while maintaining analytical performance [3]. Examples include miniature mass spectrometers for rapid on-site analysis of environmental samples and pharmaceutical compounds [9].
High-Performance Thin-Layer Chromatography (HPTLC): A favorable green alternative to HPLC with significantly lower solvent consumption and faster analysis times [5] [6]. In a case study comparing methods for thiocolchicoside and aceclofenac, HPTLC was preferred over HPLC due to its lower environmental impact despite HPLC's superior sensitivity and selectivity [5].
Ultra-High-Performance Liquid Chromatography (UHPLC): Provides improved efficiency over conventional HPLC with smaller particle size columns, enabling faster separations, reduced mobile phase consumption, and decreased waste generation [6].
Table 2: Comparison of Traditional vs. Green Analytical Techniques
| Analytical Aspect | Traditional Approach | Green Alternative | Environmental Benefit |
|---|---|---|---|
| Sample Preparation | Liquid-liquid extraction with large solvent volumes | Solid Phase Microextraction (SPME) | Eliminates solvent use entirely |
| Chromatography | Conventional HPLC with 4.6mm ID columns | UHPLC with 2.1mm ID columns | Redizes solvent consumption by ~80% |
| Solvent Selection | Acetonitrile, methanol, halogenated solvents | Ethanol, ethyl acetate, water | Lower toxicity and better biodegradability |
| Method Duration | 30-60 minute runs | 5-10 minute fast chromatography | Reduced energy consumption per sample |
| Sample Throughput | Sequential processing | Parallel sample treatment | Lower energy consumption per sample |
Experimental Protocol: Green RP-HPLC Method for Pharmaceutical Analysis
A validated green RP-HPLC method for the analysis of Olmesartan medoxomil demonstrates practical application of GAC principles [10]:
Materials and Equipment:
- HPLC system with UV detection
- Lichrosphere 250 × 4.0 mm RP C8 column (5μm packing)
- Ethyl acetate and ethanol (HPLC grade)
- Ultrasonic bath for mobile phase degassing
Mobile Phase Preparation:
- Prepare mixture of ethyl acetate:ethanol (50:50% v/v)
- Filter through 0.45μm membrane filter
- Degas using ultrasonic bath for 10 minutes
Chromatographic Conditions:
- Flow rate: 1.0 mL/min
- Detection wavelength: 250 nm
- Injection volume: 20 μL
- Temperature: Ambient (25°C)
Sample Preparation:
- For bulk drug: Dissolve in mobile phase to obtain 1 mg/mL solution
- For formulations: Extract powdered tablets in mobile phase with sonication
- Filter through 0.45μm syringe filter before injection
Method Validation:
- Linearity: 5-50 μg/mL (r² > 0.999)
- Precision: %RSD < 2% for repeatability and intermediate precision
- Accuracy: 98-102% recovery across concentration range
- Specificity: No interference from excipients or degradation products
This method successfully replaces traditional toxic solvents like acetonitrile and methanol with a greener combination of ethyl acetate and ethanol while maintaining analytical performance [10]. The method was applied to the analysis of olmesartan medoxomil in bulk drugs, self-microemulsifying drug delivery systems (SMEDDS), and commercial tablets with excellent results [10].
Implementation Strategies: GAC in Research and Industry
Green Solvents and Reagents
The transition to greener solvents represents one of the most significant opportunities for improving analytical sustainability. Water, supercritical carbon dioxide, ionic liquids, and bio-based solvents serve as alternatives to volatile organic compounds (VOCs), reducing toxicity and environmental impact [3]. Ethanol and ethyl acetate, as used in the olmesartan medoxomil method, exemplify this approach by providing effective chromatographic performance with improved safety profiles [10].
Table 3: Research Reagent Solutions for Green Analytical Chemistry
| Reagent Category | Traditional Materials | Green Alternatives | Function in Analysis |
|---|---|---|---|
| Extraction Solvents | Dichloromethane, chloroform, hexane | Ethyl acetate, ethanol, water | Sample preparation and compound extraction |
| Chromatographic Mobile Phases | Acetonitrile, methanol with buffers | Ethanol-water, supercritical CO₂ | Compound separation in chromatography |
| Sorbents | Synthetic polymers, silica gel | Biochar, primary secondary amine (PSA) | Selective adsorption in sample cleanup |
| Derivatization Agents | Toxic fluorophores, hazardous catalysts | Natural deep eutectic solvents (NADES) | Enhancing detection of target compounds |
| Calibration Standards | Pure analytical standards in toxic solvents | In-situ generated standards | Instrument calibration and quantification |
Energy-Efficient Techniques
Energy consumption represents another critical focus area for GAC implementation. Microwave-assisted and ultrasound-assisted methods enhance extraction efficiency and speed up mass transfer while consuming significantly less energy compared to traditional heating methods like Soxhlet extraction [1]. These approaches can be applied to miniaturized sample preparation systems that additionally minimize sample size, solvent, and reagent consumption [1].
Automation and Integration
Automated systems align perfectly with GAC principles by saving time, lowering consumption of reagents and solvents, reducing waste generation, and minimizing human intervention [1]. Integration of multiple preparation steps into a single, continuous workflow simplifies operations while cutting down on resource use and waste production [1]. For instance, multidimensional gas chromatography using nitrogen and hydrogen as carrier gases instead of helium demonstrates how method integration with greener materials enhances sustainability [9].
Future Perspectives: Challenges and Opportunities
Despite significant advances, GAC implementation faces several challenges. Analytical chemistry largely operates under a weak sustainability model, assuming that natural resources can be consumed and waste generated as long as technological progress and economic growth compensate for the environmental damage [1]. Transitioning to strong sustainability would require acknowledging ecological limits and prioritizing practices that restore natural capital [1]. The rebound effect presents another challenge, where efficiency gains lead to increased consumption – for example, a novel low-cost microextraction method might prompt laboratories to perform significantly more extractions, offsetting environmental benefits [1].
Coordination failure within the field also hinders progress, as circular analytical chemistry relies on collaboration among manufacturers, researchers, companies, routine labs, and policymakers [1]. Limited cooperation between industry and academia makes transitioning to circular processes challenging [1]. Additionally, regulatory agencies face the difficult task of phasing out outdated methods in favor of greener alternatives, with one study revealing that 67% of standard methods scored below 0.2 on the AGREEprep scale (where 1 represents maximum greenness) [1].
Future innovations will likely focus on emerging technologies like artificial intelligence and digital tools to optimize workflows, minimize waste, and streamline analytical processes [3]. The proposed Green Financing for Analytical Chemistry (GFAC) model aims to bridge implementation gaps by creating dedicated funds to finance innovation in sustainable analytical chemistry [5]. As environmental regulations tighten and industries shift toward greener practices, GAC principles will become increasingly essential for developing methods that are not only efficient but also environmentally responsible [4].
Diagram 2: GAC Method Development Workflow
Green Analytical Chemistry represents a fundamental shift in how chemical analysis is conducted, emphasizing environmental stewardship, sustainability, and efficiency alongside analytical performance. The SIGNIFICANCE mnemonic provides a practical framework for implementing GAC principles, while evolving metrics and assessment tools enable quantitative evaluation of methodological greenness. The emerging White Analytical Chemistry framework further strengthens this approach by balancing environmental sustainability with analytical performance and practical feasibility. For researchers, scientists, and drug development professionals, adopting GAC principles offers a pathway to reduce environmental impact while maintaining analytical quality and often improving economic efficiency. As the field continues to evolve, GAC will play an increasingly vital role in aligning analytical chemistry with global sustainability goals and addressing the complex environmental challenges of the 21st century.
The Evolution from Green Chemistry to the 12 Principles of GAC
The emergence of green chemistry in the 1990s represented a transformative shift in chemical philosophy, moving from pollution remediation to pollution prevention. This fundamental reorientation was formally codified in 1998 when Paul Anastas and John Warner introduced the 12 Principles of Green Chemistry in their seminal work Green Chemistry: Theory and Practice [11] [12]. These principles established a comprehensive framework for designing chemical products and processes that reduce or eliminate the use and generation of hazardous substances [13]. The historical context for this development traces back to growing environmental concerns highlighted by Rachel Carson's Silent Spring in 1962 and the establishment of the U.S. Environmental Protection Agency (EPA) in 1970 [12]. The Pollution Prevention Act of 1990 further cemented the philosophical foundation by establishing a national policy that pollution should be prevented or reduced at source whenever feasible [13].
The evolution from these foundational principles to quantitative assessment tools represents the next critical phase in sustainable chemistry. The development of the DOZN 3.0 quantitative green chemistry evaluator exemplifies this progression, providing researchers with a systematic methodology for comparing the relative greenness of chemicals, synthetic routes, and processes [14] [15]. This tool distills the 12 principles into three actionable categories: improving resource use, enabling more efficient energy use, and minimizing human and environmental hazards [15]. For drug development professionals and researchers, this evolution from conceptual frameworks to measurable metrics marks a significant advancement in implementing and validating sustainable chemistry practices within complex research and development pipelines.
The Foundation: Understanding the 12 Principles of Green Chemistry
The 12 Principles of Green Chemistry provide a systematic framework for designing chemical syntheses that are efficient, safe, and environmentally compatible. These principles serve as the foundational bedrock upon which modern green analytical chemistry (GAC) has been built, offering strategic guidance for researchers and industrial chemists alike. The principles encompass all stages of chemical design, manufacture, use, and disposal, applying across the entire life cycle of chemical products [13].
Table 1: The 12 Principles of Green Chemistry and Their Research Significance
| Principle Number | Principle Name | Core Concept | Significance for Researchers |
|---|---|---|---|
| 1 | Prevention | Preventing waste generation is superior to treating or cleaning up waste after it is formed [13] [11]. | Reduces environmental impact and disposal costs; measured via E-factor and Process Mass Intensity (PMI) [16]. |
| 2 | Atom Economy | Synthetic methods should maximize incorporation of all starting materials into the final product [13] [11]. | Promotes synthetic efficiency; calculated as (FW of desired product / Σ FW of all reactants) × 100 [16]. |
| 3 | Less Hazardous Chemical Syntheses | Synthetic methods should use/generate substances with minimal toxicity to humans and the environment [13] [11]. | Enhances laboratory safety and reduces environmental footprint; encourages solvent/substitution guides [17]. |
| 4 | Designing Safer Chemicals | Chemical products should be designed to achieve desired function while minimizing toxicity [13] [11]. | Balances molecular efficacy with reduced biological and environmental hazards [17]. |
| 5 | Safer Solvents and Auxiliaries | Minimize use of auxiliary substances; use safer alternatives when required [13] [11]. | Reduces exposure to hazardous solvents; guides selection of greener alternatives like ethyl acetate or 2-MeTHF [17]. |
| 6 | Design for Energy Efficiency | Recognize and minimize energy requirements of chemical processes [13] [11]. | Lowers operational costs and environmental impact; favors ambient temperature and pressure [16]. |
| 7 | Use of Renewable Feedstocks | Use renewable raw materials rather than depletable feedstocks [13] [11]. | Enhances sustainability; utilizes biomass instead of fossil fuels [13]. |
| 8 | Reduce Derivatives | Avoid unnecessary derivatization (blocking groups, protection/deprotection) [13] [11]. | Simplifies synthesis, reduces steps, reagents, and waste; enzymatic methods can help [18]. |
| 9 | Catalysis | Catalytic reagents (selective as possible) are superior to stoichiometric reagents [13] [11]. | Increases efficiency; catalysts are effective in small amounts and carry out multiple reaction cycles [13]. |
| 10 | Design for Degradation | Design chemical products to break down into innocuous substances after use [13] [11]. | Prevents environmental persistence and bioaccumulation of chemicals [18]. |
| 11 | Real-time Analysis for Pollution Prevention | Develop analytical methodologies for real-time, in-process monitoring [13] [11]. | Allows for immediate process control to prevent hazardous substance formation [11]. |
| 12 | Inherently Safer Chemistry for Accident Prevention | Choose substances and their physical forms to minimize accident potential [13] [11]. | Mitigates risks of explosions, fires, and environmental releases through fundamental design [11]. |
The principles are deeply interconnected, creating a synergistic system for sustainable chemical design. For instance, atom economy (Principle 2) directly supports waste prevention (Principle 1), as reactions that incorporate more starting atoms into the final product inherently generate less waste [16] [17]. Similarly, the use of catalysis (Principle 9) frequently enables reduced derivatives (Principle 8) and enhances energy efficiency (Principle 6) by allowing reactions to proceed under milder conditions [18]. For pharmaceutical researchers, these principles provide a proactive framework for designing synthetic routes that are not only environmentally responsible but also more cost-effective and efficient, ultimately supporting the development of safer therapeutics with reduced environmental impact throughout their lifecycle.
Quantitative Evolution: From Principles to Practical Metrics
The transition from qualitative principles to quantitative assessment frameworks marks a critical evolution in green chemistry, enabling researchers to make objective comparisons and measure improvements. Several key metrics have been developed to translate the 12 principles into actionable data, providing the scientific community with standardized tools for evaluation.
Table 2: Core Quantitative Metrics for Green Chemistry Assessment
| Metric Name | Calculation Formula | Application | Ideal Value | Industry Example |
|---|---|---|---|---|
| E-Factor [16] | e-factor = mass of waste (kg) / mass of product (kg) |
Measures waste generation efficiency of a process. | Lower is better; Oil refining: <0.1 [16] | Pharmaceutical API processes historically had E-factors of 25-100+ [16] |
| Process Mass Intensity (PMI) [16] | PMI = total process mass (kg) / mass of product (kg) |
Broader assessment of all materials used, including solvents, water. | Lower is better; Minimum = 1 [16] | Adopted by ACS Green Chemistry Institute Pharmaceutical Roundtable for API processes [17] |
| Atom Economy [16] | Atom Economy (%) = (FW of desired product / Σ FW of reactants) × 100 |
Theoretical efficiency of a reaction in incorporating starting atoms into the product. | Higher is better; Maximum = 100% [16] | Diels-Alder cycloaddition: ~100% atom economy [12] |
| EcoScale [16] | Score based on penalty points for yield, cost, safety, technical setup, temperature/time, workup. | Comprehensive metric that includes practical, safety, and economic factors. | Higher is better; Maximum = 100 [16] | Used for comparing synthetic route optimization in research [16] |
The DOZN 3.0 tool, developed by Merck, represents a significant advancement in quantitative green chemistry evaluation [14]. This web-based tool utilizes the 12 principles as a foundation but organizes them into three overarching categories: improving resource use, energy efficiency, and reducing human and environmental hazards [15]. DOZN generates a comparative score that enables researchers and drug development professionals to objectively evaluate the relative greenness of alternative synthetic routes or similar chemicals. A compelling case study demonstrated the power of this quantitative assessment: the re-engineering of a β-Amylase manufacturing process resulted in the DOZN score being lowered from 57 to 1, indicating a dramatic improvement in greenness while simultaneously enhancing yield and efficiency [15].
Beyond these established metrics, research continues to develop more comprehensive assessment techniques. One study proposed a quantitative "greenness" evaluation incorporating environmental, safety, resource, and economic indices [19]. This approach calculates a composite greenness score using the formula: Greenness = α·Σenvironment + β·Σsafety + γ·Σresource (+ δ·Σeconomy) where α, β, γ, and δ are weights derived from expert analysis [19]. Such methodologies enable a more nuanced evaluation of green chemistry technologies, considering factors like greenhouse gas emissions, hazardous substance impacts, and industrial accident potential alongside traditional efficiency metrics.
Advanced Quantitative Assessment Framework
For research scientists requiring rigorous assessment protocols, the comprehensive greenness evaluation methodology provides a detailed framework for quantifying improvements in chemical processes. This methodology employs specific experimental protocols and calculations across four key indices: environment, safety, resource, and economy [19].
Environmental Impact Assessment Protocol
The environmental impact assessment quantifies two primary factors: greenhouse gas (GHG) emissions and hazardous substance impacts. The experimental protocol requires researchers to:
- Catalog all materials: Identify all raw materials, products, by-products, and emissions from the chemical process [19].
- Quantify GHG emissions: Calculate CO₂ equivalent emissions for all process steps using Intergovernmental Panel on Climate Change (IPCC) methodologies, including energy consumption converted to tCO₂ [19].
- Evaluate hazardous substances: Calculate Health Hazard Factors (HHF) and Environmental Hazard Factors (EHF) for all process components using established reference scales:
- Composite Environmental Score: Calculate ΣEnvironment = αₐ·ΣGHGs + αբ·ΣHazardous substances, where weights are derived from Analytic Hierarchy Process (AHP) analysis [19].
Safety, Resource, and Economic Assessment
The safety assessment protocol involves quantifying the inherent hazards of all chemical substances involved in the production process (raw materials, products/by-products, and emissions) by evaluating their R-Phrases against a standardized reference scale [19]. The resulting safety factor is calculated as: ΣSafety = x₂·Σraw materials + y₂·Σproducts/by-products + z₂·Σemissions [19].
Resource assessment focuses on efficacious production by minimizing depleting resources. The protocol evaluates resource consumption improvement rates, with specific calculations for different material types:
- Organic compounds: Assessed via carbon efficiency
- Precious/rare metals: Evaluated based on content efficiency The resource improvement is calculated as: Resource = 1 - (consumption after improvement / consumption before improvement) [19].
Economic assessment, while not part of the original 12 principles, is recognized as essential for industry adoption. The protocol evaluates:
- Production cost reduction relative to baseline expenditures
- Consumer price reduction relative to baseline retail price The composite economic feasibility is calculated as a weighted average of these factors [19].
Case Study: Waste Acid Reutilization Assessment
A documented application of this comprehensive assessment examined the reutilization of waste acid from electronic parts pickling [19]. By installing cooling equipment to address excessive use of nitrogen chemicals, the process achieved a 42% enhancement in greenness compared to pre-improvement levels [19]. This case study demonstrates the practical utility of quantitative assessment in validating green chemistry technologies and guiding process optimization decisions.
Diagram 1: Evolution of Green Chemistry Assessment showing the progression from historical context through principles to quantitative tools.
Implementation in Pharmaceutical Research and Development
The pharmaceutical industry has emerged as a pioneering sector in implementing green chemistry principles, driven by both environmental responsibilities and compelling economic factors. The development of active pharmaceutical ingredients (APIs) traditionally involved complex multi-step syntheses with high E-factors, often exceeding 100 kg of waste per kg of final product [16] [17]. The adoption of green chemistry metrics and principles has enabled significant advancements in sustainable drug development.
Experimental Protocol: Green Chemistry Assessment for API Synthesis
For drug development professionals implementing green chemistry evaluation, the following experimental protocol provides a systematic methodology:
Baseline Establishment:
Route Optimization:
- Apply Principle 2 (Atom Economy): Evaluate alternative synthetic pathways with higher inherent atom economy [17].
- Apply Principle 5 (Safer Solvents): Substitute hazardous solvents (e.g., dichloromethane, benzene) with safer alternatives (e.g., ethyl acetate, 2-methyltetrahydrofuran) using established solvent selection guides [17].
- Apply Principle 9 (Catalysis): Implement catalytic reactions to replace stoichiometric reagents, reduce steps, and improve selectivity [18].
Process Intensification:
- Apply Principle 8 (Reduce Derivatives): Minimize or eliminate protecting groups through strategic bond formation or enzymatic methods [18].
- Apply Principle 6 (Energy Efficiency): Optimize reaction conditions to operate at ambient temperature and pressure where feasible [16].
- Implement Principle 11 (Real-time Analysis): Incorporate process analytical technology (PAT) for in-line monitoring and control [11].
Comparative Assessment:
Table 3: Research Reagent Solutions for Green Chemistry in Pharmaceutical Development
| Reagent Category | Traditional Reagents | Green Alternatives | Function | Principle Addressed |
|---|---|---|---|---|
| Solvents | Dichloromethane, Benzene, DMF | Ethyl acetate, 2-MeTHF, Cyrene, water [17] | Reaction medium, extraction | Principle 5: Safer Solvents |
| Catalysts | Stoichiometric reagents (AlCl₃, MnO₂) | Biocatalysts, heterogeneous catalysts, organocatalysts [18] | Accelerate reactions without being consumed | Principle 9: Catalysis |
| Oxidizing Agents | Chromium(VI) compounds, MnO₂ | Hydrogen peroxide, O₂ (molecular oxygen), biocatalytic oxidation [17] | Selective oxidation | Principle 3: Less Hazardous Synthesis |
| Reducing Agents | LiAlH₄, NaBH₄ with additives | Catalytic hydrogenation, biomimetic reductants [17] | Selective reduction | Principle 3: Less Hazardous Synthesis |
| Activating Agents | SOCl₂, COCl₂ (phosgene) | Solid acid catalysts, TCICA, polymer-supported reagents [17] | Functional group activation | Principle 4: Designing Safer Chemicals |
Case Studies: Pharmaceutical Green Chemistry Applications
Several landmark applications demonstrate the successful implementation of green chemistry principles in pharmaceutical development:
Simvastatin Synthesis (Codexis & UCLA): Developed a biocatalytic manufacturing process for simvastatin using an engineered acyltransferase, eliminating hazardous reagents and reducing solvent waste [17]. This approach addressed Principle 9 (Catalysis) and Principle 3 (Less Hazardous Chemical Syntheses).
Sertraline Manufacturing (Pfizer): Redesigned the synthesis of the active ingredient in Zoloft, optimizing the synthetic route to reduce from three separate manufacturing facilities to one, dramatically improving atom economy and eliminating hazardous reagents [17]. This achievement exemplified Principle 2 (Atom Economy) and Principle 1 (Waste Prevention).
β-Amylase Process Re-engineering: Utilizing the DOZN evaluator, researchers transformed the manufacturing process for this enzyme into an energy-efficient, non-hazardous operation with significantly greater efficiency and yield, achieving a dramatic reduction in DOZN score from 57 to 1 [15].
Diagram 2: GAC Principles Assessment Framework showing how principles translate to measurable metrics for research applications.
Future Directions and Integration with Broader Frameworks
The evolution of green chemistry continues to advance beyond the foundational 12 principles, integrating with broader sustainability frameworks and emerging technologies. A significant development is the growing connection between green chemistry and Responsible Research and Innovation (RRI), which addresses socio-ethical, economic, and political dimensions that were not explicitly covered in the original principles [20]. Recent studies have proposed integrated methodologies such as "responsible roadmapping" to help researchers develop interdisciplinary agendas that address both technical and socio-ethical considerations in chemical research and development [20].
The integration of artificial intelligence and machine learning represents another frontier in green chemistry evolution. By the 2020s, AI-driven approaches began enabling researchers to rapidly identify and design new sustainable catalysts and reaction pathways, minimizing waste and energy consumption [12]. These computational tools can predict reaction outcomes, optimize process conditions, and even design biodegradable molecular structures, accelerating the implementation of green chemistry principles across research and development pipelines.
The principles of green chemistry are increasingly recognized as essential contributors to achieving Sustainable Development Goals (SDGs) and supporting the transition to a circular economy [20]. Green chemistry principles directly support several SDGs, including responsible consumption and production (SDG 12), climate action (SDG 13), and life below water (SDG 14) through the design of biodegradable chemicals and pollution prevention [12] [20]. As regulatory frameworks like the European Green Deal advance ambitions for climate neutrality by 2050, the principles of green chemistry provide fundamental guidance for transforming chemical production and consumption systems [12].
For drug development professionals and researchers, these evolving frameworks offer increasingly sophisticated tools for designing sustainable chemistry solutions. The ongoing integration of green chemistry with complementary approaches like RRI ensures that future innovations will address not only technical efficiency but also social responsibility and ethical implications, creating a more comprehensive foundation for sustainable scientific progress.
Green Analytical Chemistry (GAC) has emerged as a transformative approach to mitigate the adverse environmental impacts of analytical activities while maintaining high-quality analytical results [5]. Evolving from the foundational Twelve Principles of Green Chemistry established by Anastas and Warner, GAC focuses on integrating sustainability directly into analytical research laboratories [5] [7]. The primary challenge of GAC lies in balancing the reduction of environmental impacts with the maintenance or improvement of analytical quality [7]. To effectively implement GAC principles in practice, the SIGNIFICANCE mnemonic was developed as a comprehensive framework for implementing sustainable and eco-friendly analytical practices [5]. This mnemonic serves as a practical roadmap for researchers, scientists, and drug development professionals seeking to align their analytical methodologies with sustainability goals without compromising analytical performance.
The evolution of GAC has led to the development of more holistic frameworks, including White Analytical Chemistry (WAC), which expands GAC principles by incorporating analytical performance (red criteria) and practical/economic aspects (blue criteria) alongside environmental sustainability (green criteria) [5]. This RGB model represents the next iteration of sustainable analytical practices, ensuring methods are not only environmentally sound but also analytically robust and economically viable [5]. Within this context, understanding the SIGNIFICANCE mnemonic remains fundamental to implementing core GAC principles in pharmaceutical research and analytical method development.
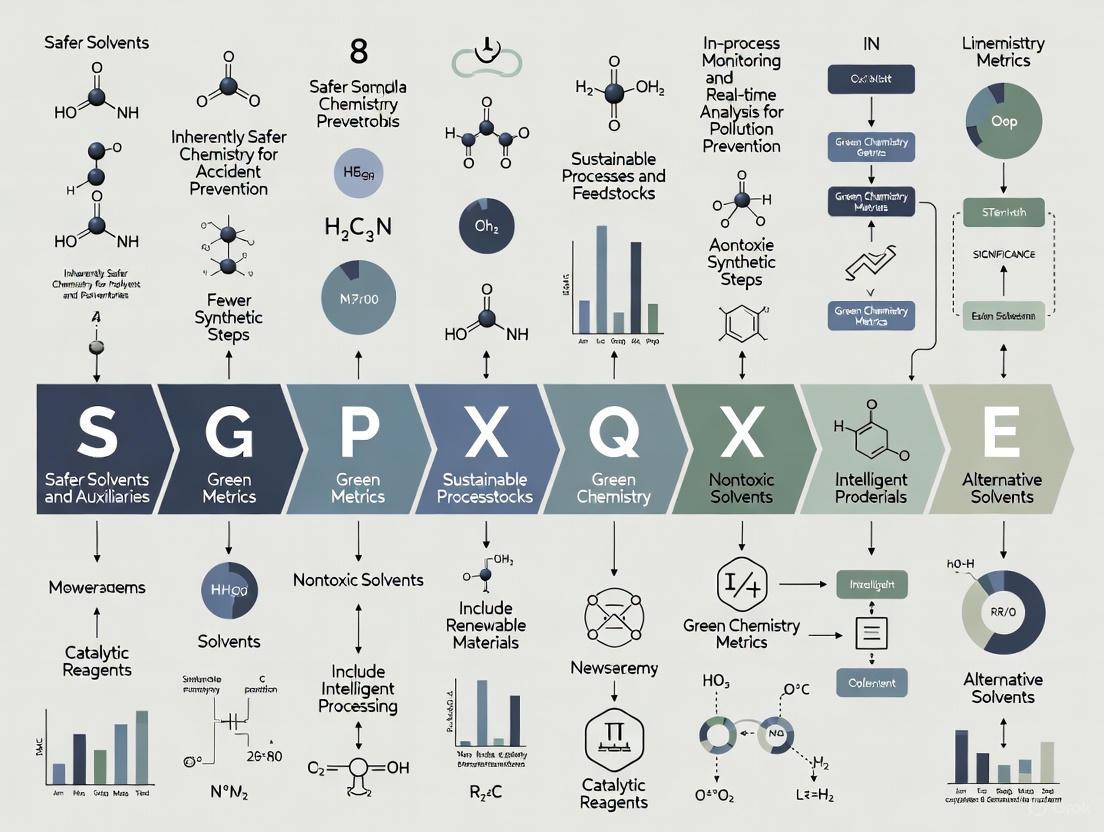
Letter-by-Letter Deconstruction of the SIGNIFICANCE Mnemonic
The SIGNIFICANCE mnemonic provides a systematic approach to implementing Green Analytical Chemistry principles. Each letter represents a key consideration for developing environmentally sustainable analytical methods while maintaining scientific rigor. The following table presents a comprehensive deconstruction of this mnemonic:
Table 1: Comprehensive Deconstruction of the SIGNIFICANCE Mnemonic in Green Analytical Chemistry
| Letter | Principle | Technical Interpretation | Key Applications in Drug Development |
|---|---|---|---|
| S | Select direct analytical methods | Avoid sample treatment; use instrumental direct analysis [5] | Near-infrared spectroscopy for raw material identification; Raman spectroscopy for API quantification |
| I | Integrate analytical processes & operations | Combine sampling, preparation, and analysis into automated systems [5] | Online SPE-LC-MS systems for bioanalysis; automated dissolution testing with in-line analysis |
| G | Generate as little waste as possible & recycle | Minimize solvent consumption; implement solvent recycling programs [5] | Micro-extraction techniques for bioanalytical samples; closed-loop solvent recycling in HPLC preparative purification |
| N | Never use hazardous chemicals or large amounts | Substitute hazardous solvents with safer alternatives [5] | Replacement of acetonitrile with ethanol or methanol in HPLC; ionic liquids as green extraction solvents |
| I | Implement automation and miniaturization | Develop automated methods; reduce scale of operations [5] | 384-well plate formats for high-throughput screening; microfluidic devices for ADME screening |
| F | Favor reagents from renewable sources | Choose biobased solvents over petroleum-derived [5] | Use of ethanol from biomass rather than synthetic sources; plant-derived surfactants for extraction |
| I | Increase safety for operator | Reduce exposure to hazardous materials; implement engineering controls [5] | Closed-system sampling for potent compound analysis; automated solid dispensing for cytotoxic compounds |
| C | Carry out in-situ measurements | Perform analysis at point of need rather than transferring samples [5] | Process Analytical Technology (PAT) for real-time monitoring of manufacturing processes; portable GC-MS for facility monitoring |
| A | Avoid derivatives & chemical treatments | Eliminate unnecessary derivatization steps [5] | Direct analysis of carbohydrates without derivatization using HILIC-MS; underivatized amino acid analysis with LC-MS/MS |
| N | Note sample preparation key for greenness | Optimize extraction techniques for minimal environmental impact [5] | Selective pressurized liquid extraction for natural products; QuEChERS sample preparation for pesticide residues |
| C | Choose multi-analyte or multiplexed methods | Analyze multiple components simultaneously rather than sequentially [5] | UHPLC-MS/MS multiplexed assays for drug metabolites; multi-element ICP-MS for elemental impurities |
| E | Enable energy savings by all means | Reduce energy consumption of analytical instrumentation [5] | Low-temperature GC separations; reduced flow rate LC-MS systems; instrument power management protocols |
Strategic Implementation in Pharmaceutical Analysis
The sequential application of the SIGNIFICANCE mnemonic enables systematic greening of analytical methods throughout the drug development pipeline. Beginning with Sample Selection (S), researchers should evaluate whether direct analysis techniques can provide the necessary information without extensive sample preparation. For Integrated Processes (I), modern analytical platforms now offer completely integrated systems that combine sample preparation, separation, and detection in automated workflows, significantly reducing solvent consumption and waste generation while improving reproducibility [5].
The principles of Waste Generation (G) and Hazardous Chemical Avoidance (N) work synergistically in pharmaceutical analysis. Microscale techniques and solvent substitution strategies have demonstrated significant reductions in environmental impact while maintaining analytical performance. For instance, replacing traditional acetonitrile with ethanol or methanol in reversed-phase HPLC methods represents a practical application of these principles that aligns with both green chemistry and industrial practicality [5].
Quantitative Greenness Assessment Metrics for GAC
While the SIGNIFICANCE mnemonic provides qualitative guidance, several quantitative metrics have been developed to objectively evaluate the greenness of analytical methods. These tools enable researchers to numerically assess and compare the environmental performance of different analytical approaches.
Table 2: Green Analytical Chemistry Assessment Metrics and Their Applications
| Assessment Tool | Type | Key Parameters Measured | Scoring System | Pharmaceutical Application Examples |
|---|---|---|---|---|
| NEMI (National Environmental Methods Index) | Pictogram [7] | PBT chemicals, hazardous waste, corrosivity, waste amount [7] | Binary (green/white) quadrant pictogram [7] | HPLC method validation for drug impurity testing |
| Analytical Eco-Scale | Point-based [7] | Reagent toxicity, energy consumption, waste production [7] | 100-point ideal; >75 excellent greenness [7] | Comparison of sample preparation techniques for bioanalysis |
| GAPI (Green Analytical Procedure Index) | Pictogram [5] [7] | Multiple stages from sampling to waste treatment [7] | 5 pentagrams color-coded for environmental impact [7] | Lifecycle assessment of API stability-indicating methods |
| AGREE (Analytical Greenness Calculator) | Software-based [7] | 12 GAC principles comprehensively assessed [7] | 0-1 scale with color-coded circular pictogram [7] | Pre-development assessment of candidate analytical methods |
| ComplexGAPI | Advanced pictogram [5] | Holistic assessment including energy and purification [5] | Multi-section colored diagram with weighted areas [5] | Comparative evaluation of HPLC vs. UHPLC methods for formulation analysis |
Advanced Assessment: White Analytical Chemistry (WAC) Scoring
The emergence of White Analytical Chemistry (WAC) has introduced a more balanced evaluation framework that incorporates the traditional greenness assessment with analytical and practical metrics. The WAC approach employs an RGB color model where the Green component assesses environmental impact, the Red component evaluates analytical performance (accuracy, precision, sensitivity), and the Blue component addresses practical/economic aspects (cost, time, operational simplicity) [5].
This tripartite assessment ensures that methods are not only environmentally friendly but also analytically sound and practically feasible for implementation in regulated pharmaceutical environments. WAC scoring has been successfully applied to stability-indicating High-Performance Thin-Layer Chromatography (HPTLC) methods for thiocolchicoside and aceclofenac, demonstrating how environmental considerations can be balanced with analytical requirements in pharmaceutical analysis [5].
Experimental Protocols for GAC Implementation
Protocol 1: Greenness Assessment Using Analytical Eco-Scale
Principle: The Analytical Eco-Scale assigns penalty points to parameters that deviate from ideal green analysis, with higher scores indicating greener methods [7].
Procedure:
- Begin with a perfect score of 100 points
- Subtract penalty points for reagents: (1) amount >0.1 mL (or mg) but <1 mL, subtract 1 point; (2) amount >1 mL (or mg) but <10 mL, subtract 2 points; amount >10 mL (or mg), subtract 3 points
- Subtract penalty points based on reagent hazard: highly hazardous (e.g., strong acids/bases, heavy metals) subtract 6 points; hazardous (e.g., chlorinated solvents) subtract 3 points; less hazardous (e.g., ethanol, water) subtract 1 point
- Subtract points for energy consumption: >1.5 kWh per sample subtract 2 points; >0.1 kWh but <1.5 kWh subtract 1 point; <0.1 kWh subtract 0 points
- Subtract points for waste: subtract 1 point per waste gram generated
- Interpret results: score >75 represents excellent green method; score >50 represents acceptable green method; score <50 represents insufficient green method [7]
Protocol 2: AGREEprep Assessment for Sample Preparation
Principle: AGREEprep is a dedicated software-based tool for evaluating the greenness of sample preparation procedures based on the 10 principles of Green Sample Preparation (GSP) [7].
Procedure:
- Input all sample preparation parameters including sample amount, solvent type and volume, energy consumption, equipment used, and waste generated
- The software calculates scores for each of the 10 GSP principles:
- Principle 1: Minimize or eliminate sample preparation
- Principle 2: Use minimal sample size
- Principle 3: Perform sample preparation in-situ
- Principle 4: Integrate steps of the analytical process
- Principle 5: Use safer alternatives to hazardous reagents
- Principle 6: Minimize waste generation
- Principle 7: Maximize operator safety
- Principle 8: Minimize energy consumption
- Principle 9: Prefer reusable materials
- Principle 10: Automate for efficiency
- The tool generates a circular pictogram with 10 segments, each color-coded from red (poor) to green (excellent)
- An overall score between 0-1 is provided, with higher scores indicating greener sample preparation methods [7]
Diagram: GAC Method Development Workflow
Diagram 1: GAC Method Development Workflow
The Scientist's Toolkit: Essential Research Reagent Solutions
Table 3: Green Alternative Reagents for Pharmaceutical Analysis
| Reagent Category | Traditional Reagents | Green Alternatives | Function in Analysis | Key Benefits |
|---|---|---|---|---|
| Extraction Solvents | Chloroform, dichloromethane, hexane [7] | Ethyl acetate, cyclopentyl methyl ether, 2-methyltetrahydrofuran [5] | Sample preparation, compound isolation | Reduced toxicity, improved biodegradability, safer waste profiles |
| Chromatographic Mobile Phases | Acetonitrile, methanol with modifiers [5] | Ethanol, water with temperature control, supercritical CO₂ [5] | Liquid chromatography separation | Lower environmental impact, reduced hazardous waste, renewable sources |
| Derivatization Agents | HFBA, BSTFA, DNPH | No-derivatization approaches, microwave-assisted synthesis [5] | Analyte functionalization for detection | Elimination of hazardous reagent use, simplified workflows |
| Calibration Standards | Organic solvent-based stock solutions | Aqueous-based standards, stable isotope-labeled internal standards [5] | Quantitative analysis reference | Reduced organic solvent consumption, improved accuracy |
| Sample Preservation Agents | Sodium azide, thymol | Ascorbic acid, low-temperature storage [5] | Biological sample stabilization | Reduced toxicity, compatibility with analytical systems |
The SIGNIFICANCE mnemonic provides a comprehensive, actionable framework for implementing Green Analytical Chemistry principles in pharmaceutical research and drug development. Through systematic application of each principle and rigorous assessment using established greenness metrics, researchers can significantly reduce the environmental impact of analytical methods while maintaining the high-quality data required for regulatory submissions and product quality assurance. The evolution toward White Analytical Chemistry represents a more holistic approach that balances environmental sustainability with analytical performance and practical feasibility, ensuring that green methods are not only theoretically sound but also practically implementable in real-world pharmaceutical settings. As green financing models like GFAC (Green Financing for Analytical Chemistry) emerge to support sustainable method development, the integration of these principles throughout the drug development lifecycle will become increasingly essential for environmentally responsible pharmaceutical innovation [5].
Waste Minimization, Safety, and Energy Efficiency
Green Analytical Chemistry (GAC) has emerged from the broader framework of green chemistry, establishing itself as a critical discipline for making laboratory practices more environmentally friendly and sustainable [21]. The core objective of GAC is to reach a compromise between the increasing quality of analytical results and improving the environmental friendliness of the methods [21]. This guide details the key concepts of waste minimization, safety, and energy efficiency, which form the backbone of the 12 principles of GAC and are encapsulated in the SIGNIFICANCE mnemonic, providing a structured framework for researchers and drug development professionals to implement these practices effectively [21].
The following diagram illustrates the core decision-making workflow in Green Analytical Chemistry, focusing on the three pillars of waste minimization, safety, and energy efficiency.
The SIGNIFICANCE Mnemonic and GAC Principles
The 12 principles of Green Analytical Chemistry provide a comprehensive guideline for greening laboratory practices [21]. These principles have been condensed into the SIGNIFICANCE mnemonic to aid in their recall and application [21]. The three focal points of this guide—waste minimization, safety, and energy efficiency—are deeply embedded within these principles.
Table 1: The 12 Principles of Green Analytical Chemistry
| Principle Number | Principle Description | Core Concept |
|---|---|---|
| 1 | Select direct analytical techniques to avoid sample treatment. | Waste Minimization |
| 2 | Employ minimal sample size and number of samples. | Waste Minimization |
| 3 | Perform in-situ measurements. | Energy Efficiency |
| 4 | Integrate analytical processes and operations. | Energy Efficiency |
| 5 | Choose automated and miniaturized methods. | Waste Minimization, Energy Efficiency |
| 6 | Avoid derivatization. | Safety, Waste Minimization |
| 7 | Avoid large volume of waste; manage properly. | Waste Minimization, Safety |
| 8 | Use multi-analyte or multi-parameter methods. | Waste Minimization, Energy Efficiency |
| 9 | Choose natural, renewable, or less harmful reagents. | Safety |
| 10 | Use reagents from renewable sources. | Safety |
| 11 | Eliminate or replace hazardous reagents. | Safety |
| 12 | Ensure operator's safety. | Safety |
The SIGNIFICANCE Mnemonic
The SIGNIFICANCE mnemonic is a practical tool that encapsulates the core tenets of GAC [21]:
- S - Sample directness and minimal number
- I - In-situ measurements
- G - Green solvents and reagents
- N - No waste generation
- I - Integration of processes
- F - Fast analysis
- I - Automation and miniaturization
- C - Clean and safe procedures
- A - Avoidance of derivatization
- N - Energy efficiency
- C - Cost-effectiveness
- E - Operator safety
Quantitative Data on Waste and Energy Impacts
Effective implementation of GAC principles leads to tangible environmental benefits. A 2025 study by the European Commission's Joint Research Centre provides a quantitative assessment of the impacts of waste management, highlighting the significant potential for improvement [22].
Table 2: Environmental and Economic Impact of EU Waste Management (2025 Data)
| Metric | Value | Context and Comparison |
|---|---|---|
| Annual GHG Emissions Saved | 34 million t CO₂-eq. | Saved by current EU waste management practices [22] |
| GHG Saved per Tonne of Waste | 17 kg CO₂-eq. | Net saving; global waste management is a net emitter (≈250 kg CO₂-eq./tonne) [22] |
| Key Contributor to Savings | Metal waste management | Drives 83% of the EU's emissions savings from waste management [22] |
| Societal Cost of Management | €136 billion annually | Equates to €68 per tonne of waste managed, or €304 per citizen [22] |
| Plastic Packaging Recycling | 41% | Percentage currently separately collected and sent for recycling in the EU [22] |
| Textile Waste Recycling | 22% | Percentage of post-consumer textile waste separately collected and recycled [22] |
Methodologies and Experimental Protocols for GAC Implementation
Workflow for Sample Preparation and Analysis
Adhering to GAC principles requires re-evaluating every step of the analytical process. The following workflow provides a visual guide for designing a green sample preparation and analysis protocol.
Detailed Methodological Approaches
- Direct Analytical Techniques (Principle 1): Implement direct analysis methods like near-infrared (NIR) spectroscopy or X-ray fluorescence (XRF) to eliminate extensive sample preparation, thereby reducing solvent use and waste generation [21].
- Automated and Miniaturized Methods (Principle 5): Employ flow injection analysis (FIA), lab-on-a-chip (LOC) technologies, or automated solid-phase extraction (SPE) systems. These systems reduce reagent consumption from milliliters to microliters and enhance analytical throughput while lowering energy requirements [21].
- Waste Management and Treatment (Principle 7): For unavoidable waste, establish procedures for on-site neutralization, recycling, or concentration. The US EPA's Waste Reduction Model (WARM) provides a high-level tool for comparing the greenhouse gas emissions impacts of different waste management practices, including recycling and combustion [23].
The Scientist's Toolkit: Essential Reagents and Materials
The choice of reagents and materials is fundamental to the safety and greenness of an analytical method.
Table 3: Research Reagent Solutions for Green Analytical Chemistry
| Item / Category | Function & Application | Green Rationale & Alternative |
|---|---|---|
| Water & Ethanol | Primary green solvents for extraction and chromatography. | Replace hazardous solvents like chlorinated methanes or benzene. They are renewable, less toxic, and biodegradable [21]. |
| Ionic Liquids | Salts in liquid state used as solvents or electrolytes. | Low volatility reduces inhalation hazards and atmospheric pollution compared to traditional volatile organic compounds (VOCs) [21]. |
| Natural Reagents | Biosourced compounds (e.g., cyclodextrins) for complexation. | Derived from renewable sources, generally less toxic, and reduce dependency on petrochemical-based reagents [21]. |
| Solid-Phase Microextraction (SPME) Fibers | Solvent-free extraction and pre-concentration of analytes. | Eliminates the need for large volumes of organic solvents used in traditional liquid-liquid extraction [21]. |
| Micro-Scale Labware | Miniaturized reactors, columns, and chips for analysis. | Dramatically reduces consumption of samples, reagents, and solvents, directly minimizing waste generation [21]. |
The integration of waste minimization, safety, and energy efficiency through the framework of the 12 GAC principles and the SIGNIFICANCE mnemonic provides a robust pathway for modern analytical laboratories to advance their sustainability [21]. As evidenced by recent quantitative studies, the proper management of analytical waste and a conscious effort to reduce energy consumption and hazardous materials have a direct and significant impact on reducing greenhouse gas emissions and societal costs [22]. For researchers and drug development professionals, adopting these principles is no longer optional but a critical component of responsible and forward-thinking scientific practice.
The Ethical and Economic Imperative for GAC in Pharmaceutical Development
Green Analytical Chemistry (GAC) represents a transformative approach to drug analysis that seeks to eliminate or reduce the use of hazardous substances while making analytical processes more efficient and environmentally benign. First articulated by Paul Anastas, GAC has evolved from a theoretical concept to an essential framework for sustainable pharmaceutical development [24]. The conventional analytical methods used in pharmaceuticals, such as high-pressure liquid chromatography and gas chromatography, traditionally consume significant energy and produce substantial chemical debris that threatens natural ecosystems [24]. The implementation of GAC principles addresses these environmental challenges while simultaneously creating economic value and ethical advantages throughout the drug development pipeline.
The SIGNIFICANCE mnemonic framework organizes the core principles of GAC into a actionable strategy for implementation. This comprehensive approach aligns with growing regulatory pressures and stakeholder expectations for environmentally conscious manufacturing practices. For researchers, scientists, and drug development professionals, mastering GAC is no longer optional but imperative for developing sustainable, cost-effective, and ethically defensible pharmaceutical products.
The SIGNIFICANCE of GAC: A Mnemonic Framework for Implementation
Core Principles Breakdown
The SIGNIFICANCE mnemonic encapsulates the essential principles of Green Analytical Chemistry, providing a structured framework for implementation in pharmaceutical development:
- S - Sample Management: Focus on reducing sample sizes and implementing direct analysis techniques to minimize reagent consumption and waste generation [24].
- I - Instrumental Analysis: Prioritize automated and miniaturized systems that enhance energy efficiency while maintaining analytical precision.
- G - Green Solvents: Substitute hazardous organic solvents with safer, biodegradable alternatives wherever technically feasible.
- N - Non-Destructive Methods: Develop and implement analytical procedures that preserve sample integrity for potential reuse or further testing.
- I - In-Process Monitoring: Integrate real-time analysis within manufacturing to reduce quality control cycles and resource consumption.
- F - Fuel Efficiency: Optimize instrument energy consumption through method optimization and equipment modernization.
- I - Integration of Techniques: Combine multiple analytical procedures to streamline workflows and reduce overall resource requirements.
- C - Chemical Waste Management: Implement systematic approaches to reduce, reuse, and recycle chemical byproducts from analytical processes.
- A - Automation: Employ robotic systems and automated platforms to enhance precision while reducing solvent and energy usage.
- N - New Technologies: Continuously evaluate and adopt emerging green technologies that offer environmental and economic advantages.
- C - Carbon Footprint Reduction: Monitor and minimize greenhouse gas emissions throughout analytical operations.
- E - Energy Consumption: Systematically track and optimize energy usage across all analytical instrumentation and processes [24].
Quantitative Impact Assessment
Table 1: Economic and Environmental Impact of GAC Implementation in Pharmaceutical Analysis
| Parameter | Traditional Methods | GAC-Implemented Methods | Percentage Improvement |
|---|---|---|---|
| Solvent Consumption | 500-1000 mL per analysis | 50-100 mL per analysis | 80-90% reduction |
| Energy Usage | 3-5 kWh per sample run | 1-2 kWh per sample run | 60-70% reduction |
| Analysis Time | 4-8 hours typical | 1-3 hours typical | 50-75% reduction |
| Waste Generation | 400-900 mL organic waste | 40-90 mL treated waste | 85-90% reduction |
| Operational Cost | $150-300 per analysis | $50-120 per analysis | 60-70% savings |
Experimental Protocols for GAC Implementation
Method Transformation Protocol: HPLC to UPLC
Objective: Transform conventional High-Performance Liquid Chromatography (HPLC) methods to Ultra-Performance Liquid Chromatography (UPLC) platforms to reduce solvent consumption and analysis time while maintaining analytical quality.
Materials and Reagents:
- UPLC System: Equipped with HSS T3 column (1.8 μm, 2.1 × 100 mm)
- Mobile Phase: Acetonitrile/water mixture versus methanol/water alternatives
- Reference Standards: Pharmaceutical compound of interest
- Sample Preparation: Required solvents for extraction
Procedure:
- Method Scouting: Evaluate the original HPLC method parameters including column type, mobile phase composition, gradient program, flow rate, and detection wavelength.
- Column Selection: Transition to smaller particle size columns (1.7-1.8 μm) to maintain resolution at higher flow rates.
- Mobile Phase Optimization: Reduce organic modifier concentration by 15-30% while maintaining separation efficiency.
- Flow Rate Adjustment: Increase flow rates proportionally to column dimension changes while monitoring backpressure limits.
- Gradient Compression: Shorten gradient times by 50-70% while preserving critical peak separations.
- Temperature Optimization: Evaluate column temperatures between 35-45°C to improve efficiency without compromising stability.
- Validation: Conduct full method validation per ICH guidelines including specificity, linearity, accuracy, precision, and robustness.
Green Metrics Assessment:
- Calculate solvent reduction volume per analysis
- Quantify energy savings from reduced run times
- Document waste minimization through smaller waste streams
Direct Analysis Protocol for Tablets
Objective: Implement direct solid analysis techniques to eliminate extensive sample preparation and solvent consumption in quality control testing of solid dosage forms.
Materials and Reagents:
- Handheld NIR/Raman Spectrometer: With appropriate spectral range and resolution
- Reference Standard: Pharmaceutical active ingredient
- Excipient Blends: Matching formulation composition
- Calibration Set: Tablets with varying API concentrations (70-130% of label claim)
Procedure:
- Instrument Calibration: Establish multivariate calibration models using reference analytical methods (e.g., HPLC) for correlation.
- Spectral Collection: Acquire spectra from multiple positions on each tablet surface to account for homogeneity variations.
- Model Development: Utilize chemometric software to develop partial least squares (PLS) regression models correlating spectral data to reference values.
- Model Validation: Test prediction accuracy against independent validation sets not used in model development.
- Routine Analysis: Implement for incoming raw material identification, blend uniformity assessment, and finished product testing.
Environmental Impact Assessment:
- Elimination of solvent consumption for sample preparation
- Reduction in energy consumption from eliminated extraction steps
- Minimization of hazardous waste generation
Research Reagent Solutions for GAC Implementation
Table 2: Essential Green Analytical Chemistry Reagents and Materials
| Reagent/Material | Function in GAC | Traditional Hazardous Alternative |
|---|---|---|
| Water-Ethanol Mixtures | Green mobile phase for chromatography | Acetonitrile or methanol mixtures |
| Hydrophilic Interaction Liquid Chromatography (HILIC) Columns | Enable high efficiency separations with aqueous mobile phases | Reverse-phase C18 columns requiring organic modifiers |
| Supercritical CO₂ | Extraction and chromatography solvent | Hexane, dichloromethane, or other halogenated solvents |
| Ionic Liquids | Green solvents for extraction and analysis | Volatile organic compounds (VOCs) |
| Biosynthesized Nanoparticles | Catalysts for green synthesis and detection | Heavy metal catalysts |
| Deep Eutectic Solvents (DES) | Biodegradable solvents for extraction | Petroleum-derived solvents |
| Solid-Phase Microextraction (SPME) Fibers | Solvent-free sample preparation | Liquid-liquid extraction |
| Chemometric Software Packages | Enable method optimization and reduce experimental runs | Trial-and-error method development |
GAC Integration in Drug Development Stages
The Stage-Gate process for drug development provides a structured framework for implementing GAC principles throughout the product lifecycle [25]. The following visualization illustrates how GAC principles integrate into each stage of pharmaceutical development:
Stage-Specific GAC Implementation
Stage 1: Scoping and Feasibility - During initial drug product definition, GAC principles focus on assessing green solvent alternatives and selecting energy-efficient instrumentation platforms [25]. Teams evaluate manufacturing feasibility with specific attention to CMC (Chemistry, Manufacturing, and Controls) risks related to environmental impact and sustainable sourcing of raw materials.
Stage 2: Preclinical Development - Analytical method development incorporates green solvent alternatives and miniaturized techniques [24]. Teams implement microsampling approaches to reduce animal usage and analytical waste while supporting toxicity studies with environmentally conscious CMC data practices.
Stage 3: Clinical Development - Scaling up manufacturing processes integrates green chemistry principles and energy-efficient technologies [25]. GAC approaches ensure clinical trial materials are produced with minimal environmental footprint while maintaining GMP compliance and product quality.
Stage 4: Regulatory Approval - The CMC regulatory package demonstrates implementation of green principles throughout development [25]. Companies highlight environmentally conscious manufacturing processes, waste reduction strategies, and sustainable analytical methods while meeting all quality assurance requirements.
Stage 5: Launch and Post-Marketing Surveillance - Continuous improvement of manufacturing processes incorporates advancing GAC technologies [25]. Environmental monitoring throughout the product lifecycle ensures ongoing compliance with evolving sustainability standards while maintaining product quality and safety.
Economic Advantages of GAC Implementation
The economic imperative for GAC adoption extends beyond regulatory compliance to substantial financial benefits throughout the drug development pipeline. Generic and biosimilar medicines, which increasingly employ GAC principles in their development, saved the U.S. healthcare system $408 billion in 2022 alone [26]. Over the past decade, these savings have exceeded $2.9 trillion, demonstrating the significant economic impact of efficient, cost-effective pharmaceutical development [26].
Cost-Benefit Analysis of GAC Implementation
Table 3: Comprehensive Economic Analysis of GAC Implementation
| Cost Category | Traditional Approach | GAC-Implemented Approach | Economic Impact |
|---|---|---|---|
| Solvent Procurement | $50,000-100,000 annually | $10,000-20,000 annually | 75-80% reduction |
| Waste Disposal | $15,000-30,000 annually | $3,000-6,000 annually | 75-80% reduction |
| Energy Consumption | $25,000-50,000 annually | $10,000-20,000 annually | 55-65% reduction |
| Analytical Throughput | 8-12 samples per day | 20-30 samples per day | 120-150% improvement |
| Regulatory Compliance | High risk of environmental citations | Minimal compliance issues | Risk mitigation |
| Capital Investment | Standard equipment | Potential premium for green tech | 10-20% higher initial cost |
The brand versus generic drug study further demonstrates the economic implications of efficient drug development approaches. Interestingly, research has shown that patients using brand-name medications demonstrated higher adherence and persistence rates for certain drug classes, though generic drugs create substantial system-wide savings [27]. This paradox highlights the need for balanced approaches that consider both economic and patient-centric outcomes.
Regulatory Landscape and Quality Considerations
The regulatory environment for pharmaceutical development continues to evolve with increasing emphasis on environmental sustainability. The Orphan Drug Act in the USA and subsequent Regulation No 141/2000 in the EU created frameworks that have increased approvals of drugs for rare diseases by 3-11 fold in the decade 2013-2023 compared to 1990-2000 [28]. These regulatory frameworks increasingly incorporate environmental considerations into the approval process.
Good Distribution Practices (GDP) compliance standards now frequently include environmental components, with companies implementing "optimum healthcare logistics efficiency with agile, flexible supply chain while ensuring complete product integrity and compliance from end-to-end" [29]. The pharmaceutical industry faces increasing pressure to demonstrate environmental responsibility throughout the product lifecycle, from raw material sourcing to end-of-life disposal.
Quality control in GAC-implemented processes must maintain the same rigorous standards as traditional methods. "Quality control and process measurements from start to finish deliver a fully auditable supply chain process essential for the business," ensuring that environmental improvements do not compromise product quality or patient safety [29].
Green Analytical Chemistry represents both an ethical obligation and economic opportunity for the pharmaceutical industry. The SIGNIFICANCE framework provides a structured approach for implementation across all stages of drug development, from initial scoping through post-marketing surveillance. The environmental benefits of reduced solvent consumption, minimized waste generation, and lower energy usage simultaneously create substantial economic advantages through reduced operational costs and enhanced efficiency.
For researchers, scientists, and drug development professionals, embracing GAC principles is no longer optional but essential for sustainable success in an increasingly environmentally conscious regulatory and market landscape. The integration of GAC methodologies represents the future of responsible pharmaceutical innovation that balances patient needs, economic realities, and planetary health.
Implementing GAC: Practical Strategies and Green Methodologies for the Lab
The adoption of Green Analytical Chemistry (GAC) principles represents a paradigm shift in analytical science, focusing on the development of methodologies that minimize environmental impact while maintaining high analytical standards [4] [3]. Sample preparation, often the most resource-intensive step in analytical procedures, has become a primary target for greening efforts. Traditional sample preparation methods frequently involve large volumes of hazardous organic solvents, significant energy consumption, and generation of substantial waste [30] [31]. In response to these environmental concerns, the field has witnessed substantial innovation centered on microextraction techniques and solvent-free approaches that align with the principles of green chemistry.
The concept of "green sample preparation" is not a separate subdiscipline but rather a guiding principle that promotes sustainable development through the adoption of environmentally benign procedures [32]. This transition is driven by both regulatory pressures and a growing recognition of environmental responsibility within the scientific community. The movement toward greener methodologies has been accelerated by the development of comprehensive assessment tools that allow researchers to evaluate and compare the environmental footprint of their analytical methods systematically [33] [34]. These developments have established a clear pathway for transforming traditional sample preparation into a more sustainable practice.
Principles and Framework of Green Sample Preparation
The SIGNIFICANCE Mnemonic in GAC
The SIGNIFICANCE mnemonic provides a practical framework for implementing Green Analytical Chemistry principles, with direct applications to sample preparation. This framework emphasizes Safety, Inexpensiveness, and Minimal environmental impact as core objectives. Within this structure, microextraction and solvent-free techniques directly address these goals by reducing or eliminating hazardous solvents, decreasing waste generation, and improving operator safety [35] [32].
The principles of green sample preparation specifically advocate for the use of safe solvents/reagents and renewable materials, minimizing waste generation and energy demand, and enabling high sample throughput through miniaturization and automation [32]. These principles align with the broader SIGNIFICANCE framework by promoting methods that are not only environmentally responsible but also economically viable and practically efficient. The integration of these concepts provides a comprehensive approach for developing analytical methods that meet modern sustainability requirements without compromising analytical performance.
Green Metrics and Assessment Tools
The evolution of greenness assessment tools has been crucial for objectively evaluating and comparing the environmental impact of analytical methods. Early tools like the National Environmental Methods Index (NEMI) employed a simple pictogram system but lacked granularity for distinguishing between degrees of greenness [34]. The field has since progressed to more sophisticated metrics that provide comprehensive evaluations of analytical workflows.
Table 1: Greenness Assessment Tools for Analytical Methods
| Assessment Tool | Type of Output | Key Features | Limitations |
|---|---|---|---|
| NEMI [34] | Binary pictogram | Simple, user-friendly; assesses toxicity, waste, corrosiveness | Lacks granularity; doesn't cover full analytical workflow |
| Analytical Eco-Scale [34] | Numerical score (0-100) | Applies penalty points to non-green attributes; allows method comparison | Relies on expert judgment; lacks visual component |
| GAPI [34] | Color-coded pictogram | Covers entire analytical process; visual identification of high-impact stages | No overall score; somewhat subjective color assignments |
| AGREE [34] | Numerical score (0-1) + pictogram | Based on 12 GAC principles; comprehensive coverage; user-friendly interface | Doesn't fully account for pre-analytical processes |
| AGREEprep [34] | Numerical score + pictogram | First tool dedicated to sample preparation; visual and quantitative outputs | Must be used with broader tools for full method evaluation |
| AGSA [34] | Star-shaped diagram + score | Intuitive visualization; integrates multiple green criteria | Newer tool with less established track record |
These assessment tools have become indispensable for researchers seeking to validate and improve the environmental profile of their methods. For instance, in a case study evaluating a sugaring-out liquid-liquid microextraction (SULLME) method, multiple metrics (MoGAPI, AGREE, AGREEprep, AGSA) provided complementary insights, highlighting strengths in miniaturization while identifying weaknesses in waste management and reagent safety [34]. This multidimensional evaluation approach enables a more comprehensive understanding of a method's sustainability.
Microextraction Techniques
Solid-Phase Microextraction (SPME)
Solid-phase microextraction (SPME), introduced in the early 1990s, represents a cornerstone of green sample preparation, integrating sampling, extraction, and analyte pre-concentration into a single step [36] [35]. This technique utilizes a fused silica fiber coated with a thin layer of extracting phase, which can be exposed directly to the sample (Direct Immersion, DI-SPME) or to the headspace above the sample (Headspace, HS-SPME) [35]. A significant advantage of SPME is its solventless nature, which eliminates the need for hazardous organic solvents and reduces waste generation. The method also enables miniaturization and automation, further enhancing its green credentials while reducing labor costs and increasing throughput [35].
The development of advanced coating materials has substantially expanded SPME's applications and performance. Traditional coatings including polydimethylsiloxane (PDMS), polydimethylsiloxane/divinylbenzene (PDMS/DVB), and divinylbenzene/carboxen/polydimethylsiloxane (DVB/CAR/PDMS) have been widely used but are primarily limited to non-polar or moderately polar analytes [35]. Recent innovations have focused on ionic liquid-based coatings, which offer enhanced thermal stability and tunable selectivity, and molecularly imprinted polymers (MIPs), which provide superior molecular recognition for specific target analytes [35]. Carbon-based nanomaterials like graphene and carbon nanotubes have also emerged as effective coating materials due to their high surface area and exceptional mechanical and chemical stability [35].
SPME Technique Overview
Despite its advantages, SPME faces challenges related to fiber fragility and limited commercial availability of specialized coatings [35]. The finite lifetime of fibers and potential batch-to-batch variations can also affect reproducibility. Nevertheless, ongoing research continues to address these limitations through the development of more robust fiber assemblies and novel coating materials with enhanced selectivity and stability.
Other Microextraction Techniques
Beyond SPME, several other microextraction techniques have been developed that align with green chemistry principles:
Stir Bar Sorptive Extraction (SBSE) utilizes a magnetic stir bar coated with an extraction phase, typically polydimethylsiloxane (PDMS), providing greater surface area and higher extraction capacity compared to SPME fibers [35]. This technique is particularly valuable for extracting analytes from complex matrices, though the limited range of commercially available coatings can restrict its application scope.
Microextraction by Packed Sorbent (MEPS) represents a miniaturization of conventional solid-phase extraction, with the sorbent bed integrated directly into a syringe barrel [35]. This configuration allows for significantly reduced solvent consumption (as low as 10-50 µL per extraction) and enables direct injection of the extracted analytes into chromatographic systems. MEPS also facilitates automation and high-throughput analysis, making it particularly suitable for clinical and pharmaceutical applications where numerous samples require processing.
Fabric Phase Sorptive Extraction (FPSE) combines the advantages of membrane extraction and solid-phase extraction by utilizing a flexible fabric substrate coated with a sol-gel derived sorbent material [35]. This unique configuration provides high primary contact surface area, rapid extraction kinetics, and exceptional stability across wide pH ranges. FPSE membranes can be reused multiple times, enhancing their sustainability profile.
Table 2: Comparison of Microextraction Techniques
| Technique | Solvent Consumption | Sample Volume | Key Advantages | Common Applications |
|---|---|---|---|---|
| SPME [36] [35] | Solventless | 1-10 mL | Simple operation; easy automation; commercial availability | Environmental monitoring; food analysis; bioanalysis |
| SBSE [35] | < 1 mL | 10-100 mL | High extraction capacity; good sensitivity | Fragrance analysis; pesticide residues in water |
| MEPS [35] | 10-50 µL | 100-1000 µL | Easy integration with LC systems; suitable for small samples | Drug monitoring in plasma/urine; bioanalysis |
| FPSE [35] | < 1 mL | 5-20 mL | High chemical stability; fast extraction; reusable | Pharmaceutical analysis; environmental water samples |
| DLLME [36] | < 100 µL | 1-10 mL | Very high enrichment factors; rapid operation | Preconcentration of organic compounds from water |
Solvent-Free Approaches and Green Solvents
Solvent-Free Microextraction Techniques
Several advanced microextraction techniques operate entirely without solvents, representing the pinnacle of green sample preparation:
In-Tube Extraction Dynamic Headspace (ITEX-DHS) is a fully automated system that combines headspace sampling with thermal desorption directly into a gas chromatograph [35]. This technique utilizes a packed sorbent trap for repeated extraction and concentration of volatile compounds from the sample headspace, entirely eliminating solvent consumption. The automation of ITEX-DHS minimizes operator exposure to hazardous samples and improves reproducibility.
PAL SPME Arrow represents an evolution of traditional SPME, featuring a larger sorbent volume and more robust mechanical design [35]. This system provides enhanced sensitivity and better durability while maintaining the solvent-free principle of conventional SPME. The arrow-shaped design facilitates better penetration through septa and improves overall handling during the extraction process.
Green Solvents in Sample Preparation
When solvent use is unavoidable, the principles of green sample preparation advocate for switching to safer, more sustainable alternatives. Ideal green solvents exhibit low toxicity, high biodegradability, minimal volatility, and reduced flammability while maintaining compatibility with analytical techniques [31]. These solvents should ideally be derived from renewable feedstocks through energy-efficient manufacturing processes to ensure genuine sustainability across their entire lifecycle.
Table 3: Classification and Properties of Green Solvents
| Solvent Category | Examples | Key Properties | Environmental Considerations |
|---|---|---|---|
| Bio-based Solvents [31] | Bio-ethanol, ethyl lactate, D-limonene | Renewable feedstocks; generally biodegradable | Production may compete with food sources; land use considerations |
| Ionic Liquids (ILs) [31] | Imidazolium, pyridinium, phosphonium salts | Negligible vapor pressure; tunable properties; thermal stability | Complex synthesis; potential toxicity; environmental persistence |
| Deep Eutectic Solvents (DES) [31] | Choline chloride + urea; Menthol + fatty acids | Biodegradable; low toxicity; simple preparation | High viscosity may limit applications; limited commercial availability |
| Supercritical Fluids [31] | CO₂, CO₂ with ethanol modifier | Tunable solvation power; non-toxic; easy separation | High energy demand for pressurization; expensive equipment |
| Subcritical Water [31] | Water at 100-374°C | Non-toxic; non-flammable; readily available | Energy-intensive; may degrade thermally labile compounds |
The selection of an appropriate green solvent requires careful consideration of the specific application and a holistic evaluation of environmental impact across the entire analytical process. For instance, while supercritical CO₂ offers excellent green credentials in the use phase, its high energy requirements for pressurization must be considered in overall sustainability assessments [31]. Similarly, the environmental benefits of ionic liquids must be weighed against potential toxicity and complex synthesis pathways.
Experimental Protocols and Methodologies
HS-SPME Protocol for VOC Analysis
A detailed protocol for analyzing biogenic volatile organic compounds (BVOCs) from plant material using Headspace Solid-Phase Microextraction demonstrates the practical implementation of green sample preparation principles [37]:
Sample Preparation: Collect plant material (e.g., leaves) and immediately freeze in liquid nitrogen. Precisely weigh 0.20 g of homogenized sample into a 10 mL headspace vial. This minimal sample size reflects the miniaturization principle of green chemistry.
HS-SPME Extraction: Condition a DVB/CAR/PDMS fiber according to manufacturer specifications. Incubate the sample vial at 40°C for 5 minutes with agitation. Expose the fiber to the sample headspace for 30 minutes at the same temperature. This solvent-free approach eliminates hazardous waste generation.
GC-MS Analysis: Desorb the fiber in the GC injection port at 250°C for 5 minutes in splitless mode. Use a temperature-programmed separation with a 30 m × 0.25 mm ID × 0.25 μm film thickness mid-polarity column. Perform detection with a quadrupole time-of-flight mass spectrometer operating in electron impact ionization mode.
This method achieved excellent greenness scores when evaluated with AGREE, AGREEprep, and ComplexGAPI metrics, demonstrating its alignment with GAC principles [37]. The main environmental trade-off was the relatively high energy consumption of the GC-QTOF-MS system, highlighting how even green sample preparation must sometimes balance analytical performance with sustainability goals.
Method Optimization and Validation
Successful implementation of green sample preparation methods requires systematic optimization and validation:
Fiber Selection: Choosing the appropriate SPME fiber coating is critical for method performance. PDMS fibers are suitable for non-polar compounds, while PDMS/DVB and CAR/PDMS provide better extraction for volatile and polar compounds respectively [35] [37]. The chemical properties of target analytes should guide this selection.
Extraction Kinetics: Key parameters including extraction time, temperature, and sample agitation must be optimized to achieve equilibrium conditions while maintaining reasonable analysis time. Experimental design approaches such as Response Surface Methodology can efficiently identify optimal conditions.
Greenness Assessment: Apply multiple assessment tools (e.g., AGREE, GAPI, AGREEprep) to evaluate the environmental profile of the developed method [34] [37]. These tools help identify aspects with the highest environmental impact and guide further improvements.
Method Development Workflow
The Scientist's Toolkit: Research Reagent Solutions
Table 4: Essential Materials for Green Sample Preparation
| Material/Reagent | Function | Green Attributes | Application Notes |
|---|---|---|---|
| DVB/CAR/PDMS Fiber [37] | SPME coating for VOC extraction | Solventless; reusable | Ideal for broad-spectrum VOC analysis; stable to 270°C |
| IL-based SPME Coatings [35] | Tunable extraction phases | Low volatility; high thermal stability | Customizable for specific analyte classes |
| Molecularly Imprinted Polymers [35] | Selective sorbents for target analytes | High specificity reduces need for cleanups | Excellent for complex matrices; template-dependent |
| Bio-based Solvents [31] | Replacement for petroleum solvents | Renewable feedstocks; biodegradable | Ethyl lactate particularly versatile for extractions |
| Deep Eutectic Solvents [31] | Green extraction media | Low toxicity; biodegradable; inexpensive | Tunable polarity; can extract both polar and non-polar compounds |
| Supercritical CO₂ [31] | Non-polar extraction medium | Non-toxic; non-flammable; easily removed | Excellent for non-polar analytes; requires specialized equipment |
Microextraction and solvent-free techniques represent the forefront of green sample preparation, offering viable pathways to significantly reduce the environmental impact of analytical methodologies. These approaches successfully address multiple principles of Green Analytical Chemistry through miniaturization, solvent reduction or elimination, automation, and waste minimization. The ongoing development of novel sorbent materials and the refinement of existing techniques continue to expand the application range and improve the performance of these green methods.
The successful implementation of green sample preparation requires a balanced consideration of analytical performance, practical feasibility, and environmental impact. The availability of comprehensive assessment tools enables researchers to make informed decisions and systematically improve the sustainability of their methods. As the field continues to evolve, emerging technologies including artificial intelligence and digital transformation offer promising opportunities for further optimizing green analytical workflows [3]. Through continued innovation and adoption of these principles, the analytical chemistry community can make significant contributions to global sustainability goals while maintaining the high-quality data necessary for scientific advancement and regulatory compliance.
The transition toward sustainable solvents represents a critical paradigm shift within chemical research and industrial processes, particularly in pharmaceuticals and drug development. This shift is driven by the urgent need to mitigate the environmental and health impacts associated with traditional organic solvents, which are often volatile, toxic, and derived from non-renewable petrochemical sources. Framed within the broader context of Green Analytical Chemistry (GAC) and the SIGNIFICANCE mnemonic principles, solvent selection becomes a strategic tool for advancing sustainability. The GAC principles, designed specifically to address the unique challenges of analytical chemistry, provide a robust framework for evaluating and adopting greener laboratory practices, emphasizing the reduction of hazardous waste, enhanced safety, and improved energy efficiency [21] [7].
The adoption of green solvents is not merely an ecological consideration but a comprehensive approach that aligns with economic and operational benefits. These alternatives, including water, ionic liquids, and bio-based solvents, offer advantages such as reduced toxicity, biodegradability, and renewable sourcing [38] [31]. For researchers and drug development professionals, this transition supports compliance with increasingly stringent environmental regulations while fostering innovation in synthetic and analytical methodologies. This guide provides a technical overview of key sustainable solvent classes, detailed experimental protocols, and a practical framework for integration into modern laboratories, all underpinned by the foundational principles of GAC.
Green Analytical Chemistry (GAC) and the SIGNIFICANCE Framework
Green Analytical Chemistry (GAC) has emerged as a specialized discipline focused on minimizing the environmental and health impacts of analytical procedures. Its core objectives are reducing hazardous chemical use, minimizing energy consumption, and decreasing waste generation without compromising the quality and reliability of analytical results [7]. To provide clear, actionable guidelines, the 12 principles of GAC were formulated, which can be summarized by the mnemonic SIGNIFICANCE [21]:
- S - Select direct analytical techniques to avoid sample treatment.
- I - Integrate analytical processes and operations.
- G - Generate minimal waste and manage it properly.
- N - Never use toxic or hazardous reagents.
- I - Implement automated and miniaturized methods.
- F - Favor methods with high sample throughput.
- I - In-situ measurements should be developed and applied.
- C - Consume minimal energy.
- A - Avoid derivatization.
- N - Note that the safety of the operator is paramount.
- C - Carry out simultaneous analyses and multi-analyte determinations.
- E - Eliminate or reduce sample size and number of samples.
These principles directly inform solvent selection. For instance, principles urging the avoidance of toxic reagents (N) and minimal waste generation (G) prioritize solvents with low toxicity and high biodegradability. Similarly, the push for integration (I) and miniaturization (I) favors solvents compatible with automated, high-throughput systems. The SIGNIFICANCE framework thus serves as an essential checklist for researchers evaluating the greenness of their solvent choices and overall analytical methods [21] [7].
Comparative Analysis of Sustainable Solvent Classes
A thorough evaluation of sustainable solvents requires a multi-faceted comparison of their properties, applications, and sustainability profiles. The following tables provide a structured overview of three key solvent classes.
Table 1: Properties and Applications of Sustainable Solvent Classes
| Solvent Class | Key Examples | Core Properties & Advantages | Common Applications & Workflows | Key Limitations & Considerations |
|---|---|---|---|---|
| Ionic Liquids | Imidazolium, Pyrrolidinium, Cholinium salts [39] [31] | Negligible vapor pressure [31], High thermal stability [39], Tunable physicochemical properties [31], Non-flammable [38] | Electrolytes in Li-ion batteries [40] [39], Catalysis & chemical synthesis [40] [38], Biomass processing [31], Water purification [41] | High production cost [39], Variable & sometimes high toxicity [31] [41], High viscosity [41], Resource-intensive production [31] |
| Bio-Based Solvents | Bio-alcohols (ethanol), Lactate esters (ethyl lactate), d-Limonene, Cyrene [42] [38] [43] | Derived from renewable biomass [38] [43], Lower VOC emissions [38], Often biodegradable [38], Low toxicity (varies) [42] | Paints & coatings [42] [43], Cleaning agents [42], Extraction of natural compounds [42], Printed electronics [42] | Can compete with food sources (1st gen) [31], Performance variability, Flammability (e.g., 2-MeTHF) [42], Higher cost vs. conventional [43] |
| Water | - | Non-toxic, non-flammable [38], Readily available & inexpensive [38], Can be tuned via temperature/pH [31] | Extraction (Subcritical water) [31], Reaction medium [38], Cleaning & formulations [38] | Limited solubility for non-polar compounds [31], High energy use for purification, Corrosive at sub/supercritical conditions [31] |
Table 2: Sustainability and Economic Profile Comparison
| Solvent Class | Environmental & Safety Impact | Scalability & Market Trends | Greenness Metrics (e.g., AGREE Score Range)* | Life-Cycle Assessment (LCA) Considerations |
|---|---|---|---|---|
| Ionic Liquids | Low air pollution (non-volatile) [31], Aquatic toxicity a concern [31] [41], Operator safety high (non-flammable) [38] | Market CAGR: 8.32% (2025-2034) [40], Scaling in high-value sectors (EV batteries) [39], Cost: >USD 500/kg [39] | Moderate to High (Highly dependent on cation/anion choice; Cholinium-based score higher) [31] [7] | Energy-intensive synthesis [31], Potential for recycling & reuse [39], Long-term environmental fate is complex [41] |
| Bio-Based Solvents | Reduced carbon footprint [43], Biodegradability is a key advantage [38], Toxicity varies (e.g., d-Limonene low; 2-MeTHF flammable) [42] | Market Volume: ~1.3M tons (2024) to ~2.6M tons (2034) [43], Strong growth in paints & coatings [42] [43] | Moderate to High (e.g., Ethyl lactate, bio-ethanol score highly) [7] | Feedstock sourcing (sugar vs. waste biomass) [31], Agricultural impacts, End-of-life disposal is favorable [38] |
| Water | Minimal environmental impact [38], No hazardous disposal [38], Highest operator safety [38] | Universally available, Energy cost for purification is main barrier [31] | High (for applications where it is effective) [7] | Impact tied to energy consumption for heating/purification [31], No end-of-life treatment needed [38] |
*Greenness metrics (e.g., AGREE, AGP) provide semi-quantitative scores based on multiple factors like toxicity, energy use, and waste [7]. The scores above are generalized estimates.
Detailed Methodologies and Experimental Protocols
Experimental Protocol: Liquid-Liquid Extraction of Organic Pollutants using Ionic Liquids
This protocol details the use of imidazolium-based ionic liquids for the efficient extraction of phenolic compounds from simulated wastewater, adaptable for pharmaceutical impurity purification [41].
1. Primary Materials and Reagents
- Ionic Liquid: 1-Butyl-3-methylimidazolium hexafluorophosphate ([BMIM][PF₆]).
- Analytes: Standard solution of phenol and 2-chlorophenol in deionized water (50 mg/L each).
- Other Reagents: Methanol (HPLC grade) for dilution.
- Equipment: HPLC system with UV detector, separatory funnel (250 mL), mechanical shaker, analytical balance, and micro-syringes.
2. Step-by-Step Procedure
- Aqueous Phase Preparation: Pipette 100 mL of the analyte standard solution into a clean separatory funnel.
- IL Addition: Precisely weigh 1.0 g of [BMIM][PF₆] and add it to the separatory funnel using a disposable Pasteur pipette.
- Equilibration: Secure the stopper and shake the mixture vigorously for 15 minutes using a mechanical shaker to ensure thorough phase contact.
- Phase Separation: Allow the mixture to stand for 30 minutes for complete phase separation. The denser [BMIM][PF₆] phase will form the lower layer.
- IL Phase Recovery: Carefully drain the lower ionic liquid layer into a 2 mL vial.
- Analysis: Dilute a 50 µL aliquot of the recovered IL with 950 µL of methanol to reduce viscosity. Analyze the methanolic solution via HPLC-UV to determine the concentration of extracted phenolics.
- Calculation: Calculate the extraction efficiency (%) based on the difference between initial and final analyte concentrations in the aqueous phase.
3. Data Interpretation and Optimization
- Expected extraction efficiencies >90% for phenolic compounds are typical [41].
- Optimization: Key parameters to optimize using design-of-experiment (DoE) approaches include pH of the aqueous phase, volume/weight ratio of IL to aqueous phase, and extraction time [41].
- Safety Note: While non-flammable, some ILs may have associated toxicity; wear appropriate gloves and eye protection.
Experimental Protocol: Bio-Based Solvent Extraction of Natural Products
This method utilizes ethyl lactate, a bio-based solvent derived from lactic acid, for the extraction of antioxidants from winery waste, demonstrating circular economy principles [42].
1. Primary Materials and Reagents
- Bio-Based Solvent: Ethyl lactate.
- Sample: Dried and ground grape pomace (winery waste).
- Other Reagents: Standard Gallic acid for calibration, Folin-Ciocalteu reagent.
- Equipment: Soxhlet extractor or pressurized liquid extraction (PLE) system, rotary evaporator, vacuum oven, UV-Vis spectrophotometer.
2. Step-by-Step Procedure
- Sample Preparation: Weigh 10.0 g of dried grape pomace and load it into the extraction thimble.
- Extraction:
- Soxhlet Method: Assemble the Soxhlet apparatus with 150 mL of ethyl lactate. Conduct extraction for 6 hours, ensuring 20-30 siphon cycles.
- PLE Method: Load the sample into a PLE cell. Set conditions: 100°C, 100 bar, 15 min static time, with ethyl lactate as solvent.
- Solvent Removal: Combine the extract and remove the ethyl lactate under reduced pressure using a rotary evaporator (bath temperature ≤ 50°C).
- Product Isolation: Weigh the resulting crude extract and determine the yield.
- Analysis: Re-dissolve the extract in a known volume of ethanol. Determine the total phenolic content (TPC) via the Folin-Ciocalteu assay, measuring absorbance at 765 nm and comparing to a gallic acid standard curve.
3. Data Interpretation and Optimization
- Report extraction yield (%) and TPC (mg GAE/g extract).
- Ethyl lactate is expected to show high extraction efficiency for medium-polarity compounds like polyphenols, comparable to or better than conventional solvents like ethanol or acetone [42].
- Optimization: Parameters such as solvent-to-feed ratio, extraction temperature, and time should be optimized for maximum yield and bioactivity.
Essential Research Reagent Solutions
Table 3: Key Research Reagents for Sustainable Solvent Applications
| Reagent / Material | Primary Function & Mechanism | Example Application in Context |
|---|---|---|
| Cholinium-based Ionic Liquids (e.g., Choline Chloride) | Hydrogen bond acceptor in Deep Eutectic Solvents (DES); low toxicity and biodegradable profile [31]. | Synthesis of low-cost, biodegradable DES for lignin extraction from biomass [42] [31]. |
| Cyrene (Dihydrolevoglucosenone) | Dipolar aprotic bio-based solvent derived from cellulose; alternative to toxic DMF or NMP [42]. | Solvent for formulating conductive graphene inks in printed electronics [42]. |
| 2-MeTHF (2-Methyltetrahydrofuran) | Bio-based solvent (from corn cob); good solvating power for non-polar compounds; replaces THF and hexane [42]. | Extraction medium for bioactive compounds (e.g., phenolics) from plant materials [42]. |
| Supercritical CO₂ (scCO₂) | Non-toxic, non-flammable solvent with tunable density and solvating power; easily removed by depressurization [38] [31]. | Decaffeination of coffee; extraction of essential oils and fragrances in pharmaceuticals [38]. |
| Ethyl Lactate | Ester of lactic acid; excellent biodegradability and low toxicity; high solvating power for many resins and oils [38]. | Solvent for cleaning agents, coatings, and extraction of natural products [38]. |
Implementation and Integration in the Laboratory
A Framework for Solvent Substitution
Transitioning to sustainable solvents requires a systematic approach. The following diagram outlines a decision-making workflow grounded in the SIGNIFICANCE principles, guiding researchers from initial assessment to final implementation.
Navigating Challenges and Future Directions
Despite their promise, sustainable solvents face challenges that require active research and development:
- Cost and Scalability: Ionic liquids remain expensive for bulk applications, though their market is growing at a CAGR of 8.32% [40]. Bio-based solvents are also generally more costly than petroleum-based ones [43]. Future efforts are focused on process intensification and leveraging waste biomass to reduce costs [39] [43].
- Toxicity and Environmental Impact: Not all "green" solvents are inherently benign. Some ionic liquids exhibit moderate to high toxicity and persistence [31] [41]. Comprehensive life-cycle assessments (LCA) and tools like the AGREE metric are crucial for a holistic evaluation [7]. Future research is directed toward designing "greener-by-design" ionic liquids (e.g., derived from natural metabolites) and improving the eco-toxicity databases for all solvent classes [39] [41].
- Performance and Compatibility: A one-size-fits-all solvent does not exist. Water is ineffective for non-polar systems, and the high viscosity of ionic liquids can complicate handling [31] [41]. Ongoing research explores solvent mixtures, hybrid systems, and task-specific molecular design to overcome these limitations [42] [39].
The strategic selection of sustainable solvents—water, ionic liquids, and bio-based alternatives—is fundamental to advancing green chemistry in research and industrial domains, particularly in drug development. By adhering to the GAC principles encapsulated in the SIGNIFICANCE mnemonic, scientists can make informed decisions that significantly reduce the environmental footprint of their analytical and synthetic processes. While challenges related to cost, scalability, and comprehensive environmental profiling persist, the trajectory is clear. Continued innovation, supported by robust green metrics and life-cycle thinking, is paving the way for these solvents to become the new standard, ultimately contributing to a more sustainable and responsible scientific future.
The global shift towards sustainable industrial practices has spurred the development of green extraction technologies to replace conventional methods, which are often inefficient and environmentally burdensome [44]. Within the framework of Green Analytical Chemistry (GAC), the SIGNIFICANCE mnemonic provides a structured approach to implementing sustainable practices, emphasizing aspects such as safety, energy efficiency, and waste reduction [45] [7]. Microwave-assisted extraction (MAE) and ultrasound-assisted extraction (UAE) stand out as promising alternatives that align with these principles by leveraging novel physical mechanisms to achieve rapid, efficient, and selective recovery of natural compounds and bioactive components [44] [46]. These techniques have demonstrated clear superiority over traditional methods in terms of reduced extraction time, solvent consumption, and energy requirements while achieving higher yields and preserving compound bioactivity [44] [47].
The pharmaceutical and nutraceutical industries, in particular, have embraced these technologies to overcome bottlenecks in drug discovery and development [48]. Microwave-assisted organic synthesis (MAOS) has become recognized as a valuable tool for accelerating synthetic routes, while UAE has gained prominence for extracting thermolabile bioactive compounds without degradation [47] [48]. This technical guide provides an in-depth examination of both technologies, focusing on their fundamental principles, energy-efficient instrumentation, optimization parameters, and applications within the framework of green chemistry principles.
Fundamental Principles and Mechanisms
Microwave-Assisted Extraction (MAE) Technology
Theoretical Foundations of Microwave Heating
Microwave energy encompasses electromagnetic radiation in the frequency range of 0.3 to 300 GHz, with most scientific and medical applications utilizing 2450 MHz [49]. At this frequency, microwaves have a wavelength of approximately 12.25 cm and possess photon energies of approximately 0.037 kcal/mole—far too low to cleave molecular bonds (which typically require 80-120 kcal/mole) [50] [49]. Thus, microwave effects are primarily thermal rather than chemical, influencing reaction kinetics through rapid, efficient heating rather than through direct molecular activation.
The heating mechanism in MAE fundamentally differs from conventional conductive heating. Traditional heating relies on transferring thermal energy from an external source through the vessel walls into the reaction mixture, creating a temperature gradient where the vessel surface is hotter than the solution interior [50]. In contrast, microwave energy delivers heat volumetrically through two primary mechanisms: dipole rotation and ionic conduction [50] [49].
Dielectric Heating Mechanisms: Dipole rotation occurs when polar molecules attempt to align themselves with the rapidly oscillating electric field (2.45 billion times per second). This molecular rotation generates friction and heat through the entire volume of the material simultaneously. Ionic conduction involves the accelerated movement of dissolved ions under the influence of the electric field, which collides with neighboring molecules to generate thermal energy [50]. The efficiency of these heating mechanisms depends on the dielectric properties of the materials, quantified by the loss tangent (tan δ) [50].
Table 1: Dielectric Properties (tan δ) of Common Solvents in Microwave Applications
| Solvent Classification | Solvent | tan δ | Heating Efficiency |
|---|---|---|---|
| High (tan δ > 0.5) | Ethylene Glycol | 1.350 | Excellent |
| Ethanol | 0.941 | Excellent | |
| DMSO | 0.825 | Excellent | |
| Methanol | 0.659 | Excellent | |
| Medium (tan δ 0.1-0.5) | Water | 0.123 | Moderate |
| Dichloroethane | 0.127 | Moderate | |
| Chlorobenzene | 0.101 | Moderate | |
| Low (tan δ < 0.1) | Chloroform | 0.091 | Poor |
| Acetonitrile | 0.062 | Poor | |
| Hexane | 0.020 | Very Poor |
Reaction Rate Enhancement
The dramatic rate accelerations observed in microwave-assisted reactions follow the Arrhenius equation (k = Ae^(-Ea/RT)), where the rate constant (k) increases exponentially with temperature [50] [49]. Microwave irradiation enhances reaction rates through rapid superheating, which provides the energy to overcome activation barriers more efficiently than conventional heating. According to Arrhenius kinetics, an increase of just 17°C above a bulk temperature of 150°C can produce a 10-fold rate enhancement, while a 35°C increase yields a 100-fold improvement, and a 56°C increase achieves a 1000-fold enhancement [49].
The exceptional heating efficiency of microwaves stems from their rapid energy transfer (10^(-9) seconds per cycle) compared to molecular relaxation times (approximately 10^(-5) seconds) [49]. This creates a non-equilibrium condition with high instantaneous temperatures that significantly enhance reaction kinetics. Additionally, microwave-specific effects may influence reactions with resonance-stabilized intermediates that have lifetimes longer than 10^(-9) seconds, as these polar species can couple directly with microwave energy [49].
Ultrasound-Assisted Extraction (UAE) Technology
Principles of Acoustic Cavitation
Ultrasound-assisted extraction utilizes high-frequency sound waves (typically 20-100 kHz) beyond the range of human hearing to enhance extraction efficiency [46] [47]. The fundamental mechanism underlying UAE is acoustic cavitation, a complex physical process involving the formation, growth, and implosive collapse of microscopic bubbles in a liquid medium subjected to ultrasonic waves [47].
Ultrasound waves consist of alternating compression (high-pressure) and rarefaction (low-pressure) cycles. During rarefaction cycles, the negative pressure can overcome intermolecular forces in the liquid, creating microscopic vapor-filled cavities [47]. These bubbles undergo continuous expansion and compression over several acoustic cycles. When bubbles reach an unstable size, they implode violently, generating extreme local conditions with temperatures exceeding 5000 K and pressures surpassing 1000 atmospheres [47].
Cavitation Effects: The implosion of cavitation bubbles produces several physical effects that enhance extraction efficiency:
- Microjetting: Asymmetric bubble collapse near solid surfaces (such as plant tissues) generates high-speed liquid jets that erode and fragment the material.
- Shockwaves: The implosive collapse produces powerful shockwaves that disrupt cellular structures.
- Microturbulence: Intense fluid mixing enhances mass transfer between the solid matrix and extraction solvent.
- Cell Disruption: The mechanical forces damage cell walls and membranes, facilitating the release of intracellular compounds [47].
The efficiency of acoustic cavitation depends on multiple factors, including ultrasound frequency, intensity, solvent properties, and temperature. Lower frequencies (20-100 kHz) typically produce larger cavitation bubbles with more violent collapses, enhancing mechanical effects, while higher frequencies (200-500 kHz) promote chemical effects through free radical generation [47].
UAE Instrumentation and Operational Modes
UAE systems primarily utilize two types of equipment: ultrasonic baths and ultrasonic probe systems [47]. Ultrasonic baths provide indirect sonication through a water medium, offering more uniform energy distribution but lower intensity. Probe systems deliver ultrasound directly into the sample via a titanium horn, creating intense cavitation in a localized zone but potentially causing uneven treatment [47].
Modern UAE instrumentation can operate in either continuous or pulsed modes. Continuous sonication applies ultrasound energy uninterrupted throughout the extraction process, while pulsed mode alternates between brief sonication periods (e.g., 1 second) and rest intervals (e.g., 2 seconds) [51]. Research demonstrates that pulsed UAE can reduce energy consumption by 20-51% while maintaining or even improving extraction efficiency for heat-sensitive compounds [51].
Table 2: Comparison of Continuous vs. Pulsed Ultrasound Modes for Bioactive Compound Extraction
| Parameter | Continuous UAE | Pulsed UAE | Significance |
|---|---|---|---|
| Energy Consumption | 190 kJ (reference value) | 80 kJ (reference value) | ~58% reduction in pulsed mode [51] |
| Extraction Efficiency | High | Slightly higher for some compounds | Pulse mode may improve yield [51] |
| Thermal Impact | Significant heating | Reduced heating | Pulse mode better for thermolabile compounds [51] |
| Unit Energy Consumption | Reference value | 40-68% lower | Much higher efficiency in pulsed mode [51] |
| Equipment Stress | Continuous operation | Intermittent operation | Extended equipment lifetime in pulsed mode |
Energy Efficiency and Optimization Strategies
MAE Optimization Parameters
Optimizing microwave-assisted processes requires careful consideration of several interdependent parameters to maximize efficiency while minimizing energy consumption and environmental impact [44]. Key optimization parameters include:
Microwave Power and Temperature: Appropriate power settings are crucial for efficient extraction. Excessive power can cause thermal degradation of target compounds, while insufficient power prolongs extraction time. Temperature control is equally important, as closed-vessel systems enable superheating of solvents well above their atmospheric boiling points, significantly accelerating extraction kinetics [50].
Extraction Time: MAE typically reduces extraction times from hours to minutes. For example, a reaction requiring 8 hours at 80°C under conventional heating can be completed in just 2 minutes at 160°C using microwave irradiation [50]. This dramatic time reduction directly translates to substantial energy savings.
Solvent Selection: The dielectric properties of solvents significantly impact MAE efficiency. Solvents with high tan δ values (e.g., ethanol, methanol, DMSO) strongly absorb microwave energy and heat rapidly, while non-polar solvents (e.g., hexane, toluene) are nearly microwave-transparent [50]. Solvent mixtures can be optimized to achieve balanced heating characteristics.
Solid-to-Liquid Ratio: Proper ratio optimization ensures efficient mass transfer while minimizing solvent consumption, aligning with green chemistry principles [44].
Recent advances in MAE optimization include the integration of artificial intelligence and machine learning for process prediction and control, as well as synergistic combinations with other green technologies such as ultrasound and novel solvent systems [44].
UAE Optimization Parameters
Ultrasonic-assisted extraction efficiency depends on several controllable parameters that influence cavitation intensity and mass transfer rates [46] [47]:
Ultrasonic Frequency and Intensity: Lower frequencies (20-100 kHz) enhance mechanical effects through more violent cavitation, ideal for disrupting tough plant matrices. Higher frequencies promote chemical effects but with less mechanical disruption [47]. Intensity directly affects cavitation bubble dynamics and implosion energy.
Sonication Time and Mode: Optimal duration balances extraction efficiency against potential degradation of thermolabile compounds. Pulsed operation modes significantly reduce energy consumption while maintaining extraction yields [51].
Temperature Control: Elevated temperatures improve extraction efficiency but may degrade sensitive compounds. The cooling systems help maintain optimal temperature ranges during prolonged sonication [47].
Solvent Properties and Solid-to-Liquid Ratio: Solvent viscosity, surface tension, and vapor pressure influence cavitation efficiency. Lower viscosity and surface tension facilitate bubble formation and implosion. Proper solid-to-liquid ratios ensure efficient mass transfer [46].
Synergistic Approaches and Combined Technologies
The integration of multiple extraction technologies often creates synergistic effects that enhance overall efficiency and sustainability. Recent research has explored various combinations:
MAE-UAE Hybrid Systems: Sequential or simultaneous application of microwave and ultrasound energy can leverage the advantages of both technologies. Microwaves provide rapid volumetric heating, while ultrasound enhances mass transfer through cavitation-induced cell disruption [44] [46].
MAE with Novel Solvents: Combining microwave heating with green solvents such as deep eutectic solvents (DES) and ionic liquids improves sustainability while maintaining high extraction efficiency [44].
UAE with Pressurized Liquids: Ultrasound-assisted pressurized liquid extraction (UA-PLE) combines the cell-disruption capabilities of ultrasound with the enhanced solubility and mass transfer of pressurized systems [47].
UAE with Supercritical Fluids: Ultrasound-enhanced supercritical fluid extraction (UA-SFE) improves the efficiency of supercritical CO₂ extraction by enhancing mass transfer and reducing extraction time [47].
Analytical Method Greenness Assessment
The environmental impact of analytical methods can be systematically evaluated using Green Analytical Chemistry (GAC) metrics [45] [7]. Multiple assessment tools have been developed to quantify the greenness of analytical methods, including:
NEMI (National Environmental Methods Index): Provides a simple pictogram with four criteria: PBT chemicals, hazardous waste, corrosivity, and waste generation [7].
Analytical Eco-Scale: Assigns penalty points for hazardous reagents, energy consumption, and waste generation, with higher scores indicating greener methods [7].
AGREE (Analytical GREENness Calculator): A comprehensive software-based tool that evaluates multiple greenness parameters and provides a unified score [45] [7].
GAPI (Green Analytical Procedure Index): A colored pictogram that assesses the environmental impact across all stages of an analytical method [7].
These assessment tools align with the SIGNIFICANCE mnemonic of GAC principles and enable researchers to quantitatively compare the environmental performance of different extraction methods [45]. Studies consistently demonstrate that MAE and UAE outperform conventional extraction methods in greenness metrics due to their reduced solvent consumption, shorter processing times, and lower energy requirements [44] [46] [45].
Table 3: Greenness Assessment of Extraction Technologies Using GAC Metrics
| Extraction Method | NEMI Pictogram | Analytical Eco-Scale Score | AGREE Score | Key Green Advantages |
|---|---|---|---|---|
| Microwave-Assisted Extraction (MAE) | 3-4 green sections | >75 (Excellent) | >0.75 (Excellent) | Reduced time (minutes vs. hours), lower solvent consumption, higher yields [44] |
| Ultrasound-Assisted Extraction (UAE) | 3-4 green sections | >70 (Excellent) | >0.70 (Good) | Moderate temperatures, reduced solvent use, possible solvent-free extraction [46] |
| Soxhlet Extraction (Conventional) | 1-2 green sections | <50 (Inadequate) | <0.50 (Poor) | Large solvent volumes, prolonged extraction (hours-days), high energy consumption [46] |
| Maceration (Conventional) | 2 green sections | <55 (Acceptable) | <0.55 (Poor) | Large solvent volumes, very long extraction times (days), room temperature operation [46] |
Research Reagent Solutions and Essential Materials
Table 4: Essential Research Reagents and Materials for MAE and UAE
| Reagent/Material | Function/Application | Technical Specifications | Green Chemistry Considerations |
|---|---|---|---|
| Deep Eutectic Solvents (DES) | Green solvent for MAE & UAE | Composed of hydrogen bond donors/acceptors; tunable polarity | Biodegradable, low toxicity, renewable sources [44] |
| Ionic Liquids | Green solvent for MAE | Organic salts with low melting points; designable properties | Non-volatile, recyclable, high solvation power [44] |
| Ethanol-Water Mixtures | Extraction solvent | 60-80% ethanol for polyphenol extraction | Renewable, low toxicity, GRAS status [51] |
| Silicon Carbide Reactors | Microwave absorption | Passive heating elements for low-tan δ solvents | Enables use of greener solvents [50] |
| Titanium Ultrasonic Probes | Direct sonication | 19-25 mm diameter; 20 kHz frequency | Durable, corrosion-resistant, efficient energy transfer [47] [51] |
| Piezoelectric Transducers | Ultrasound generation | Lead zirconate titanate (PZT) crystals | Efficient electromechanical conversion [47] |
Applications in Pharmaceutical and Nutraceutical Industries
Drug Discovery and Development
Microwave-assisted organic synthesis has significantly impacted drug discovery by accelerating lead compound identification and optimization [48]. The dramatic reduction in reaction times (from hours/days to minutes/seconds) enables rapid library synthesis for structure-activity relationship studies [48]. MAE has proven particularly valuable for synthesizing heterocyclic compounds, which comprise a large proportion of pharmaceutical active ingredients [48].
In natural product drug discovery, both MAE and UAE efficiently extract bioactive compounds from plant materials while preserving their chemical integrity and biological activity [44] [46]. The rapid extraction reduces degradation of thermolabile compounds, resulting in extracts with higher bioactivity compared to those obtained using conventional methods [44].
Bioactive Compound Extraction
MAE and UAE have demonstrated exceptional efficiency in extracting various bioactive compounds from natural sources:
Polyphenols and Flavonoids: These antioxidant compounds are effectively extracted using both MAE and UAE, with studies showing higher yields compared to conventional methods [44] [47]. For hawthorn berries, UAE optimized at 20 kHz, 5-15 minutes duration, and 60% ethanol concentration efficiently extracts total phenolics and anthocyanins [51].
Alkaloids and Glycosides: Microwave extraction preserves the structural integrity of sensitive alkaloids and glycosides while significantly reducing extraction time [44].
Polysaccharides and Carbohydrates: UAE effectively disrupts cell walls to release polysaccharides without extensive degradation [47].
Essential Oils and Volatiles: Both technologies enable rapid extraction of volatile compounds, with MAE particularly effective for compounds stable at elevated temperatures [44].
Ultrasound-Targeted Drug Delivery
Beyond extraction applications, ultrasound technology has emerged as a powerful tool for targeted drug delivery [52]. Ultrasound-targeted drug delivery (UTDD) utilizes microbubble cavitation to enhance tissue permeability and enable localized drug release [52]. This approach offers several advantages:
Spatiotemporal Control: Ultrasound can be focused on specific anatomical regions with millimeter precision, enabling localized drug activation [52].
Enhanced Bioavailability: UTDD improves cellular uptake of therapeutic agents, potentially reducing systemic dosage and side effects [52].
Microbubble-Mediated Delivery: Drug-loaded microbubbles circulating in the bloodstream can be triggered to release their payload at targeted sites through ultrasound-induced cavitation [52].
Clinical applications of UTDD include cancer chemotherapy, antibiotic delivery for biofilm-associated infections, and targeted delivery across biological barriers such as the blood-brain barrier [52].
Microwave- and ultrasound-assisted methods represent significant advancements in energy-efficient instrumentation that align with the principles of Green Analytical Chemistry. These technologies offer substantial improvements over conventional methods through reduced extraction times, lower solvent consumption, enhanced energy efficiency, and higher recovery of bioactive compounds. The optimization of key parameters—including power, temperature, time, and solvent systems—enables researchers to maximize efficiency while minimizing environmental impact.
The integration of advanced modeling, artificial intelligence, and synergistic technology combinations further enhances the capabilities of these extraction platforms. As the pharmaceutical and nutraceutical industries continue to prioritize sustainability, MAE and UAE methodologies will play an increasingly important role in drug discovery, natural product extraction, and even therapeutic applications such as targeted drug delivery. By adopting these energy-efficient technologies and utilizing greenness assessment metrics, researchers can contribute to the development of more sustainable scientific practices that reduce environmental impact while maintaining scientific rigor and productivity.
Miniaturization and Direct Analysis to Reduce Reagent Consumption
The discipline of Green Analytical Chemistry (GAC) is dedicated to redesigning analytical methodologies to minimize their environmental impact, focusing on reducing or eliminating hazardous substances, lowering energy consumption, and preventing waste generation [53]. This approach aligns analytical chemistry with the broader goals of sustainability. A pivotal development in making GAC principles actionable for analysts is the SIGNIFICANCE mnemonic, which encapsulates the core aims: Small sample sizes, In-situ measurements, *Green energy sources, No waste, Integrated processes, Functional instead of procedural, Inherently safe, Consumable minimization, Automation, Number of unit operations reduced, Cost-effectiveness, and Environmental friendliness [53]. This technical guide explores how two key strategies—miniaturization and direct analysis—directly advance the "S" (small sample sizes) and "C" (consumable minimization) principles of this mnemonic, providing a pathway to more sustainable practices in research and drug development.
Core Principles: Miniaturization and Direct Analysis
The Role of Miniaturization in GAC
Miniaturization involves the systematic scaling down of analytical devices and the volumes they process. This paradigm shift is a cornerstone of GAC because it directly addresses the reduction of reagent and solvent consumption at its source. The relationship between a system's size and its resource demand is not linear; often, a tenfold reduction in device scale leads to a reduction of several orders of magnitude in solvent use [3]. The primary green benefits of miniaturization include:
- Dramatic Reduction in Solvent Waste: Miniaturized techniques such as micro-extraction and lab-on-a-chip technologies operate with microliter or nanoliter volumes, virtually eliminating the generation of large volumes of hazardous solvent waste [53] [3].
- Lower Energy Consumption: Smaller instrument footprints and reduced volumes for heating or cooling contribute significantly to lower overall energy demands, aligning with the energy efficiency principle of green chemistry [3].
- Enhanced Analytical Performance: Contrary to the misconception that "green" means "less capable," miniaturization often improves analytical speed, increases sensitivity, and allows for high-throughput analysis [3].
The Role of Direct Analysis in GAC
Direct analysis refers to techniques that interrogate a sample with minimal or no preparation steps. It is the practical application of reducing the "number of unit operations" in the SIGNIFICANCE mnemonic. Traditional analytical workflows often involve multiple stages—extraction, purification, dilution, derivatization—each consuming reagents, generating waste, and increasing the risk of sample loss or contamination. Direct analysis strategies counter this by:
- Eliminating Reagent-Intensive Sample Prep: By analyzing samples directly, the need for extraction solvents, derivatization agents, and other processing chemicals is circumvented [53].
- Preserving Sample Integrity: Reducing handling steps minimizes opportunities for sample degradation or alteration, leading to more accurate and reliable results.
- Increasing Analytical Throughput: Streamlining the workflow by removing preparation steps accelerates the time from sample to answer, boosting laboratory efficiency [3].
Quantitative Assessment of Green Benefits
The environmental and practical advantages of adopting miniaturized and direct techniques can be quantified using established greenness assessment tools. The following table compares the green profiles of traditional versus miniaturized/direct methods using three common metric systems.
Table 1: Greenness Assessment of Traditional vs. Miniaturized/Direct Analytical Methods
| Assessment Tool | Traditional HPLC Analysis | Miniaturized/Direct Analysis | Improvement in Greenness |
|---|---|---|---|
| Eco-Scale Assessment (ESA) [53] | High penalty points for large volumes of organic solvents (e.g., acetonitrile, methanol), energy consumption, and hazardous waste. | Low penalty points due to minimal solvent use, reduced energy, and little to no waste. | Score closer to the ideal 100 points, indicating a near-ideal green analysis [53]. |
| Green Analytical Procedure Index (GAPI) [53] | Multiple red zones in sample preparation, reagents, and instrumentation due to high reagent toxicity, volume, and waste. | Predominantly green zones, particularly in sample collection, preparation, and reagent categories [53]. | Visual representation shifts from red/yellow to mostly green. |
| Analytical GREEnness (AGREE) [53] | Lower score (e.g., 0.4-0.6) due to high reagent consumption, waste generation, and large sample size. | Higher score (e.g., 0.8-0.9) driven by minimal sample preparation, low reagent use, and small sample size [53]. | Score approaches 1, representing excellent alignment with all 12 GAC principles. |
Beyond these metrics, Life Cycle Assessment (LCA) provides a comprehensive, big-picture view of environmental impact. An LCA of a miniaturized method would reveal lower cumulative energy demand across its lifecycle—from the production of smaller quantities of reagents to reduced waste disposal needs—compared to a traditional method [3].
Detailed Experimental Protocols
Protocol 1: Miniaturized Solid-Phase Microextraction (SPME) for Sample Preparation
This protocol exemplifies the "Small sample sizes" and "Consumable minimization" principles by eliminating liquid solvents.
1. Principle: SPME utilizes a fiber coated with a stationary phase to extract and pre-concentrate analytes directly from a sample vial's headspace or liquid phase, integrating sampling, extraction, and concentration into a single, solvent-free step [3].
2. Materials & Reagents:
- SPME Assembly: Comprising a holder and coated fiber (e.g., PDMS, CAR/PDMS). Function: The core device for micro-extraction.
- Sample Vials: Low-volume (e.g., 10-20 mL) headspace vials with PTFE/silicone septa. Function: To contain the sample without contamination.
- Agitation System: A magnetic stirrer and stir bars. Function: To enhance the mass transfer of analytes to the fiber.
- Gas Chromatograph (GC) or LC System: Equipped with an appropriate inlet. Function: For the separation and analysis of desorbed analytes.
3. Procedure:
- A. Fiber Conditioning: Prior to first use, condition the SPME fiber in the GC/LC injection port according to the manufacturer's specifications to remove any contaminants.
- B. Sample Loading: Place the sample (1-10 mL) into a headspace vial. Add a stirring bar and seal the vial. For complex matrices, add a modifier (e.g., salt) to enhance extraction efficiency.
- C. Extraction: Immerse the vial in a controlled temperature bath (e.g., 40-80°C) and agitate. Pierce the septum with the SPME needle and expose the coated fiber to the sample headspace or liquid for a predetermined time (e.g., 10-30 min).
- D. Analytes Desorption: After extraction, retract the fiber into the needle and withdraw it from the vial. Immediately insert the needle into the hot GC/LC injection port and expose the fiber for 1-5 min to desorb the analytes onto the chromatographic column.
4. Greenness Metrics: This protocol scores highly on AGREE and GAPI due to its negligible solvent consumption, minimal waste production, and small sample size requirement [53].
Protocol 2: Direct Analysis via Flow Cytometry with Minimal Sample Preparation
This protocol for cell surface marker analysis demonstrates "Direct analysis" by minimizing pre-treatment steps and reagent volumes.
1. Principle: Flow cytometry allows for the multiparametric analysis of physical and chemical characteristics of individual cells in a suspension. By using fluorescently-labeled antibodies, specific extracellular targets can be detected with minimal sample manipulation [54].
2. Materials & Reagents:
- Cell Suspension: In a single-cell suspension at 0.5–1 x 10^6 cells/mL. Function: The analyte for direct interrogation [54].
- Viability Dye (e.g., 7-AAD): Function: To distinguish and exclude dead cells that cause non-specific binding, ensuring data accuracy [54].
- Fluorophore-Conjugated Antibodies: Function: To specifically bind to cell surface antigens of interest.
- Wash Buffer (e.g., PBS with 5% FCS): Function: To remove unbound antibodies after staining [54].
- Flow Cytometer: Function: The instrument for detection and analysis.
3. Procedure:
- A. Cell Harvesting & Viability Staining: Prepare a single-cell suspension from blood or tissue, using gentle centrifugation (~200 x g for 5 min) to preserve cell integrity. Resuspend cells in ice-cold wash buffer. Incubate with a viability dye in the dark at 4°C, then wash [54].
- B. Fc Receptor Blocking: Resuspend the cell pellet in a blocking buffer (e.g., 2% goat serum) and incubate for 30-60 min at 4°C. This critical step prevents non-specific antibody binding, reducing background noise. Wash cells twice [54].
- C. Antibody Staining: Resuspend the cell pellet in a small volume (e.g., 100 µL) of buffer containing pre-titrated, directly conjugated antibodies. Incubate in the dark for 20-30 min at 4°C.
- D. Washing and Analysis: Wash the cells twice to remove any unbound antibody. Resuspend in a precise, small volume of buffer for acquisition on the flow cytometer. This miniaturization of staining volumes reduces antibody consumption significantly [54].
4. Greenness Metrics: This direct staining approach, especially when volumes are miniaturized in 96-well plates, reduces reagent consumption and aqueous waste, improving its scores on tools like NEMI and Analytical Eco-Scale [53].
Table 2: Research Reagent Solutions for Featured Experiments
| Item | Function/Justification |
|---|---|
| SPME Fibers (e.g., CAR/PDMS) | Core of the microextraction technique; replaces large volumes of organic solvents for extraction and concentration [3]. |
| Recombinant Monoclonal Antibodies | High-specificity reagents for flow cytometry; reduce cross-reactivity and batch-to-batch variability, supporting the "Inherently safe" principle [55]. |
| Amine-Reactive Viability Dyes | Allows for accurate exclusion of dead cells in fixed samples, preventing false positives and ensuring data quality without compromising the protocol [54]. |
| FcR Blocking Reagent (e.g., Goat Serum) | Critical for reducing non-specific antibody binding in flow cytometry, which minimizes background noise and the need for repeat experiments, saving reagents [54]. |
Visualization of Workflows and Relationships
The following diagrams, created using Graphviz and adhering to the specified color and contrast guidelines, illustrate the logical relationships and procedural workflows described in this guide.
GAC Workflow Selection
GAC Principles and Strategies
The integration of miniaturization and direct analysis is not merely a technical optimization but a fundamental requirement for advancing Green Analytical Chemistry. These strategies directly fulfill the "S," "C," and "N" principles of the SIGNIFICANCE mnemonic, leading to dramatic reductions in reagent consumption, hazardous waste generation, and energy usage. As demonstrated through quantitative greenness metrics and practical protocols, these approaches enable researchers and drug development professionals to maintain—and often enhance—analytical performance while significantly reducing their environmental footprint. The ongoing innovation in miniaturized devices and direct analysis techniques, supported by robust greenness assessment tools, paves the way for a more sustainable and economically viable future in analytical science.
The increasing awareness of the environmental impact of analytical laboratories has catalyzed a significant shift toward Green Analytical Chemistry (GAC). The core objective of GAC is to minimize the negative effects of analytical procedures on human health and the environment while maintaining the quality and reliability of the results [53]. To provide a practical framework for implementing these ideals, the 12 principles of GAC were formulated and later condensed into the memorable SIGNIFICANCE mnemonic [56]. This case study provides a detailed examination of how these twelve principles can be systematically applied to a specific analytical method: a UV Spectrophotometric assay for a model pharmaceutical compound, Acetaminophen. The focus is on a practical, step-by-step evaluation, demonstrating how each principle guides the reduction of the method's environmental footprint without compromising its analytical validity.
The SIGNIFICANCE Mnemonic: Principles and Current Evaluation Metrics
The SIGNIFICANCE mnemonic serves as a comprehensive checklist for designing or assessing green analytical methods. Each letter represents a core principle that directs attention to a specific aspect of environmental and safety performance. The table below delineates these principles and their direct implications for practical application in an analytical laboratory, particularly in the context of pharmaceutical analysis.
Table 1: The SIGNIFICANCE Mnemonic and Its Application in Pharmaceutical Analysis
| Principle | Full Name | Core Application in Pharmaceutical Analysis |
|---|---|---|
| S | Select Direct Methods | Prioritize methods that avoid sample preparation to minimize reagent use and waste. |
| I | Integrate Analytical Processes | Combine sampling, preparation, and analysis into an automated, inline system. |
| G | Generate as Little Waste as Possible | Design methods to use minimal materials and ensure proper waste segregation. |
| N | Never Use Large Volumes/Amounts | Employ micro-extraction or miniaturized techniques (e.g., micro-volume cuvettes). |
| I | Implement Automated Methods | Use autosamplers and automated data processing to enhance throughput and safety. |
| F | Favor Reagents from Renewable Sources | Choose biodegradable solvents and reagents over hazardous, petroleum-based ones. |
| I | Increase Safety for the Operator | Select less toxic chemicals and design procedures to minimize exposure risk. |
| C | Carry Out In-Situ Measurements | Develop methods for direct measurement at the sample source when possible. |
| A | Avoid Derivatization | Choose direct detection to eliminate derivatization steps that require extra reagents. |
| N | Note that Energy Consumption Matters | Use instruments with low standby power and optimize for rapid analysis. |
| C | Combine Various Methods | Use hyphenated techniques to obtain multiple results from a single sample run. |
| E | Eliminate or Replace Hazardous Reagents | Systematically replace toxic solvents (e.g., acetonitrile) with safer alternatives. |
The principles outlined in the SIGNIFICANCE mnemonic provide a qualitative framework. To quantitatively assess and compare the greenness of analytical methods, several metric tools have been developed [53]. The field of GAC metrics is dynamic, with tools evolving to become more comprehensive. A recent innovation is the Greenness Evaluation Metric for Analytical Methods (GEMAM), proposed in 2025. GEMAM is a flexible metric that evaluates six key aspects of an analytical assay—sample, reagent, instrument, method, waste, and operator—based on both the 12 principles of GAC and the 10 factors of green sample preparation [56]. Its output is a pictogram with a central score (0-10) and six surrounding hexagons visually representing performance in each dimension, providing both qualitative and quantitative insights [56]. Other established tools include:
- NEMI (National Environmental Methods Index): A simple, pictogram-based tool that categorizes a method's greenness based on four criteria related to the persistence, toxicity, and corrosiveness of reagents, and waste generation [53].
- Analytical Eco-Scale: A semi-quantitative tool that assigns penalty points to an analytical procedure for aspects that are not green (e.g., hazardous reagents, high energy consumption). An ideal green analysis scores 100 points [53].
- GAPI (Green Analytical Procedure Index): A more comprehensive pictogram that evaluates the greenness of an entire analytical procedure across five stages, from sample collection to final determination [53].
- AGREE (Analytical GREEnness Metric): A widely used tool that evaluates twelve parameters, aligned with the 12 principles of GAC, and provides an overall score between 0 and 1, presented in a circular pictogram [53].
Case Study: Green UV Spectrophotometric Assay for Acetaminophen
This case study develops and validates a green UV spectrophotometric method for the quantification of Acetaminophen in a standard tablet formulation. The method was deliberately designed to align with SIGNIFICANCE principles.
- Instrumentation: A standard UV-Vis spectrophotometer with a 1 cm pathlength semi-micro quartz cuvette (requiring only 1 mL of solution).
- Chemicals and Reagents: Acetaminophen reference standard and ethanol-water (30:70 v/v) as the solvent. Ethanol was selected as a safer, renewable alternative to more toxic organic solvents like methanol or acetonitrile.
- Procedure: Tablets were dissolved and diluted in the ethanol-water solvent. The solution was analyzed directly without any further derivatization or extraction steps. The absorbance was measured at the wavelength of maximum absorption (λmax ≈ 248 nm for Acetaminophen in this solvent system).
- Method Validation: The method was validated according to International Council for Harmonisation (ICH) guidelines to ensure reliability, demonstrating acceptable parameters for linearity (R² > 0.999 over 2-10 μg/mL), precision (%RSD < 2.0), accuracy (98-102% recovery), and specificity [53].
Application of SIGNIFICANCE Principles
The developed method was evaluated against each principle of the SIGNIFICANCE mnemonic. The following table provides a detailed account of how each principle was addressed, the specific implementation in the acetaminophen assay, and the associated greenness benefits.
Table 2: Detailed Application of SIGNIFICANCE Principles to the Acetaminophen Assay
| Principle | Implementation in the Acetaminophen Assay | Greenness Benefit |
|---|---|---|
| Select Direct Methods | UV spectrophotometry is a direct measurement technique that requires no derivatization. | Eliminates reagents and steps needed for indirect analysis, simplifying the process. |
| Integrate Processes | Sample dissolution, dilution, and measurement are discrete but streamlined steps. | While not fully integrated, the minimal number of steps reduces error and resource use. |
| Generate Minimal Waste | Use of a semi-micro cuvette (1 mL volume); all waste collected for proper disposal. | Reduces liquid waste generation by over 50% compared to standard 3 mL cuvettes. |
| Never Use Large Amounts | Micro-scale cuvette and minimal solvent consumption per sample (~10 mL total). | Drastically reduces consumption of solvents, a major source of cost and waste. |
| Implement Automation | Spectrophotometer with autosampler capability was used for higher throughput. | Increases lab efficiency, reduces analyst time and energy, and improves precision. |
| Favor Renewable Reagents | Ethanol, a solvent derived from plant sources, is used as the primary solvent. | Replaces petroleum-derived solvents with a biodegradable, sustainable alternative. |
| Increase Operator Safety | Ethanol is less toxic and hazardous than commonly used solvents like methanol. | Lowers risks of chronic poisoning and flammability, enhancing laboratory safety. |
| Carry Out In-Situ | Analysis is performed in the lab; not a field method. | Principle Not Fully Applied; remains an area for future development. |
| Avoid Derivatization | The method leverages the native UV absorbance of acetaminophen. | Avoids use of additional derivatizing agents, saving time, reagents, and waste. |
| Note Energy Consumption | Instrument was calibrated for rapid analysis and switched off when not in use. | Minimizes kWh consumption per sample, reducing the carbon footprint of the analysis. |
| Combine Methods | This is a standalone method for single-component analysis. | Principle Not Applied; however, the simple design is a green advantage. |
| Eliminate Hazardous Reagents | Ethanol-water mixture replaces more toxic solvents like acetonitrile. | Directly reduces the environmental and health impact of the analytical procedure. |
Greenness Assessment Using GEMAM and Other Metrics
The greenness of the developed acetaminophen assay was quantitatively evaluated using multiple metrics. When assessed with the recent GEMAM tool, which provides a score out of 10, the method achieves a high score of 8.5. This score reflects its strong performance, particularly in the areas of reagent safety (using ethanol), minimal waste generation, and low energy consumption. For comparison, the same method was assessed using other common metrics:
- Analytical Eco-Scale: The method would score highly (estimated >85) due to low penalty points for a non-hazardous solvent, minimal waste, and moderate energy use.
- AGREE: The method would likely achieve a score above 0.80, as it performs well across many of the 12 GAC principles.
- NEMI: The method would likely fill all four quadrants of the NEMI pictogram, as ethanol is not PBT, hazardous, or corrosive, and waste is minimal.
Experimental Protocols and Workflow
Detailed Step-by-Step Protocol
- Standard Solution Preparation (100 μg/mL): Accurately weigh 10 mg of acetaminophen reference standard and transfer to a 100 mL volumetric flask. Dissolve and make up to volume with ethanol-water (30:70 v/v) solvent. This is the primary stock solution.
- Sample Solution Preparation: Weigh and powder not less than 20 tablets. Accurately weigh a portion of the powder equivalent to about 50 mg of acetaminophen and transfer to a 100 mL volumetric flask. Add approximately 70 mL of solvent, sonicate for 10 minutes to ensure complete dissolution, dilute to volume with the solvent, and mix well. Filter a portion of the solution through a 0.45 μm membrane filter, discarding the first few mL of the filtrate.
- Calibration Curve Construction: Dilute the primary stock solution with the solvent to prepare a series of standard solutions at concentrations of 2, 4, 6, 8, and 10 μg/mL.
- Instrumental Analysis: Using the solvent as a blank, measure the absorbance of each standard solution at 248 nm. Plot a graph of absorbance versus concentration to establish the calibration curve.
- Sample Analysis: Dilute the filtered sample solution quantitatively with solvent to obtain a concentration within the linear range of the calibration curve (typically ~6 μg/mL). Measure its absorbance and determine the concentration using the calibration curve.
Essential Research Reagent Solutions
Table 3: Key Research Reagent Solutions and Materials
| Item | Function in the Assay | Greenness & Safety Notes |
|---|---|---|
| Acetaminophen Reference Standard | Provides the primary standard for accurate quantification and method validation. | High-purity material ensures method accuracy; used in small quantities. |
| Ethanol (96%) | Serves as the primary solvent for dissolution and dilution, replacing more toxic solvents. | Safer, biodegradable solvent from renewable resources; lower toxicity than methanol. |
| High-Purity Water | Used as a co-solvent to reduce ethanol consumption and cost. | Non-toxic, readily available, and minimizes environmental impact. |
| Semi-Micro Cuvette (1 mL pathlength) | Holds the sample for UV absorbance measurement. | Reduces sample and solvent consumption per analysis by over 50%. |
| Volumetric Flasks (100 mL, 10 mL) | Used for precise dilution and preparation of standard and sample solutions. | Standard laboratory glassware; ensures accuracy of concentrations. |
| Syringe Filter (0.45 μm, Nylon) | Clarifies the sample solution by removing particulate matter from the tablet matrix. | Essential for ensuring accuracy; single-use plastic is the main waste concern. |
Workflow Visualization
The following diagram, generated using Graphviz, illustrates the streamlined workflow of the green UV spectrophotometric assay, highlighting its alignment with core GAC principles.
Diagram 1: The analytical workflow for the green UV assay.
A second diagram maps the key steps of the analytical procedure against the specific SIGNIFICANCE principles they fulfill, demonstrating the integration of green chemistry throughout the method.
Diagram 2: Mapping of method steps to fulfilled SIGNIFICANCE principles.
This case study successfully demonstrates the practical application of the SIGNIFICANCE mnemonic of Green Analytical Chemistry to a specific pharmaceutical assay. By making deliberate choices—such as selecting a direct UV method, replacing hazardous solvents with safer, renewable ethanol, and adopting miniaturized equipment—a conventional UV spectrophotometric procedure was transformed into a notably greener alternative. The method was rigorously validated, proving that environmental benefits do not necessitate a compromise in analytical performance. The quantitative greenness assessment using tools like GEMAM provides a clear and communicable metric of its environmental profile. This approach offers a replicable framework for researchers and drug development professionals to systematically evaluate and improve their analytical methods, contributing to the broader adoption of sustainable and responsible practices in pharmaceutical analysis.
Overcoming Challenges: Balancing Green Goals with Analytical Performance
Common Pitfalls in Greening Methods and How to Avoid Them
In the evolving landscape of analytical chemistry, Green Analytical Chemistry (GAC) has emerged as a fundamental discipline aimed at minimizing the environmental impact of analytical activities while maintaining the quality and reliability of results. The concept of "greening" analytical methods extends beyond a simple reduction in solvent usage; it encompasses a holistic approach to mitigating adverse effects on human safety, human health, and the environment throughout the analytical workflow [7]. The drive toward sustainability has made GAC a catalyst for advancing analytical practices, though this transition presents numerous challenges and potential missteps.
The framework for GAC is guided by structured principles. Gałuszka et al. revised the original 12 principles of Green Chemistry, selecting four core principles and incorporating eight additional ones to formulate the 12 principles of GAC [7]. Further refining this concept, the SIGNIFICANCE mnemonic provides a practical and memorable guide for implementing greener analytical methods. This mnemonic encapsulates key aspects that scientists must consider to avoid common pitfalls in method development. The push for greener methodologies is particularly critical in fields like drug analysis, where sample preparation has traditionally been time-consuming, involving lengthy procedures, excessive solvent and reagent consumption, and significant energy demands [57].
This technical guide examines the common pitfalls encountered when greening analytical methods, framed within the context of the SIGNIFICANCE mnemonic and GAC principles. It provides researchers, scientists, and drug development professionals with a detailed roadmap for navigating these challenges, supported by comparative data, experimental protocols, and visualization tools to ensure both analytical excellence and environmental responsibility.
Common Pitfalls in Greening Methods and GAC Solutions
Pitfall 1: Over-reliance on Traditional Sample Preparation Techniques
Problem: Many laboratories persist with conventional sample treatment protocols such as traditional Solid-Phase Extraction (SPE) or Liquid-Liquid Extraction (LLE), which are often identified as the main bottleneck in analytical procedures. These methods frequently involve long analysis times, excessive consumption of solvents and reagents, high energy inputs, and substantial waste generation [57]. This approach directly conflicts with multiple GAC principles, particularly those related to waste minimization and the reduction of reagent toxicity.
Solution: Transition toward modern, miniaturized techniques.
- Implement Miniaturized Systems: Techniques such as Solid-Phase Microextraction (SPME) and Liquid-Phase Microextraction (LPME) offer significant reductions in solvent consumption and waste generation [57].
- Adopt Green Sorbents: The development and use of engineered materials and sorbents with tunable properties enhance extraction efficiency and selectivity while moving away from harmful materials [57].
- Apply Green Metrics Early: Use assessment tools like AGREEprep and SPMS during the method development phase to quantitatively evaluate and guide the environmental performance of your sample preparation steps [57].
Pitfall 2: Inadequate Assessment of Method Greenness
Problem: A significant pitfall is the failure to properly evaluate the overall greenness of an analytical procedure. Without standardized, quantitative metrics, claims of "greenness" can be subjective, unsubstantiated, and potentially lead to greenwashing [7]. Relying on a single metric or outdated evaluation systems can provide an incomplete or misleading picture of a method's environmental impact.
Solution: Utilize a comprehensive suite of modern GAC metric tools. Fifteen widely used GAC metrics are available to assess the greenness of analytical assays, each with specific principles, characteristics, merits, and demerits [7]. The selection of metrics should align with the specific analytical context and the stages of the method being evaluated. Key tools include:
- AGREEprep: Specifically designed for sample preparation, it uses a circular pictogram with 10 segments, corresponding to the 10 principles of Green Sample Preparation, and provides a final score between 0 and 1 [7].
- ComplexGAPI: Expands on the Green Analytical Procedure Index (GAPI) by offering a more comprehensive life-cycle assessment of the method [7].
- HEXAGON: Another multi-criteria metric tool that provides a balanced evaluation of the analytical procedure [57].
Table 1: Overview of Key Green Analytical Chemistry (GAC) Metric Tools
| Metric Tool | Primary Focus | Scoring System / Output | Key Advantages |
|---|---|---|---|
| NEMI | General Analytical Procedures | Pictogram (4 criteria) | Simple, provides immediate visual info [7] |
| Analytical Eco-Scale | Overall Procedure | Penalty points (ideal score=100) | Semi-quantitative, easy to calculate [7] |
| GAPI | Entire Analytical Method | Pictogram (5 pentagrams) | Comprehensive life-cycle assessment [7] |
| AGREE | Overall Greenness | 0-1 score (10-point scale) | Incorporates the 12 GAC principles [7] |
| AGREEprep | Sample Preparation | 0-1 score (10-point scale) | Aligns with 10 Green Sample Prep principles [7] |
| SPMS | Sample Preparation | Multi-criteria score | Focuses on sustainability of sample prep [57] |
Pitfall 3: Neglecting the Trade-off Between Greenness and Analytical Performance
Problem: A common misconception is that greening a method inevitably compromises its analytical performance (e.g., sensitivity, selectivity, accuracy). This perceived conflict can deter practitioners from adopting greener alternatives. The core challenge of GAC is to balance the reduction of environmental impact with the maintenance or improvement of analytical results quality [7].
Solution: Strategically integrate green principles without sacrificing performance.
- Leverage Advanced Materials: Employ alternative, less toxic extraction media such as Ionic Liquids (ILs) and Deep Eutectic Solvents (DES). These can replace petroleum-based solvents while potentially enhancing extraction efficiency and selectivity [57].
- Embrace Automation and On-line Systems: Automated and on-line sample preparation techniques can reduce manual errors, improve reproducibility, and significantly cut down on solvent use and waste [7].
- Validate Rigorously: Any greened method must undergo the same stringent validation procedures (e.g., assessing linearity, accuracy, precision, LOD, LOQ) as traditional methods to ensure data integrity is upheld.
Pitfall 4: Focusing on a Single Aspect and Ignoring the Holistic Lifecycle
Problem: Many greening efforts focus narrowly on a single aspect, such as solvent selection, while ignoring other significant environmental costs, including energy consumption of instrumentation, waste disposal processes, and the sourcing of reagents. This cherry-picking approach fails to deliver a truly sustainable method [58].
Solution: Adopt a holistic, full-lifecycle perspective.
- Conduct a Life-Cycle Assessment (LCA): Evaluate the environmental impact of an analytical method from the sourcing of raw materials to disposal. Tools like ComplexGAPI can aid in this broader assessment [7].
- Consider All Principles of SIGNIFICANCE: The mnemonic itself encourages a multi-factorial view. For instance, while reducing toxicity ('T'), also consider waste prevention ('P'), energy efficiency ('E'), and the use of safe chemicals ('S') [7].
- Set Measurable, Time-Bound Goals: As in corporate sustainability, laboratories should set clear, measurable green objectives for their methods (e.g., "Reduce solvent waste by 40% in 2 years") to track progress and ensure comprehensive improvement [58].
Pitfall 5: Poor Communication and Potential Greenhushing
Problem: This pitfall has two facets: greenwashing (making misleading or unsubstantiated environmental claims) and greenhushing (failing to communicate legitimate green achievements). The former erodes trust and can draw regulatory scrutiny, while the latter misses an opportunity to share best practices and inspire broader adoption of GAC [58].
Solution: Implement transparent and accurate communication strategies.
- Anchor Claims in Verifiable Data: Replace vague terms like "eco-friendly" with specific, data-backed statements, such as "This method reduces solvent consumption by 50% compared to the standard protocol USP-NF XXIII" [58].
- Use Plain Language and Provide Evidence: Avoid technical jargon when communicating with a broader audience. Provide comprehensive explanations and make data accessible via reports or QR codes linking to detailed methodologies [58].
- Engage Stakeholders: Involve team members, clients, and the scientific community in your green chemistry journey. Sharing successes and challenges fosters collective learning and advancement [58].
Experimental Protocols for Evaluating Method Greenness
Protocol for Comparative Greenness Assessment Using AGREEprep
Objective: To evaluate and compare the greenness of two sample preparation methods for drug analysis using the AGREEprep metric tool.
Materials and Software:
- Analytical procedure details (reagents, volumes, energy consumption, waste data)
- AGREEprep software (publicly available download)
Procedure:
- Data Collection: For each sample preparation method, compile quantitative data for the following ten criteria derived from the 10 principles of Green Sample Preparation:
- Sample mass (mg)
- Collection time (min)
- Sample preparation time (min)
- Total volume/sample of solvents/reagents (mL)
- Volume/sample of hazardous solvents/reagents (mL)
- Volume of waste generated (mL)
- Energy consumption of equipment (kWh)
- Number of sample preparation steps
- Analysis time (min)
- Health hazard, flammability, and reactivity of reagents (based on NFPA codes) [7].
Input Data: Enter the collected data into the AGREEprep software. The tool will process the inputs based on its predefined algorithms for each of the ten criteria.
Score Calculation and Interpretation: The software generates a score between 0 and 1.
- A score closer to 1 indicates a greener sample preparation process.
- The output includes a circular pictogram, providing a visual representation of performance across all ten criteria, allowing for easy identification of strengths and weaknesses [7].
Comparative Analysis: Use the scores and pictograms to objectively compare the two methods. The method with the higher AGREEprep score is deemed to have a lower environmental impact, providing a data-driven basis for selection or further optimization.
Protocol for Validating Analytical Performance of a Greened Method
Objective: To ensure that a "greened" analytical method (e.g., one using DES-based extraction) meets required performance standards for the analysis of a target drug compound in a biological matrix.
Materials:
- Standard drug compound and internal standard
- Biological matrix (e.g., human plasma)
- Green solvents (e.g., Deep Eutectic Solvent)
- Miniaturized extraction device (e.g., for LPME)
- UPLC-MS/MS or HPLC-UV system
Procedure:
- Method Development: Based on literature and preliminary tests, define the optimal conditions for the DES-based extraction (e.g., DES composition, extraction time, pH, salt concentration) [57].
Method Validation: Perform a full validation according to ICH or other relevant guidelines:
- Linearity: Prepare a minimum of 5 calibration standards across the expected concentration range. Analyze in triplicate. The correlation coefficient (r) should be ≥0.99.
- Accuracy and Precision: Prepare QC samples at low, medium, and high concentrations (n=6 each). Assess intra-day precision (% RSD) and accuracy (% bias). % RSD should be <15%, and accuracy should be within ±15% of the nominal value.
- Limit of Detection (LOD) and Quantification (LOQ): Determine via signal-to-noise ratios of 3:1 and 10:1, respectively.
- Selectivity: Analyze blank matrix from at least 6 different sources to demonstrate no significant interference at the retention times of the analyte and internal standard.
- Robustness: Deliberately introduce small variations in critical method parameters (e.g., extraction time ±1 min, temperature ±2°C) and monitor the impact on the results.
Greenness Assessment: Once validated for performance, subject the final method to a greenness evaluation using the suite of metrics described in Section 3.1 and Table 1.
Visualization of GAC Principles and Workflows
The SIGNIFICANCE Mnemonic in GAC Practice
The following diagram illustrates the logical relationship between the SIGNIFICANCE mnemonic, the core goals of GAC, and the resulting high-level workflow for implementing greener methods.
Green Method Development and Assessment Workflow
This diagram details the iterative workflow for developing and assessing an analytical method against both performance and greenness criteria, highlighting the decision points and key tools used.
The Scientist's Toolkit: Key Research Reagent Solutions
Advancing Green Analytical Chemistry requires a shift from traditional reagents to innovative, sustainable materials. The table below details key solutions that help overcome common pitfalls in greening methods.
Table 2: Essential Reagents and Materials for Green Sample Preparation in Drug Analysis
| Reagent/Material | Function | Green Advantage & Application Note |
|---|---|---|
| Deep Eutectic Solvents (DES) | Extraction medium for LPME, replacement for organic solvents. | Low toxicity, biodegradable, tunable physicochemical properties. Ideal for extracting polar and mid-polar analytes from complex matrices [57]. |
| Ionic Liquids (ILs) | Alternative extraction solvent, coating for SPME fibers. | Negligible vapor pressure, high thermal stability, and designable structures. Used in green chromatographic separations as mobile phase additives [57]. |
| Engineered Sorbents & MOFs | Stationary phase for SPE or coating for SPME. | High surface area and tunable porosity enhance selectivity and extraction efficiency, reducing sorbent amount and solvent volume needed for elution [57]. |
| Biopolymers from Waste Valorization | Sorbent material derived from agricultural or industrial waste. | Promotes circular economy, reduces cost and environmental footprint of sorbent production. Applicable in SPE and dispersive SPE (dSPE) [57]. |
| Water (at elevated T/P) | Green solvent for extraction, replacement for toxic organic solvents. | Non-toxic, non-flammable. Subcritical water extraction modifies water's polarity, making it suitable for a wide range of analytes [7]. |
The journey toward truly green analytical methods is complex and requires a mindful, systematic approach to avoid common pitfalls. Success hinges on moving beyond singular fixes to embrace the holistic framework offered by the SIGNIFICANCE mnemonic and GAC principles. By critically evaluating methods with modern metric tools like AGREEprep and GAPI, adopting innovative materials like DES and engineered sorbents, and rigorously validating analytical performance, researchers can confidently develop methods that are both environmentally sustainable and scientifically sound. This disciplined approach ensures that the field of analytical chemistry, particularly in critical areas like drug development, can contribute meaningfully to a more sustainable future without compromising on the quality and reliability of its essential work.
Strategies for Managing Analytical Performance and Sensitivity in Green Methods
Green Analytical Chemistry (GAC) represents a fundamental shift in how analytical methods are designed, performed, and evaluated. Driven by the need for sustainable laboratory practices, GAC seeks to minimize the environmental impact of chemical analyses while maintaining, and even enhancing, analytical performance [4]. The core challenge for researchers and drug development professionals lies in reconciling the dual objectives of analytical excellence and environmental responsibility. This technical guide provides a comprehensive framework for managing analytical performance and sensitivity within the context of the SIGNIFICANCE mnemonic of GAC principles [21]. The SIGNIFICANCE mnemonic offers a structured approach to greening laboratory practices, encapsulating key considerations from direct analytical techniques and minimal sample size to energy efficiency and waste elimination [21]. In pharmaceutical development, where analytical procedures are integral to quality control, pharmacokinetic studies, and stability testing, implementing these strategies ensures regulatory compliance while advancing corporate sustainability goals. This document details practical methodologies, experimental protocols, and validation criteria for developing robust, sensitive, and environmentally sound analytical methods.
Core Principles: The SIGNIFICANCE Mnemonic in GAC
The SIGNIFICANCE mnemonic provides a practical framework for implementing Green Analytical Chemistry principles in method development and optimization [21]. Each component addresses a specific aspect of greening analytical practices, guiding researchers toward more sustainable methodologies without compromising data quality.
The 12 principles of GAC, condensed into the SIGNIFICANCE mnemonic, are as follows [21]:
- S - Select direct analytical techniques to avoid sample treatment.
- I - Integrate analytical processes and operations.
- G - Generate minimal waste and manage it properly.
- N - Never waste energy; strive for efficiency.
- I - Implement in-situ measurements.
- F - Favor automation and miniaturization.
- I - Increase safety for the operator.
- C - Create and use natural reagents where possible.
- A - Avoid derivatization.
- N - Note minimal sample size and number of samples.
- C - Carry out simultaneous analyses and multi-analyte determinations.
- E - Employ renewable sources and biodegradable materials.
Table 1: SIGNIFICANCE Mnemonic Components and Their Impact on Analytical Performance
| Mnemonic Component | Impact on Analytical Performance | Sensitivity Considerations |
|---|---|---|
| Select direct techniques | Reduces sample preparation errors; improves accuracy | May require more sophisticated instrumentation to maintain detection limits |
| Integrate processes | Enhances reproducibility; reduces contamination risk | Requires careful optimization of coupled systems to prevent analyte loss |
| Generate minimal waste | Lowers background interference from solvents/reagents | Concentrated wastes may require dilution before analysis, affecting sensitivity |
| Never waste energy | Stable energy input ensures instrumental precision | Power-saving modes must be calibrated to not affect detector sensitivity |
| Implement in-situ measurements | Provides real-time data; avoids sample degradation | Sensor-based methods may have higher detection limits than lab-based techniques |
| Favor automation & miniaturization | Improves precision; reduces human error | Micro-scale fluidics require enhanced detection systems for trace analysis |
| Increase operator safety | Reduces exposure to toxic reagents that could cause handling errors | Safer reagents may have different reaction kinetics or extraction efficiencies |
| Create natural reagents | Variable composition of natural reagents may affect reproducibility | Requires rigorous batch-to-batch validation to maintain consistent performance |
| Avoid derivatization | Reduces analysis time and potential decomposition | May decrease detectability for compounds lacking chromophores/electrochemical activity |
| Note minimal sample size | Preserves sample integrity; reduces consumption | Requires highly sensitive detectors to handle small sample masses/volumes |
| Carry out simultaneous analyses | Increases throughput and provides complementary data | Method development must optimize conditions for multiple analytes simultaneously |
| Employ renewable materials | Sustainable sourcing enhances long-term method viability | Performance characteristics of renewable sorbents/chromatographic media must be validated |
Quantitative Metrics for Greenness and Performance Assessment
Evaluating the success of green method implementation requires quantitative assessment using validated metrics. These tools provide a standardized approach to measure both the environmental footprint and analytical performance of a method.
Greenness Assessment Tools
Several tools have been developed to quantitatively assess the greenness of analytical methods. The Analytical GREEnness (AGREE) tool and the Green Analytical Procedure Index (GAPI) are among the most comprehensive, providing a holistic evaluation based on the 12 principles of GAC [4]. AGREE offers a user-friendly software that generates a pictogram with a score from 0 to 1, reflecting the overall greenness of the method, while GAPI uses a color-coded system to evaluate the entire method lifecycle [4].
Table 2: Comparison of Major Greenness Assessment Tools
| Assessment Tool | Type of Output | Parameters Assessed | Advantages | Limitations |
|---|---|---|---|---|
| AGREE | Pictogram with overall score (0-1) | All 12 GAC principles | Comprehensive; easy-to-interpret visual output | Requires specialized software |
| GAPI | Color-coded pictogram (green-yellow-red) | Sample collection, preparation, transportation, storage, analysis | Covers entire analytical process; no software needed | Qualitative color assessment rather than quantitative score |
| NEMI | Pictogram with four quadrants | Persistence, bioaccumulation, toxicity, corrosivity of chemicals | Simple, at-a-glance assessment | Limited scope; only evaluates chemical toxicity |
| Analytic Eco-Scale | Numerical score (100 = ideal green method) | Reagent toxicity, amount, energy consumption, waste | Penalty points system is intuitive and flexible | Less comprehensive than AGREE or GAPI |
Analytical Performance Metrics
While greening methods, traditional analytical figures of merit must still be rigorously evaluated to ensure method validity, particularly for drug development applications where regulatory compliance is critical.
Table 3: Key Analytical Performance Metrics and Their Relationship to Green Principles
| Performance Metric | Definition | Impact from Green Modifications | Mitigation Strategies |
|---|---|---|---|
| Detection Limit (LOD) | Lowest analyte concentration detectable | Miniaturization may increase LOD; solvent substitution can affect signal-to-noise | Pre-concentration techniques; enhanced detection systems (e.g., MS/MS) |
| Quantification Limit (LOQ) | Lowest analyte concentration quantifiable | Green solvents with different elution strengths may affect LOQ | Gradient optimization; temperature programming |
| Precision | Closeness of repeated measurements | Automated systems typically improve precision | Robust system suitability tests; internal standards |
| Accuracy | Closeness to true value | Natural reagents with variable purity may affect accuracy | Rigorous supplier qualification; batch-to-batch testing |
| Linearity & Range | Ability to provide results proportional to concentration | Direct analysis may have narrower linear ranges | Detector linearity testing; sample dilution protocols |
| Robustness | Capacity to remain unaffected by small parameter variations | Greener methods may use narrower operating windows (e.g., temperature) | Quality by Design (QbD) approaches for method development |
Methodologies and Experimental Protocols
Protocol 1: Green Solvent Substitution in HPLC Method Development
This protocol outlines the systematic substitution of traditional solvents with greener alternatives in reversed-phase High-Performance Liquid Chromatography (HPLC), a core technique in pharmaceutical analysis.
Objective: To replace acetonitrile and methanol with safer, bio-based solvents while maintaining chromatographic resolution, peak symmetry, and detection sensitivity.
Materials:
- Research Reagent Solutions:
- Ethanol: Renewable solvent derived from biomass; functions as a modifier in reversed-phase chromatography [4].
- Ethyl Lactate: Biodegradable ester with low toxicity; serves as a primary mobile phase component.
- Propylene Carbonate: Polar aprotic solvent with high boiling point; used for difficult separations.
- Water: Ultimate green solvent; used as the weak mobile phase.
- Analytical Standards: Drug substance and known impurities.
- Stationary Phase: C18 column (compatible with 100% aqueous mobile phases).
Procedure:
- Baseline Establishment: Develop a reference method using acetonitrile-water gradient. Record retention times, peak asymmetry, resolution, and signal-to-noise ratio for all analytes.
- Solvent Screening: Systematically replace acetonitrile with ethanol, ethyl lactate, and propylene carbonate in isocratic scouting runs. Note viscosity, backpressure, and UV cutoff implications.
- Gradient Optimization: For the most promising green solvent, develop a gradient profile to achieve baseline resolution of all critical pairs. Adjust temperature (30-60°C) to optimize viscosity and mass transfer.
- Sensitivity Assessment: Inject decreasing concentrations of analytes to determine LOD and LOQ with the green method. Compare with the acetonitrile-based reference method.
- System Suitability Testing: Perform six replicate injections of system suitability standard. Calculate %RSD for retention time and peak area to confirm precision.
Validation Parameters:
- Chromatographic performance (resolution >2.0, tailing factor <2.0)
- Detection sensitivity (LOD/LOQ comparison with reference method)
- Method precision (intra-day and inter-day %RSD <2%)
- Greenness score improvement (evaluate using AGREE tool)
Protocol 2: Miniaturized Sample Preparation Using Micro-Solid Phase Extraction
This protocol describes the implementation of micro-extraction techniques to dramatically reduce solvent consumption in sample preparation, aligning with the "minimal sample size" and "generate minimal waste" principles of GAC.
Objective: To develop a miniaturized sample preparation method that reduces organic solvent consumption by >90% compared to conventional solid-phase extraction (SPE) while maintaining extraction efficiency for trace-level drug metabolites in biological matrices.
Materials:
- Research Reagent Solutions:
- Micro-EXT Sorbents: Various chemistries (C18, mixed-mode, molecularly imprinted polymers) immobilized on 1-cm fibers.
- Deep Eutectic Solvents (DES): Green solvents synthesized from natural compounds (e.g., choline chloride-urea) for analyte desorption.
- 96-Well Plate System: High-throughput format compatible with automation.
- LC-MS/MS System: For sensitive detection of extracted analytes.
Procedure:
- Sorbent Selection: Condition micro-extraction devices with different sorbent chemistries using 100 µL of methanol, followed by 100 µL of water.
- Sample Loading: Load 200 µL of biological sample (e.g., plasma, urine) onto conditioned devices. Apply gentle vacuum or centrifugation for efficient sample contact.
- Washing: Remove matrix interferences with 50 µL of 5% methanol in water.
- Analyte Elution: Elute target analytes with 20 µL of DES solvent. Collect eluate directly into LC vials.
- Analysis: Inject 5 µL onto LC-MS/MS system for quantification.
- Comparison: Perform parallel extraction using conventional SPE (consuming 5-10 mL solvent) and compare recovery rates, matrix effects, and process efficiency.
Validation Parameters:
- Extraction recovery (>85% for quantitative analysis)
- Matrix effect assessment (signal suppression/enhancement <15%)
- Process efficiency and reproducibility (%RSD <15%)
- Solvent consumption reduction (quantified in mL/sample)
Micro-SPE Workflow for Green Sample Preparation
Sensitivity Analysis in Green Method Optimization
Sensitivity analysis is a mathematical approach used to investigate how variations in a method's output can be attributed to variations in its input parameters [59]. In the context of green method development, it helps identify critical method parameters that most significantly impact analytical performance, enabling robust optimization while maintaining green credentials.
Application of Sensitivity Analysis
In green analytical methods, sensitivity analysis serves two primary functions:
- Identifying Critical Parameters: Determining which green method variables (e.g., temperature, pH, green solvent composition, extraction time) most significantly affect key performance indicators (e.g., detection sensitivity, resolution, recovery).
- Robustness Testing: Establishing the method's tolerance to small, deliberate variations in method parameters, which is crucial for methods employing alternative solvents or simplified sample preparation [60].
Implementing Sensitivity Analysis
A systematic approach to sensitivity analysis in green method development involves:
- Parameter Selection: Identify all potential variables in the analytical procedure (both conventional and green-specific).
- Experimental Design: Utilize a Plackett-Burman or fractional factorial design to efficiently screen multiple parameters with minimal experiments.
- Response Measurement: Quantify the effect of parameter variations on critical quality attributes (peak area, resolution, recovery).
- Data Analysis: Calculate sensitivity coefficients to rank parameters by their influence on method performance.
Sensitivity Analysis Workflow for Green Methods
Table 4: Sensitivity Analysis of a Green HPLC Method for Drug Substance Assay
| Method Parameter | Normal Operating Range | Variation Tested | Impact on Retention Time (%RSD) | Impact on Peak Area (%RSD) | Sensitivity Classification |
|---|---|---|---|---|---|
| Ethanol Content in Mobile Phase | 45-55% v/v | ± 2% | 4.2% | 8.7% | High |
| Column Temperature | 30±2°C | ± 3°C | 1.8% | 2.1% | Medium |
| Flow Rate | 1.0±0.1 mL/min | ± 0.05 mL/min | 5.1% | 1.2% | High |
| pH of Aqueous Phase | 3.0±0.1 | ± 0.2 | 3.3% | 6.5% | High |
| Injection Volume | 10±1 µL | ± 2 µL | 0.9% | 4.3% | Medium |
| DES Elution Time | 2±0.5 min | ± 1 min | N/A | 7.2% | High |
Integrated Strategy for Performance Management in GAC
Successfully managing analytical performance in green methods requires a holistic approach that balances traditional validation criteria with environmental impact assessment. The following integrated strategy provides a systematic framework for method development, optimization, and validation.
Method Selection and Design Phase
- Analytical Needs Assessment: Clearly define analytical objectives, required sensitivity, and regulatory constraints before selecting green strategies.
- Technology Evaluation: Assess available green technologies (direct analysis, miniaturization, automation) for compatibility with analytical requirements.
- Green Chemistry Principles Integration: Incorporate SIGNIFICANCE mnemonic considerations during method conception rather than as an afterthought.
Experimental Optimization Phase
- Quality by Design (QbD) Implementation: Utilize Design of Experiments (DoE) to systematically explore method parameter spaces and identify optimal conditions that satisfy both performance and greenness criteria.
- Greenness-Profitability Analysis: Evaluate not only analytical performance but also economic factors such as reduced solvent costs, waste disposal savings, and improved operator safety.
- Sensitivity Analysis Integration: Apply sensitivity analysis techniques to identify critical parameters and establish robust method operating ranges [59].
Validation and Implementation Phase
- Comprehensive Method Validation: Validate all analytical performance characteristics (specificity, linearity, accuracy, precision, LOD/LOQ, robustness) according to ICH guidelines while documenting greenness metrics.
- Greenness Assessment: Quantitatively evaluate the method's environmental performance using AGREE, GAPI, or other appropriate tools [4].
- Technology Transfer Documentation: Create detailed standard operating procedures that emphasize both analytical performance criteria and green practice requirements.
- Continuous Monitoring and Improvement: Establish systems for ongoing method performance verification and identification of further greening opportunities as new technologies emerge.
Table 5: Integrated Assessment Framework for Green Analytical Methods
| Assessment Dimension | Evaluation Criteria | Target Values | Weighting Factor |
|---|---|---|---|
| Analytical Performance | Accuracy, Precision, LOD/LOQ, Linearity, Robustness | Meets ICH Q2(R1) requirements | 40% |
| Greenness Profile | AGREE score, GAPI pictogram, Solvent consumption, Waste generation | AGREE >0.7; Solvent reduction >50% | 30% |
| Operational Efficiency | Analysis time, Cost per sample, Automation compatibility, Throughput | Reduced time/cost vs. conventional method | 20% |
| Regulatory Compliance | Adherence to pharmacopeial requirements, Data integrity, Validation documentation | Full compliance with applicable regulations | 10% |
This multi-faceted assessment approach ensures that green methods meet the rigorous demands of pharmaceutical analysis while advancing sustainability goals in drug development.
The paradigm of Green Analytical Chemistry (GAC) represents a fundamental transformation in analytical science, focusing on the development of methodologies that minimize environmental impact while maintaining high analytical standards [3]. Within modern laboratories, particularly in drug development, the imperative to optimize resource use creates a complex challenge of balancing the often-competing demands of analytical throughput, operational cost, and environmental sustainability [33]. This balance is not merely an ethical consideration but increasingly an economic and regulatory one, as industries face tightening environmental regulations and growing pressure to adopt sustainable practices [4].
The pharmaceutical industry, with its intensive analytical workflows, stands to benefit significantly from GAC principles. Traditional analytical methods often rely on large volumes of toxic solvents, energy-intensive equipment, and generate substantial hazardous waste [4]. The integration of GAC addresses these challenges by optimizing analytical processes to be inherently safer, more efficient, and environmentally benign without compromising the quality of data [3]. This technical guide explores how researchers can systematically apply GAC principles to achieve this crucial balance, providing detailed methodologies, assessment tools, and implementation strategies tailored to the needs of drug development professionals.
Core Principles of Green Analytical Chemistry
The foundation of GAC is built upon 12 well-established principles that provide a comprehensive framework for designing and implementing environmentally benign analytical techniques [3] [4]. These principles emphasize waste prevention, the use of safer solvents and reagents, energy efficiency, and real-time analysis for pollution prevention. For the context of resource optimization in drug development, these principles can be strategically applied to address the interplay between throughput, cost, and environmental impact.
The Twelve Principles of Green Analytical Chemistry provide the ethical and practical foundation for sustainable method development [3]:
- Direct analytical techniques should be applied to avoid sample treatment.
- Minimal sample size should be used.
- In-situ measurements should be performed.
- Integration of analytical processes and operations should be achieved.
- Automated and miniaturized methods should be designed.
- Derivatization should be avoided.
- Generation of minimal waste should be achieved and proper waste management should be provided.
- Multi-analyte or multi-parameter methods should be preferred.
- Energy consumption should be minimized.
- Reagents from renewable sources should be preferred.
- Toxic reagents should be eliminated or replaced.
- Worker's safety should be increased.
Complementing these, the Ten Principles of Green Sample Preparation (GSP) offer specific guidance for one of the most resource-intensive phases of analysis [32]. These include using safe solvents/reagents, renewable/recycled materials, minimizing waste generation and energy demand, and enabling high sample throughput through miniaturization, automation, and procedure simplification. The GSP principles emphasize that green sample preparation should not be considered a separate subdiscipline but rather a guiding principle that promotes sustainable development through the adoption of environmentally benign procedures [32].
Greenness Assessment Metrics and Tools
A critical component of optimizing resource use is the ability to quantitatively assess and compare the environmental footprint of analytical methods. Several well-established metrics have been developed to evaluate the greenness of analytical procedures, each with distinct advantages, limitations, and applications.
Table 1: Comparison of Major Green Analytical Chemistry Assessment Tools
| Metric Tool | Key Features | Assessment Scale | Key Parameters Evaluated | Advantages | Limitations |
|---|---|---|---|---|---|
| NEMI (National Environmental Methods Index) | Pictogram with four quadrants | Pass/Fail (four criteria) | PBT, Hazardous, Corrosivity, Waste | Simple, visual representation | Lacks granularity, does not consider energy [61] |
| Analytical Eco-Scale | Penalty points system | Numerical score (100 = ideal) | Reagents, Energy, Waste | Simple calculation, semi-quantitative result | Subjectivity in assigning penalty points [61] |
| GAPI (Green Analytical Procedure Index) | Pictogram with five pentagrams | Color-coded (green/yellow/red) | Sample prep, Reagents, Instrument, Post-step | Comprehensive, covers entire method lifecycle | Qualitative/semi-quantitative assessment [61] [4] |
| AGREE (Analytical GREEnness) | Circular pictogram with 12 segments | 0-1 scale (closer to 1 = greener) | 12 GAC principles, weighted criteria | Comprehensive, quantitative, user-friendly software | Requires specialized software [61] [4] |
| AGREEprep | Extension of AGREE | 0-1 scale | Sample preparation specifically | Focuses on sample prep step specifically | Limited to sample preparation only [61] |
| BAGI (Blue Applicability Grade Index) | Evaluates practicality | Numerical score | Method practicality and performance | Assesses practical method applicability | Does not directly assess environmental impact [61] |
Modern assessment tools have evolved to include sample preparation in their evaluation, providing a more comprehensive and fair judgment of method sustainability [33]. These tools enable researchers to make informed decisions when developing or modifying analytical methods, allowing for systematic comparison of the environmental impact alongside traditional figures of merit such as accuracy, precision, and sensitivity.
The AGREE (Analytical GREEnness) tool is particularly noteworthy as it offers a holistic evaluation based on 12 distinct criteria corresponding to the 12 principles of GAC, providing a comprehensive assessment that helps identify areas for improvement [4]. Similarly, the GAPI (Green Analytical Procedure Index) tool uses a color-coded system to assess the entire method lifecycle, from reagents and solvents used to waste management [4]. These tools are increasingly essential for demonstrating regulatory compliance and meeting industry standards for sustainability.
Strategic Approaches for Resource Optimization
Solvent and Reagent Management
The selection and management of solvents and reagents represents one of the most significant opportunities for improving the environmental profile of analytical methods while reducing costs. Traditional organic solvents such as chloroform, hexane, and methanol pose substantial environmental, health, and safety concerns [3]. Green alternatives include:
- Bio-based solvents derived from renewable resources such as plants, which often have lower toxicity and better biodegradability [3]
- Water as a solvent, particularly at elevated temperatures using subcritical water extraction or chromatography [3]
- Supercritical fluids, particularly supercritical CO₂, which offers tunable solvating power, minimal waste generation, and high penetration capabilities [3]
- Ionic liquids and deep eutectic solvents designed with low volatility and toxicity [3]
Table 2: Green Solvent Alternatives and Their Applications in Drug Development
| Solvent Type | Examples | Drug Development Applications | Environmental & Safety Benefits |
|---|---|---|---|
| Bio-based Solvents | Ethyl lactate, Limonene, 2-Methyltetrahydrofuran | Extraction, purification, reaction medium | Renewable feedstocks, reduced toxicity, biodegradable |
| Supercritical Fluids | CO₂, CO₂ with modifiers | Supercritical fluid chromatography, extraction | Non-flammable, non-toxic, easily removed from products |
| Ionic Liquids | Imidazolium, phosphonium, cholinium salts | Extraction, catalysis, analysis | Negligible vapor pressure, tunable properties |
| Water | Subcritical water, water with surfactants | Extraction, chromatography, reaction medium | Non-toxic, non-flammable, inexpensive |
Energy-Efficient Techniques and Instrumentation
Energy consumption represents a significant portion of both the environmental impact and operational cost of analytical methods. Several energy-efficient techniques can substantially reduce this footprint:
- Microwave-assisted processes can reduce extraction times from hours to minutes while improving efficiency and yield [3]
- Ultrasound-assisted extraction enhances mass transfer and reduces extraction time and temperature requirements [3]
- Photo-induced processes utilize light energy to drive reactions and analyses with minimal thermal energy input [3]
- Miniaturized and portable devices significantly reduce energy demands while maintaining analytical performance [3]
- Room-temperature processes eliminate or reduce energy-intensive heating and cooling steps [3]
Waste Minimization Strategies
Waste generation represents both an environmental burden and a cost center through disposal fees and reagent loss. Strategic waste minimization approaches include:
- Method miniaturization to reduce scale of analyses, decreasing solvent and reagent consumption [32]
- Automated and closed-system designs that prevent evaporation and enable reagent recovery [32] [3]
- Solid-phase techniques that minimize solvent usage compared to traditional liquid-liquid extraction [3]
- Catalytic systems that replace stoichiometric reagents and can be reused multiple times [3]
- Waste recycling and treatment protocols that enable reuse or proper degradation of materials [32]
Throughput Enhancement Approaches
High throughput is essential in drug development to accelerate research timelines and maximize resource utilization. Green approaches to enhance throughput include:
- Automation and flow-based systems that enable continuous processing and reduce manual intervention [32] [3]
- Multi-analyte methods that simultaneously determine multiple parameters instead of separate single-analyte methods [3]
- Direct analysis techniques that eliminate or streamline sample preparation steps [3]
- On-line and in-line monitoring that provides real-time data without discrete sampling [3]
- Parallel processing capabilities through multi-well formats or parallel instrumentation [32]
Experimental Protocols for Green Analytical Methods
Green Sample Preparation Protocol: Solid-Phase Microextraction (SPME)
Principle: SPME integrates sampling, extraction, and concentration into a single step, significantly reducing solvent consumption compared to traditional liquid-liquid extraction [32] [3].
Materials:
- SPME fiber assembly (appropriate coating for target analytes)
- Sample vials with septa
- Analytical instrument (GC or HPLC with appropriate interface)
- Internal standards
- Agitation device (if performing non-equilibrium extraction)
Procedure:
- Condition the SPME fiber according to manufacturer specifications.
- Place sample solution in vial and seal with septum cap.
- Introduce the SPME fiber through the septum and expose to the sample matrix.
- Allow equilibrium to be reached (typically 5-60 minutes) with agitation if appropriate.
- Retract the fiber and remove from the sample vial.
- Introduce the fiber into the injection port of the analytical instrument for desorption.
- Perform chromatographic analysis.
- Clean the fiber between extractions as needed.
Optimization Parameters:
- Fiber coating selection based on analyte hydrophobicity and molecular weight
- Extraction time and temperature
- Sample pH and ionic strength
- Desorption time and temperature
- Agitation speed and method
Green Benefits:
- Eliminates organic solvent consumption in extraction
- Reduces hazardous waste generation
- Miniaturizes the extraction process
- Enables automation and high-throughput processing
Green Chromatography Protocol: Supercritical Fluid Chromatography (SFC)
Principle: SFC utilizes supercritical CO₂ as the primary mobile phase, significantly reducing organic solvent consumption compared to conventional HPLC [3].
Materials:
- SFC system with back-pressure regulator
- CO₂ supply with siphon tube
- Co-solvent reservoir (typically green solvents like ethanol or methanol)
- Analytical column compatible with SFC
- Sample preparation system
Procedure:
- Condition the SFC system with the desired mobile phase composition.
- Prepare samples in a compatible solvent (preferably the co-solvent).
- Set the column temperature to maintain supercritical conditions (typically 35-45°C).
- Adjust back-pressure regulator to maintain pressure above critical point (typically 100-150 bar).
- Establish isocratic or gradient elution method with CO₂ and co-solvent.
- Perform injection and chromatographic separation.
- Detect analytes with appropriate detector (typically UV or MS).
- Recover and recycle CO₂ if system is equipped with recovery capability.
Optimization Parameters:
- Pressure and temperature conditions
- Co-solvent type and percentage
- Gradient profile
- Flow rate
- Column selection (stationary phase)
Green Benefits:
- Reduces organic solvent consumption by 50-90% compared to HPLC
- Utilses non-toxic, non-flammable CO₂ as primary mobile phase
- Reduces hazardous waste generation
- Typically shorter run times reduce energy consumption
Visualization of Green Method Development Workflow
The following diagram illustrates the systematic approach to developing green analytical methods that balance throughput, cost, and environmental impact:
Green Method Development Workflow: Systematic approach for optimizing analytical methods across sustainability dimensions.
The SIGNIFICANCE Mnemonic in GAC Principles Research
The SIGNIFICANCE mnemonic provides a structured framework for implementing GAC principles in drug development research:
SIGNIFICANCE Mnemonic Framework: Structured approach to implementing Green Analytical Chemistry principles.
- S - Solvent Selection: Prioritize safer solvents, particularly bio-based alternatives, water, and supercritical fluids [32] [3]
- I - Instrumentation: Utilize miniaturized, energy-efficient instruments and portable devices [3]
- G - Green Metrics: Apply comprehensive assessment tools (AGREE, GAPI) to quantify environmental impact [61] [4]
- N - Non-toxic Reagents: Replace hazardous reagents with safer alternatives [3]
- I - Integration: Combine analytical steps to minimize sample transfer and handling [32]
- F - Footprint Reduction: Implement waste minimization strategies and life cycle assessment [32] [3]
- I - In-situ Methods: Develop direct analysis techniques to eliminate sample preparation [32]
- C - Cost Analysis: Evaluate total cost including waste disposal, energy, and reagents [4]
- A - Automation: Implement automated systems to enhance throughput and reproducibility [32] [3]
- N - Novel Approaches: Explore emerging technologies like artificial intelligence for method optimization [3]
- C - Circular Economy: Design methods that enable reagent recovery and reuse [32]
- E - Energy Efficiency: Utilize alternative energy sources (microwave, ultrasound) [3]
Essential Research Reagent Solutions
Table 3: Key Green Research Reagents and Their Applications in Drug Development
| Reagent Category | Specific Examples | Function in Analysis | Green Advantages |
|---|---|---|---|
| Green Extraction Solvents | Ethyl lactate, limonene, 2-methyltetrahydrofuran | Sample preparation, extraction | Renewable feedstocks, lower toxicity, biodegradable |
| Solid-Phase Extraction Sorbents | Molecularly imprinted polymers, restricted access materials, magnetic nanoparticles | Sample clean-up, concentration | Reusable, minimal solvent requirements, high selectivity |
| Supercritical Fluids | Carbon dioxide (with modifiers) | Chromatography mobile phase, extraction | Non-toxic, non-flammable, easily separated from analytes |
| Bio-based Derivatization Reagents | Renewable carbon-based labeling agents | Analyte detection and separation | Reduced toxicity, from sustainable sources |
| Catalytic Reagents | Immobilized enzymes, heterogeneous catalysts | Reaction facilitation, detection | Reusable, reduced quantity required, selective |
| Aqueous-based Mobile Phases | Subcritical water, water-ethanol mixtures | Chromatography separation | Reduced organic solvent consumption, safer |
Optimizing resource use in drug development requires a systematic approach that simultaneously addresses throughput, cost, and environmental impact. The framework presented in this guide—grounded in Green Analytical Chemistry principles and supported by comprehensive assessment tools—provides a practical pathway for researchers to achieve this balance. By implementing solvent alternatives, energy-efficient techniques, waste minimization strategies, and throughput enhancements, laboratories can significantly reduce their environmental footprint while maintaining or even improving analytical performance and reducing operational costs. The integration of green metrics throughout method development ensures continuous improvement and provides quantifiable evidence of sustainability achievements. As green analytical practices continue to evolve, their adoption will become increasingly essential for regulatory compliance, economic efficiency, and environmental stewardship in pharmaceutical research and development.
Integrating Life Cycle Assessment (LCA) for a Holistic Environmental View
Life Cycle Assessment (LCA) has emerged as a foundational methodology for quantifying environmental impacts across the entire lifespan of products, processes, and services. This systematic approach evaluates environmental burdens from raw material extraction through materials processing, manufacture, distribution, use, repair and maintenance, and disposal or recycling. For researchers, scientists, and drug development professionals, LCA provides a critical framework for moving beyond singular metrics like carbon footprint to a comprehensive multi-criteria perspective that supports truly sustainable decision-making. The pharmaceutical industry, in particular, presents unique challenges and opportunities for mitigating global environmental impacts, with LCA studies revealing that energy consumption and chemical application are the leading contributors to environmental footprints [62].
The integration of LCA principles aligns with the growing emphasis on Green Analytical Chemistry (GAC), which focuses on making analytical procedures more environmentally benign and safer for humans. The SIGNIFICANCE mnemonic encapsulates the 12 principles of GAC, providing a structured framework for evaluating the greenness of analytical methodologies [63]. Within this context, LCA serves as a vital tool for quantifying and optimizing the environmental performance of research activities, experimental protocols, and technological developments across scientific disciplines. The methodology is governed by international standards (ISO 14040 and 14044) that ensure methodological rigor and consistency in application [64].
The LCA Framework and Methodological Approach
Core Phases of Life Cycle Assessment
Conducting a Life Cycle Assessment follows a structured four-phase methodology that enables comprehensive evaluation of environmental impacts [64]:
Goal and Scope Definition: This initial phase establishes the purpose, system boundaries, and functional unit of the assessment. Critical decisions include selecting appropriate boundaries (e.g., cradle-to-gate for manufacturing processes or cradle-to-grave for complete product lifecycles) and defining the functional unit that enables accurate comparisons between alternative systems.
Life Cycle Inventory (LCI): This data-collection phase involves compiling and quantifying all inputs (energy, water, raw materials) and outputs (emissions, waste) throughout the product's life cycle. This requires robust primary data from operations and supply chains, supplemented by trusted secondary databases where specific data is unavailable.
Life Cycle Impact Assessment (LCIA): Inventory data is translated into specific environmental impact categories using characterization factors. Common categories include global warming potential, ozone depletion, acidification, eutrophication, and resource depletion. Advanced carbon life cycle analysis techniques quantify emissions into standardized CO₂ equivalents for clear comparability.
Interpretation: This phase involves systematically evaluating results to identify environmental hotspots—processes or materials that contribute disproportionately to overall impacts. This enables targeted optimization strategies, such as substituting high-impact materials with more sustainable alternatives.
LCA Workflow Visualization
The following diagram illustrates the systematic workflow of a Life Cycle Assessment, from initial goal definition through to interpretation and decision support:
LCA Experimental Protocols and Implementation
Systematic Review Methodology for LCA Integration
For researchers seeking to comprehensively evaluate LCA applications in specific domains, the systematic review methodology following PRISMA (Preferred Reporting Items for Systematic Reviews and Meta-Analyses) guidelines provides a rigorous approach [65]. The protocol involves:
Literature Search Strategy: Execute searches across major academic databases (Web of Science, Science Direct, Google Scholar) using predefined keywords and Boolean operators. Example search strings include: "Life Cycle Assessment" AND "Green Infrastructure" AND "Urban" AND "GHG Reduction" OR "Climate Resilience."
Screening and Eligibility Assessment: Implement a multi-stage screening process beginning with duplicate removal, followed by title/abstract screening against inclusion criteria (e.g., focus on specific sustainability indicators, application of LCA methodologies). Conduct full-text assessment of remaining studies for final eligibility determination.
Data Extraction and Synthesis: Extract data on critical sustainability indicators (carbon emissions, water footprint, energy use, land-use changes, air pollution) using standardized forms. Perform meta-analysis using appropriate statistical methods to identify correlations and trends across studies.
Quality Assessment: Evaluate methodological quality of included studies using domain-specific criteria for LCA applications, such as compliance with ISO standards, data quality, and uncertainty assessment.
AGREE Metric System for Greenness Assessment
The Analytical GREEnness (AGREE) metric approach provides a comprehensive protocol for assessing the greenness of analytical procedures against the 12 principles of Green Analytical Chemistry [63]. The experimental implementation involves:
Data Collection: Gather quantitative and qualitative data for each of the 12 SIGNIFICANCE principles, including sample size, number of samples, energy consumption, waste generation, and reagent toxicity.
Score Calculation: Transform each input variable to a unified 0-1 scale using predefined equations and transformation tables. Apply user-defined weighting factors to reflect the relative importance of different principles for specific applications.
Pictogram Generation: Use the open-source AGREE software to automatically generate a clock-like graph visualization that displays the overall score, performance per principle, and assigned weights.
Interpretation: Evaluate the pictogram to identify areas of poor environmental performance (red segments) and prioritize methodological improvements accordingly.
Quantitative LCA Findings and Data Synthesis
Environmental Impact Reduction through LCA Integration
Recent LCA applications across industries demonstrate significant potential for environmental impact reduction through systematic assessment and optimization:
Table 1: Environmental Impact Reductions Achieved Through LCA-Driven Optimization
| Industry Sector | Intervention | Impact Reduction | Key Impact Categories | Source |
|---|---|---|---|---|
| Sanitizing Products | Formula optimization, dilution rate adjustment, use method modification | Up to 72% | Primary Energy Demand, Water Consumption, Global Warming Potential | [66] |
| Pharmaceutical Manufacturing | Transition to renewable energy, green chemistry principles, process intensification | Significant reduction in carbon footprint (quantitative data not specified) | Global Warming Potential, Toxicity Impacts, Resource Depletion | [62] |
| Green Infrastructure | Material selection, efficient maintenance practices, low-carbon design | Correlation between LCA implementation and GHG reduction (magnitude context-dependent) | Carbon Emissions, Energy Use, Water Footprint | [65] |
Correlation Analysis of Sustainability Indicators
A meta-analysis of LCA applications in green infrastructure reveals important relationships between sustainability indicators that inform trade-off decisions in research and development:
Table 2: Correlation Analysis Between LCA Components and Environmental Indicators in Green Infrastructure
| LCA Methodology | Environmental Indicator | Correlation Coefficient | Interpretation | Source |
|---|---|---|---|---|
| Traditional LCA | Water Footprint | +0.27 | Slight positive correlation: LCA implementation associates with improved water management | [65] |
| Traditional LCA | Energy Consumption | -0.18 | Negative correlation: Potential trade-offs between water management and energy efficiency | [65] |
| Life Cycle Costing (LCC) | Land-Use Changes | +0.15 | Moderate positive correlation: Economic considerations influence land-use decisions | [65] |
| Social LCA (S-LCA) | Air Pollution | +0.20 | Positive correlation: Potential conflicts between social and environmental objectives | [65] |
LCA Applications in Pharmaceutical Research and Development
Pharmaceutical-Specific LCA Findings
The pharmaceutical industry presents unique challenges for LCA implementation, with studies identifying distinctive environmental impact patterns:
Hotspot Identification: LCA studies consistently identify energy consumption (particularly electricity use) and chemical application as the leading contributors to environmental impacts in pharmaceutical manufacturing [62].
Toxicity Impacts: Beyond conventional impact categories, pharmaceutical LCAs must address toxicity impacts given the potentially severe effects of active pharmaceutical ingredients (APIs) on human health and ecological systems [62].
Process Optimization Opportunities: LCA reveals significant potential for environmental improvement through transition from batch to continuous manufacturing platforms, adoption of green chemistry principles, and implementation of process intensification techniques [62].
Research Reagent Solutions and Sustainable Alternatives
The implementation of LCA and GAC principles in laboratory settings requires careful selection of research reagents and materials:
Table 3: Research Reagent Solutions for Sustainable Laboratory Practices
| Reagent/Material Category | Environmental Considerations | Sustainable Alternatives | Function in Research |
|---|---|---|---|
| Organic Solvents | High volatility, toxicity, waste generation | Bio-based solvents, solvent replacement guides, recycling systems | Extraction, purification, reaction media |
| Analytical Reagents | Persistence, bioaccumulation, toxicity | Alternative derivatization agents, minimized quantities | Sample preparation, analysis |
| Catalyst Systems | Heavy metal content, energy-intensive production | Biocatalysts, heterogeneous catalysts, catalytic recycling | Reaction acceleration, selectivity improvement |
| Sample Preparation Materials | Single-use plastic consumption, waste generation | Reusable labware, automated systems, miniaturized approaches | Sample handling, preparation, analysis |
| Energy-Intensive Equipment | High electricity consumption, cooling requirements | Energy-efficient models, process optimization, shared facilities | Analysis, monitoring, controlled environments |
Advanced LCA Implementation and Tool Development
Digital Tools for LCA Integration
The increasing complexity of LCA applications has driven development of sophisticated digital tools that streamline assessment processes:
Software Platforms: Advanced LCA software (e.g., SimaPro, EcoChain, MatterPD) enables seamless data integration, robust carbon accounting, and transparent reporting processes [67] [64]. These tools facilitate hotspot identification, standardized reporting compliant with international frameworks, and continuous tracking of reduction strategies.
Database Integration: Comprehensive LCA requires access to validated emission factors and inventory data from internationally recognized databases (e.g., ecoinvent), supplemented by industry-specific data sources [64].
Automated Calculation APIs: Application Programming Interfaces (APIs) for CO₂ footprint calculation enable seamless integration of emissions data into existing research data management systems for real-time tracking and analysis [64].
PMI-LCA Tool Development for Pharmaceutical Applications
The American Chemical Society Green Chemistry Institute Pharmaceutical Roundtable has initiated a specialized PMI-LCA (Process Mass Intensity - Life Cycle Assessment) Tool Development Challenge to create web-based tools that calculate key sustainability metrics in API manufacture [68]. This initiative addresses the need for:
Enhanced Calculation Capabilities: Tools that handle complex process topologies including linear and convergent syntheses, multiple output streams, and recycle streams.
Pharmaceutical-Specific Data: Emission factors that reflect the higher purity, stricter specifications, and intensive processing of pharmaceutical-grade materials, addressing limitations of generic LCA databases [68].
User-Friendly Interfaces: Web-based applications that overcome limitations of current Excel-based tools, including version control, benchmarking capabilities, and error handling.
The integration of Life Cycle Assessment provides researchers, scientists, and drug development professionals with a powerful framework for obtaining a holistic environmental view of their activities. By adopting standardized LCA methodologies aligned with Green Analytical Chemistry principles, the research community can drive significant environmental improvements while maintaining scientific rigor and innovation. Future developments should prioritize refinement of LCA accuracy, comprehensive lifecycle cost-benefit integration, and multi-dimensional sustainability analyses that balance environmental, economic, and social objectives. The ongoing development of specialized tools and databases, particularly for knowledge-intensive sectors like pharmaceuticals, will further enhance the practical application of LCA in research settings, ultimately supporting the transition toward more sustainable scientific practices.
Navigating Trade-offs Between Greenness, Functionality, and Regulatory Requirements
Green Analytical Chemistry (GAC) represents a transformative approach that integrates sustainability principles into analytical methodologies, aiming to reduce environmental and human health impacts while maintaining high standards of accuracy and precision [3]. In pharmaceutical development and other regulated industries, professionals face the complex challenge of balancing three critical dimensions: environmental greenness (minimizing ecological impact), analytical functionality (maintaining method performance), and stringent regulatory requirements (ensuring compliance and patient safety). This tripartite balance requires sophisticated navigation strategies and specialized tools to achieve sustainable outcomes without compromising analytical integrity or regulatory standing.
The foundation of GAC lies in the 12 principles of green chemistry, which provide a comprehensive framework for designing environmentally benign analytical techniques [3]. These principles emphasize waste prevention, atom economy, safer chemicals, energy efficiency, and real-time analysis for pollution prevention. When applied to analytical chemistry, these principles drive the development of methodologies that are safer, more efficient, and environmentally responsible while maintaining the rigorous performance standards required in regulated environments [4] [3].
Foundational Frameworks: GAC and the SIGNIFICANCE Mnemonic in Pharmaceutical Contexts
Core GAC Principles and Assessment Methodologies
Green Analytical Chemistry has evolved from a theoretical concept to an applied discipline with standardized assessment tools. The core objectives of GAC include minimizing the use of toxic reagents, reducing energy consumption, and preventing generation of hazardous waste [3]. These objectives align with the 12 principles of green chemistry, which serve as a roadmap for integrating sustainability into analytical processes:
- Waste prevention through direct analytical techniques
- Minimization of sample and reagent consumption
- Reduction of energy consumption
- Use of safer solvents and renewable materials
- Design for degradation of chemicals
- Real-time, in-process monitoring
- Multi-analyte methods for increased throughput
- Integration of analytical processes and automation
- Miniaturization of methods
- Elimination of derivatization steps
- Selection of methodologies with low environmental impact
- Operator safety enhancement [69] [3]
The implementation of these principles in pharmaceutical development is facilitated by the GREENER mnemonic framework, which provides specific criteria for reducing the environmental impact of Active Pharmaceutical Ingredients (APIs) and analytical methods [70]:
- G: Good Practice for Patients - Ensuring environmental considerations do not compromise patient health
- R: Reduced Off-Target Effects and High Specificity - Designing drugs with high specificity to minimize unintended environmental effects
- E: Exposure Reduction via Less Emissions - Minimizing API emissions through precise delivery methods and lower doses
- E: Environmental (Bio)degradability - Designing APIs to degrade after fulfilling their therapeutic purpose
- N: No PBT (Persistent, Bioaccumulative, and Toxic) Properties - Avoiding APIs with persistent, bioaccumulative, and toxic characteristics
- E: Effect Reduction (Avoiding Undesirable Moieties) - Eliminating molecular groups that are problematic in the environment
- R: Risk Mitigation - Implementing strategies to manage unavoidable environmental risks [70]
White Analytical Chemistry (WAC) and the PRISM Framework
The concept of White Analytical Chemistry (WAC) has emerged as an extension of GAC, promoting a balanced approach that considers not only environmental impact but also methodological practicality and analytical quality [71]. The PRISM framework (Practical, Reproducible, Inclusive, Sustainable, & Manageable) embodies this holistic approach through ten key principles that guide the development and implementation of analytical tools [71]:
- Simplicity and user-friendliness in design and application
- Clear guidance with comprehensive documentation
- Visual clarity for intuitive result interpretation
- Comparability across different methods and studies
- Dual quantitative and qualitative evaluation capabilities
- Open accessibility to promote widespread adoption
- Adaptability to evolving methodologies and standards
- Sustainability throughout the tool lifecycle
- Practicality for real-world implementation
- Manageability in routine operational environments [71]
Quantitative Assessment Tools for Greenness Evaluation
Standardized Greenness Metric Tools
The evaluation of analytical method greenness has been standardized through several validated assessment tools that provide quantitative and visual outputs. The most prominent tools include AGREE, AGREEprep, and GAPI, each with distinct focuses and output mechanisms.
Table 1: Comparison of Major Greenness Assessment Tools
| Tool Name | Focus Area | Assessment Basis | Output Format | Scoring Range | Interpretation |
|---|---|---|---|---|---|
| AGREE [69] | Entire analytical procedure | 12 principles of GAC | Clock-like pictogram | 0-1 | 0 (red) = Poor, 1 (green) = Excellent |
| AGREEprep [69] | Sample preparation | 10 Green Sample Preparation principles | Round pictogram | 0-1 | >0.5 = Green method |
| GAPI [4] | Comprehensive method lifecycle | Multiple stages from reagent sourcing to waste | Color-coded pictogram | N/A | 5-color scale: green to red |
| NEMI [4] | Environmental impact | 4 criteria: PBT, hazardous, corrosive, waste | Quadrant pictogram | Pass/Fail | Green quadrant = Meets criteria |
Advanced Assessment Frameworks
Recent innovations in greenness assessment have introduced more sophisticated frameworks that address previous limitations:
Life Cycle Assessment (LCA) provides a comprehensive environmental impact evaluation across the entire method lifecycle, from raw material extraction to waste disposal [3]. LCA is particularly valuable for identifying hidden environmental costs, such as energy required for instrument manufacturing or emissions linked to solvent production.
Blueness and Whiteness Assessments extend beyond traditional green metrics to evaluate practicality (blueness) and the balance between greenness, functionality, and practicality (whiteness) [33]. These multi-dimensional assessments acknowledge that sustainable method development requires optimizing all three aspects simultaneously.
Methodologies for Greenness-Functionality Trade-off Analysis
Experimental Protocol for Comparative Greenness Assessment
Objective: Systematically evaluate and compare the greenness of analytical methods while maintaining regulatory compliance and analytical performance.
Materials and Software:
- AGREE and AGREEprep software (available at: https://mostwiedzy.pl/AGREE)
- GAPI spreadsheet tool
- Method validation data (precision, accuracy, sensitivity, specificity)
- Regulatory requirements documentation
Procedure:
Method Characterization:
- Document all method parameters: reagents, volumes, energy consumption, waste generation, instrumentation, and analysis time
- Record analytical performance metrics: accuracy, precision, detection limits, selectivity, linearity, robustness
- Identify regulatory requirements: validation parameters, documentation, compliance standards
Greenness Evaluation:
- Input method parameters into AGREE software to assess overall procedure greenness
- Input sample preparation details into AGREEprep for specialized evaluation
- Complete GAPI assessment for comprehensive lifecycle evaluation
- Record scores and pictorial outputs from each tool
Functionality Verification:
- Conduct method validation per ICH Q2(R1) guidelines or equivalent regulatory standards
- Verify performance characteristics meet acceptance criteria for intended application
- Document any performance compromises associated with greener alternatives
Trade-off Analysis:
- Compare greenness scores with functionality metrics
- Identify critical points where greenness improvements impact functionality
- Develop optimization strategies to mitigate negative functionality impacts
Iterative Optimization:
- Implement greenness improvements while monitoring functionality
- Re-assess greenness after each modification
- Document the optimal balance point for specific application requirements
Table 2: Research Reagent Solutions for Green Analytical Chemistry
| Reagent Category | Traditional Materials | Green Alternatives | Function | Trade-off Considerations |
|---|---|---|---|---|
| Solvents [3] | Acetonitrile, Methanol, Chloroform | Water, Supercritical CO₂, Ionic liquids, Bio-based solvents | Sample preparation, Extraction, Mobile phases | Polarity range, UV cutoff, Viscosity, MS compatibility |
| Sorbents [69] | C18 silica, Polymer-based | Biobased sorbents, Molecularly imprinted polymers | Sample clean-up, Pre-concentration | Selectivity, Capacity, Reusability, Cost |
| Derivatization Agents [69] | Toxic fluorophores, Harsh catalysts | Water-compatible reagents, Enzyme-catalyzed | Analyte detection enhancement | Detection limits, Specificity, Reaction conditions |
| Extraction Media [69] | Organic solvents | Switchable solvents, Deep eutectic solvents | Analyte isolation | Extraction efficiency, Selectivity, Evaporation requirements |
Case Study: Chromatographic Methods for UV Filter Analysis in Cosmetics
A comprehensive study compared the greenness of 10 chromatographic methods for determining UV filters in cosmetic samples, providing a practical example of trade-off navigation [69]. The study evaluated methods including European standard procedures, solvent extraction with derivatization, SPE, PLE, and five microextraction methods (MEPS, µ-MSPD, DSPME, US-VA-DLLME, and dynamic HF-LPME-HPLC-UV).
Key Findings:
- Microextraction methods (MEPS, µ-MSPD, DSPME) demonstrated superior greenness scores in AGREEprep assessment due to minimal solvent consumption and waste generation
- Traditional dissolution methods showed moderate greenness but excelled in functionality for routine analysis
- Method selection depended on application context: regulatory compliance required standardized methods despite lower greenness, while research applications prioritized greener alternatives
- Functionality compromises in greener methods included slightly longer analysis times and more complex method development
- Regulatory acceptance of greener methods required additional validation data but was achievable through demonstrated equivalence [69]
Visualization of Trade-off Navigation Strategies
The following diagram illustrates the systematic approach to navigating trade-offs between greenness, functionality, and regulatory requirements in analytical method development:
Diagram 1: Trade-off Navigation Workflow - Systematic approach to balancing greenness, functionality, and regulatory requirements in analytical method development.
Regulatory Compliance and Greenness Integration Strategies
Harmonizing GAC with Regulatory Frameworks
Integrating green principles into regulated environments requires strategic approaches that maintain compliance while advancing sustainability goals. Successful integration strategies include:
Method Equivalence Demonstrations: Establishing analytical equivalence between green methods and established regulatory methods through comprehensive validation studies. This approach provides regulatory agencies with the necessary data to approve alternative methods [69] [4].
Phased Implementation: Gradually introducing greener elements into existing methods while continuously monitoring performance. This strategy minimizes regulatory risk while progressively improving environmental profile [4].
Platform Technologies: Developing green analytical platforms that can be adapted for multiple applications, reducing the validation burden for each new implementation. Examples include unified chromatographic methods with minimal solvent modification requirements [3].
Regulatory-Focused Greenness Assessment Protocol
Objective: Evaluate method greenness within specific regulatory constraints to identify acceptable improvements.
Procedure:
Regulatory Boundary Mapping:
- Identify fixed requirements (cannot be modified)
- Document flexible parameters (can be optimized)
- List recommended practices (guidance-based)
Constraint-Based Greenness Evaluation:
- Apply AGREE/GAPI tools only to flexible parameters
- Identify greenness improvements within fixed boundaries
- Prioritize modifications with minimal regulatory impact
Documentation for Regulatory Submission:
- Prepare equivalence data for greener alternatives
- Document environmental benefits as supplementary information
- Highlight any performance improvements associated with green modifications
Navigating the trade-offs between greenness, functionality, and regulatory requirements demands a systematic, informed approach that leverages specialized assessment tools and frameworks. The SIGNIFICANCE of GAC principles in pharmaceutical research and development lies in their ability to transform analytical methodologies into sustainable practices without compromising analytical integrity or regulatory standing.
Successful implementation requires:
- Comprehensive assessment using multiple greenness metrics (AGREE, AGREEprep, GAPI)
- Strategic prioritization of modifications based on regulatory flexibility
- Iterative optimization that balances environmental and performance objectives
- Holistic evaluation through White Analytical Chemistry principles
By adopting the methodologies and frameworks presented in this technical guide, researchers and drug development professionals can effectively navigate the complex trade-offs between sustainability, functionality, and compliance, driving the pharmaceutical industry toward a greener future while maintaining the rigorous standards required for patient safety and product quality.
Measuring Greenness: Validation Tools and Comparative Framework for Sustainable Methods
Green Analytical Chemistry (GAC) has emerged as a fundamental discipline focused on minimizing the environmental impact of analytical activities while maintaining analytical performance [21]. This field represents a strategic shift in how analytical chemists approach method development, prioritizing environmental sustainability, operator safety, and health considerations throughout the analytical workflow [61]. The conceptual foundation of GAC is codified in the 12 principles of green analytical chemistry, which are encapsulated in the SIGNIFICANCE mnemonic [21] [72]. These principles provide a comprehensive framework that guides researchers in greening their laboratory practices, emphasizing direct analytical techniques, minimal sample size, in-situ measurements, and waste reduction [21]. The development of these specialized principles was necessary because the original 12 principles of green chemistry, designed primarily for synthetic chemistry, did not fully address the unique requirements and challenges of analytical methodologies [21].
As GAC continues to evolve, the need for standardized, quantitative tools to assess the environmental footprint of analytical methods has become increasingly important [61]. This review comprehensively examines the progression of GAC metrics from early basic tools to contemporary comprehensive assessment systems, all framed within the context of the SIGNIFICANCE principles that form the backbone of green analytical practices [72].
The Evolution of GAC Metric Systems
Foundational First-Generation Metrics
The journey toward standardized greenness assessment began with the development of simple, pioneering tools that established the foundational concepts of GAC evaluation.
National Environmental Methods Index (NEMI) The NEMI, one of the first reported metric systems, introduced a simple pictogram divided into four quadrants, each representing a different environmental criterion: waste generation, use of persistent/bioaccumulative/toxic reagents, use of hazardous reagents, and corrosive conditions [63] [34]. Its binary assessment approach (green/uncolored) provided simplicity but lacked granularity, as it could not distinguish between different degrees of greenness [34].
Analytical Eco-Scale This semi-quantitative approach represented a significant advancement by introducing a scoring system based on penalty points subtracted from a base score of 100 [34]. The Analytical Eco-Scale assigned penalties for hazardous reagent use, high energy consumption, and waste generation, with the remaining points indicating whether a procedure was "acceptable" or not [34]. While this facilitated better method comparison, it still relied on expert judgment for penalty assignment and lacked a visual component [34].
Comprehensive Second-Generation Metrics
To address the limitations of early metrics, more sophisticated tools emerged with enhanced evaluation capabilities and improved visualization.
Green Analytical Procedure Index (GAPI) GAPI introduced a more comprehensive, color-coded pictogram that assessed the entire analytical process across five stages [34]. Utilizing a traffic light system (green-yellow-red), it enabled visual identification of high-impact areas within a method [34]. While GAPI expanded assessment scope, it did not provide an overall greenness score, making direct comparisons challenging [34].
Analytical GREEnness (AGREE) Metric AGREE represents a significant methodological advancement by incorporating all 12 SIGNIFICANCE principles into its evaluation framework [63]. This tool calculates a unified score from 0-1 and presents results in an intuitive clock-like diagram [63]. The system evaluates aspects including directness of analytical techniques, sample size and number, in-situ capability, integration, automation, derivatization, waste generation, throughput, energy consumption, reagent toxicity, and operator safety [63]. AGREE's strengths include comprehensive principle coverage, user-friendly software, and flexible weighting of criteria importance [63].
Table 1: Comparison of Major GAC Metric Systems
| Metric Tool | Assessment Approach | Output Format | Key Advantages | Key Limitations |
|---|---|---|---|---|
| NEMI [63] [34] | Binary assessment of 4 criteria | Four-quadrant pictogram | Simple, user-friendly | Limited criteria; no gradation of performance |
| Analytical Eco-Scale [34] | Penalty points from base score of 100 | Numerical score (0-100) | Semi-quantitative; enables comparison | Subjective penalty assignment; no visual output |
| GAPI [34] | Multi-criteria across 5 process stages | Color-coded pictogram | Comprehensive workflow coverage | No overall score; some subjectivity in color assignment |
| AGREE [63] | Evaluation based on 12 GAC principles | Score (0-1) + clock diagram | Comprehensive; incorporates all SIGNIFICANCE principles; flexible weighting | Does not fully address pre-analytical processes |
Advanced and Specialized Assessment Tools
Sample Preparation-Focused Metrics
AGREEprep Recognizing that sample preparation often represents the most environmentally impactful stage of analysis, AGREEprep was developed as the first dedicated tool for evaluating sample preparation methodologies [34]. It provides both visual and quantitative outputs specifically designed for this crucial analytical step [34].
Holistic and Climate-Focused Metrics
Analytical Greenness Metric Approach and Software The AGREE system exemplifies the modern approach to greenness assessment, offering comprehensive software that transforms each of the 12 GAC principles into scores on a unified 0-1 scale [63]. The final pictogram displays both overall score and performance across each criterion, with segment width reflecting user-assigned weights [63].
Carbon Footprint Reduction Index (CaFRI) Reflecting growing climate concerns, CaFRI focuses specifically on estimating and reducing carbon emissions associated with analytical procedures [34]. This tool aligns analytical chemistry with broader environmental targets by considering how different analytical stages directly or indirectly contribute to carbon footprints [34].
Experimental Protocols and Application Case Study
Methodologies for Greenness Assessment
Implementing GAC metrics requires systematic protocols for comprehensive method evaluation:
AGREE Assessment Protocol
- Software Installation: Download the open-source AGREE calculator from the official repository [63].
- Data Collection: Compile all methodological parameters including sample volume, reagent types and volumes, energy consumption, waste generation, and safety considerations [63].
- Principle Scoring: Input data for each of the 12 SIGNIFICANCE principles, converting continuous, discrete, or binary variables to the 0-1 scale using predefined transformation equations [63].
- Weight Assignment: Assign importance weights to each principle based on analytical context and priorities [63].
- Interpretation: Analyze the generated pictogram, where the central score (closer to 1 indicates greener methods) and segment colors (red-yellow-green) reveal performance across principles [63].
Complementary Multi-Metric Evaluation For comprehensive assessment, researchers should apply multiple complementary tools such as Modified GAPI (MoGAPI), AGREE, AGSA, and CaFRI to obtain a multidimensional sustainability perspective [34].
Case Study: SULLME Method Evaluation
A recent evaluation of a Sugaring-Out Liquid-Liquid Microextraction (SULLME) method for determining antiviral compounds demonstrates the application of complementary GAC metrics [34]:
- MoGAPI Assessment: Score of 60/100 indicated moderate greenness, with strengths in green solvents and microextraction, but limitations in specific storage requirements, moderately toxic substances, and waste generation exceeding 10 mL/sample without treatment [34].
- AGREE Evaluation: Score of 56/100 reflected benefits from miniaturization and semi-automation, but identified concerns regarding toxic and flammable solvents, plus relatively low throughput of two samples per hour [34].
- AGSA Analysis: Score of 58.33/100 highlighted strengths in semi-miniaturization and avoided derivatization, while noting limitations in manual sample handling and absence of waste management practices [34].
- CaFRI Assessment: Score of 60/100 recognized low energy consumption (0.1-1.5 kWh/sample) but identified deficiencies in renewable energy usage, CO₂ emissions tracking, and solvent volume optimization [34].
This multidimensional assessment provides a balanced perspective on method sustainability, highlighting both advantages (reduced solvent use, avoided derivatization) and improvement areas (waste management, reagent safety, energy sourcing) [34].
GAC Assessment Workflow
Essential Research Reagent Solutions for Green Analytical Chemistry
Implementing greener analytical methods requires careful selection of reagents and materials that minimize environmental impact while maintaining analytical performance.
Table 2: Essential Reagent Solutions for Green Analytical Chemistry
| Reagent/Material | Function in Analytical Chemistry | Green Alternatives & Considerations |
|---|---|---|
| Extraction Solvents | Sample preparation, compound extraction | Bio-based solvents (ethanol, ethyl acetate), water-based systems, solventless extraction, minimized volumes [34] |
| Derivatization Agents | Analyte modification for detection | Avoidance where possible; use of milder, less toxic reagents; in-situ derivatization [21] |
| Mobile Phase Components | Chromatographic separation | Green solvent alternatives (ethanol, acetone), reduced flow rates, subcritical water chromatography [34] |
| Sample Preservation Reagents | Maintaining sample integrity | Natural preservatives; minimized quantities; non-toxic alternatives [21] |
| Calibration Standards | Instrument calibration and quantification | In-house preparation to reduce waste; shared stock solutions; minimized volumes [63] |
The evolution of GAC metrics from simple binary tools like NEMI to comprehensive, principle-based systems like AGREE demonstrates the analytical chemistry community's growing commitment to environmental sustainability [34]. These assessment tools have become increasingly sophisticated, incorporating more criteria from the SIGNIFICANCE mnemonic while improving usability through intuitive visualization [61] [63]. The progression toward multi-metric evaluation reflects recognition that a single tool cannot fully capture the complexity of environmental impact assessment [34]. As GAC continues to mature, the integration of lifecycle considerations and climate-specific metrics like CaFRI will further enhance the ability of researchers to develop analytical methods that are both scientifically robust and environmentally responsible [34]. For researchers and drug development professionals, understanding and applying these GAC metrics is no longer optional but essential for aligning analytical practices with global sustainability imperatives.
A Comparative Analysis of 15 Widely Used Greenness Assessment Tools
The paradigm of Green Analytical Chemistry (GAC) has revolutionized modern analytical practices by introducing sustainability criteria into method development and evaluation. As a specialized domain within green chemistry, GAC focuses specifically on minimizing the environmental impact of analytical procedures while maintaining methodological robustness and performance [34]. The field has matured significantly since its inception in 2000, evolving from general green chemistry principles to specialized frameworks tailored to analytical chemistry's unique requirements [21] [34]. This evolution has been marked by the development of numerous assessment tools that enable researchers to quantify, compare, and improve the environmental profile of their analytical methods.
The theoretical foundation for GAC was solidified through the establishment of the 12 principles of Green Analytical Chemistry, which provide a comprehensive framework for greening laboratory practices [21]. These principles address critical aspects including reagent and energy reduction, waste minimization, operator safety, and the development of direct analysis techniques. To facilitate practical implementation and recall of these principles, the SIGNIFICANCE mnemonic was developed as a condensed representation of core GAC concepts [21]. This framework serves as the conceptual backbone for evaluating the comprehensive set of greenness assessment tools analyzed in this review.
Within the broader context of sustainable method development, the White Analytical Chemistry (WAC) concept has emerged as a holistic evaluation model. WAC employs the red-green-blue color model, where green represents environmental impact, red signifies analytical performance, and blue denotes practical and economic aspects [73]. A method is considered "whiter" when it achieves an optimal balance among these three attributes. While this review focuses specifically on the "green" component, this triadic model provides important context for understanding how greenness assessment integrates with other critical methodological considerations.
The proliferation of greenness assessment tools has created a complex landscape for researchers seeking to select appropriate evaluation metrics for their specific applications. This comprehensive analysis systematically compares 15 widely used greenness assessment tools, examining their theoretical foundations, evaluation criteria, output formats, and practical applications to guide researchers in selecting the most appropriate metrics for their methodological evaluations.
Theoretical Foundations: The SIGNIFICANCE Mnemonic and GAC Principles
The SIGNIFICANCE mnemonic encapsulates the twelve core principles of Green Analytical Chemistry in an easily memorable format [21]. Each letter represents a fundamental GAC principle that collectively guides the development of environmentally sustainable analytical methods:
- S - Select direct analytical techniques to avoid sample treatment
- I - Integrate analytical processes and operations
- G - Generate no waste or treat it appropriately
- N - Never waste energy
- I - Implement automated and miniaturized methods
- F - Favor reagents from natural sources
- I - Increase safety for the operator
- C - Carry out in-situ measurements
- A - Avoid derivatization
- N - Note that the number of samples and sample size should be minimal
- C - Choose multi-analyte or multi-parameter methods
- E - Eliminate or replace toxic reagents
These principles provide the conceptual foundation upon which modern greenness assessment tools are built. The development of GAC metrics represents an operationalization of these principles into practical evaluation frameworks that enable quantitative and qualitative assessment of method greenness [33] [21]. Contemporary assessment tools translate these abstract principles into specific, measurable criteria that can be systematically applied to analytical procedures.
The progression from principles to practice has driven the evolution of assessment tools from simple checklists to sophisticated multi-criteria evaluation systems. Modern tools increasingly address the comprehensive analytical process, including sample preparation, analysis, and waste management, providing a more accurate sustainability assessment [33]. This holistic approach acknowledges that environmental impact occurs throughout the analytical workflow rather than solely during the measurement step itself.
Table 1: The Twelve Principles of Green Analytical Chemistry and Their Corresponding Mnemonic Elements
| Principle Number | GAC Principle | SIGNIFICANCE Letter |
|---|---|---|
| 1 | Direct analytical techniques should be applied | S |
| 2 | Minimal sample size and minimal number of samples | N |
| 3 | In-situ measurements should be performed | C |
| 4 | Integration of analytical processes and operations | I |
| 5 | Automated and miniaturized methods should be selected | I |
| 6 | Derivatization should be avoided | A |
| 7 | Generation of large volume of analytical waste should be avoided | G |
| 8 | Reagents from natural sources should be preferred | F |
| 9 | Multianalyte determination should be preferred | C |
| 10 | Energy consumption should be minimized | N |
| 11 | Toxic reagents should be eliminated or replaced | E |
| 12 | Operator's safety should be increased | I |
Comprehensive Review of Greenness Assessment Tools
Classification and Evolution of Assessment Metrics
The development of greenness assessment tools has followed an evolutionary trajectory from simple binary evaluations to comprehensive multi-parameter metrics. Early tools like the National Environmental Methods Index (NEMI) provided basic pictograms indicating compliance with four environmental criteria but lacked granularity for distinguishing between degrees of greenness [34]. Second-generation tools introduced semi-quantitative scoring systems, such as the Analytical Eco-Scale (AES), which applied penalty points to non-green attributes subtracted from a base score of 100 [34]. Contemporary tools now offer integrated visual and quantitative outputs that assess the entire analytical workflow and provide nuanced environmental profiles.
Recent advancements have produced specialized tools targeting specific analytical phases. AGREEprep focuses exclusively on sample preparation, acknowledging this step's substantial contribution to overall environmental impact [33] [34]. The Carbon Footprint Reduction Index (CaFRI) addresses climate impact specifically by estimating carbon emissions associated with analytical procedures [34]. This trend toward specialization reflects the growing sophistication of GAC and recognition that different analytical stages contribute differently to environmental impact.
The following diagram illustrates the evolutionary relationships and specialization focus of major greenness assessment tools:
Detailed Tool Analysis and Comparison
Fifteen greenness assessment tools were systematically analyzed based on their evaluation criteria, output format, scoring system, advantages, and limitations. The following table provides a comprehensive comparison of these tools:
Table 2: Comprehensive Comparison of 15 Greenness Assessment Tools
| Tool Name | Year | Evaluation Criteria | Output Format | Scoring System | Primary Advantages | Main Limitations |
|---|---|---|---|---|---|---|
| NEMI [34] | 2000s | 4 basic criteria: toxicity, waste, corrosivity, hazardousness | Pictogram (quadrant circle) | Binary (pass/fail per criterion) | Simple, user-friendly | Lacks granularity; doesn't assess full workflow |
| Analytical Eco-Scale [34] | 2012 | Hazardous reagents, energy, waste | Numerical score | Penalty points subtracted from 100 | Quantitative; enables direct comparison | Subjective penalty assignment; no visual component |
| GAPI [34] | 2018 | Entire analytical process: sampling to detection | 5-part color-coded pictogram | Qualitative (green-yellow-red) | Comprehensive; visual identification of impact stages | No overall score; somewhat subjective color assignment |
| AGREE [34] | 2020 | 12 GAC principles | Circular pictogram + numerical | 0-1 scale | Comprehensive; user-friendly; combines visual and numerical | Doesn't fully account for pre-analytical processes |
| AGREEprep [33] [34] | 2022 | 10 sample preparation criteria | Pictogram + numerical | 0-1 scale | First dedicated sample prep tool; visual + quantitative | Must be used with broader tools for full method evaluation |
| ComplexGAPI [34] | 2022 | Includes pre-analytical processes | Extended pictogram | Qualitative (green-yellow-red) | Broader scope including preliminary steps | Complex pictogram; no cumulative score |
| MoGAPI [34] | 2023 | Enhanced GAPI criteria | Modified pictogram | Cumulative scoring | Improved comparability and clarity | Still under development and validation |
| AGSA [34] | 2025 | Multiple green criteria including toxicity, waste, energy | Star-shaped diagram | Integrated scoring system | Intuitive visualization; combined scoring | New tool with limited application history |
| CaFRI [34] | 2025 | Carbon emissions across method stages | Numerical score + assessment | Emission reduction percentage | Addresses climate impact specifically | Narrow focus on carbon footprint only |
| BAGI [73] | 2023 | 10 practicality criteria | Star pictogram + numerical | 25-100 scale | Assesses practical and economic aspects | Doesn't address environmental impact |
| RAPI [73] | 2025 | 10 analytical performance criteria | Star pictogram + numerical | 0-100 scale | Focuses on validation and performance parameters | Doesn't address environmental impact |
| RGB Model [73] | 2021 | Combined green, practical, performance criteria | Color-coded diagram | Qualitative color balance | Holistic assessment of all three aspects | Complex application; requires multiple assessments |
| AMVI [34] | 2015 | Solvent and reagent volumes | Numerical value | Volume per analysis | Simple, focused on material consumption | Narrow scope; excludes toxicity, energy, waste |
| SPMS [73] | 2022 | Sample preparation sustainability | Numerical score | Multi-criteria scoring | Focused on sample preparation | Requires complementary tools for full assessment |
| ChlorTox Scale [73] | 2023 | Chloroform-oriented toxicity | Numerical score | Toxicity estimation | Specific to chloroform toxicity | Very narrow application scope |
Specialized Tools for Comprehensive Method Evaluation
Beyond traditional greenness assessment, the White Analytical Chemistry framework has driven development of complementary tools evaluating other method attributes. The Red Analytical Performance Index (RAPI) addresses the "red" component of WAC by assessing analytical performance against ten validation parameters, including repeatability, intermediate precision, linearity, accuracy, sensitivity, and other figures of merit [73]. Similarly, the Blue Applicability Grade Index (BAGI) evaluates the "blue" component through ten practicality criteria such as throughput, cost, operational simplicity, and availability of instrumentation [73]. These tools use star-shaped pictograms with color intensity representing performance level, creating visual consistency across the WAC evaluation spectrum.
The integration of RAPI and BAGI with greenness assessment tools enables truly holistic method evaluation. This comprehensive approach acknowledges that environmental sustainability must be balanced with analytical robustness and practical feasibility for successful method implementation [73]. The simultaneous application of these tools provides researchers with a complete profile of a method's strengths and weaknesses across all three WAC dimensions, supporting more informed decision-making in method selection and optimization.
Methodological Protocols for Tool Application
Standardized Assessment Methodology
Implementing greenness assessment requires a systematic approach to ensure consistent and comparable results. The following workflow provides a standardized protocol for comprehensive method evaluation:
For each assessment tool, specific evaluation protocols must be followed:
AGREE Application Protocol:
- Access the AGREE software (open-source)
- Input data for all twelve principles of GAC
- Assign appropriate scores for each criterion based on method characteristics
- Generate the circular pictogram and numerical score
- Interpret results: scores >0.75 indicate high greenness, scores <0.5 indicate poor environmental performance [34]
GAPI/MoGAPI Application Protocol:
- Identify the five stages of the analytical method: sample collection, preservation, preparation, instrumental analysis, and final determination
- For each sub-category within the stages, assign color codes: green (favorable), yellow (moderate), red (unfavorable)
- Complete the five-segment pictogram
- For MoGAPI, calculate the cumulative score based on the color assignments [34]
RAPI/BAGI Application Protocol:
- Access the respective open-source software (mostwiedzy.pl/rapi or mostwiedzy.pl/bagi)
- Select appropriate options from drop-down menus for each of the ten criteria
- Software automatically generates scores (0-100 for RAPI, 25-100 for BAGI)
- Interpret the star pictogram with color intensity mapping to performance level [73]
Case Study: Comparative Assessment of SULLME Method
A recent case study evaluating the Sugaring-Out-Induced Homogeneous Liquid-Liquid Microextraction (SULLME) method for determining antiviral compounds demonstrates the complementary nature of multiple assessment tools [34]. The method was evaluated using MoGAPI, AGREE, AGSA, and CaFRI, providing a multidimensional perspective on its environmental profile:
MoGAPI assigned a score of 60/100, highlighting strengths in green solvent use and microextraction technology, but noting weaknesses in waste generation (>10 mL per sample) and use of moderately toxic substances [34].
AGREE produced a score of 56/100, recognizing benefits of miniaturization and absence of derivatization, while identifying limitations in throughput (2 samples/hour) and operator safety concerns [34].
AGSA awarded 58.33/100, praising semi-miniaturization but criticizing manual handling and lack of waste management protocols [34].
CaFRI scored the method at 60/100, acknowledging relatively low energy consumption (0.1-1.5 kWh per sample) but highlighting absence of renewable energy sources and long-distance transportation impacts [34].
This case study demonstrates how applying multiple assessment tools provides a more nuanced understanding of a method's environmental profile, revealing both consistent findings across tools and unique insights from specific metrics.
Essential Research Reagent Solutions for Green Analytical Chemistry
The implementation of greenness principles requires specific reagents and materials that reduce environmental impact while maintaining analytical performance. The following table details key solutions for greening analytical methods:
Table 3: Essential Research Reagent Solutions for Green Analytical Chemistry
| Reagent/Material Category | Specific Examples | Green Function | Application Context |
|---|---|---|---|
| Natural Solvents | Ethanol, water, limonene, ethyl lactate | Replace hazardous organic solvents | Extraction, chromatography, sample preparation |
| Bio-Based Reagents | Enzymes, biosurfactants, chitosan | Renewable, biodegradable alternatives | Sample digestion, matrix separation, complexation |
| Ionic Liquids | Imidazolium, phosphonium, choline-based | Low volatility, recyclable, tunable properties | Extraction, chromatography, electrochemistry |
| Deep Eutectic Solvents (DES) | Choline chloride-urea, menthol-fatty acids | Biodegradable, low toxicity, preparable from natural compounds | Extraction, sample preparation, media for synthesis |
| Solid-Phase Microextraction Phases | PDMS, polyacrylate, divinylbenzene fibers | Solvent-free extraction, reusability | Sample preparation, concentration, clean-up |
| Nanomaterials | Magnetic nanoparticles, graphene oxide, MOFs | Enable miniaturization, enhance efficiency | Sorbents, catalysts, detection enhancers |
| Green Derivatizing Agents | Water-compatible reagents, microwave-assisted | Reduce toxicity, decrease reaction time | Analyte modification for detection enhancement |
The comprehensive analysis of 15 greenness assessment tools reveals a rapidly evolving landscape with increasing specialization and sophistication. Early tools provided basic binary assessments, while contemporary metrics offer integrated visual and quantitative outputs that evaluate the complete analytical workflow. The development of specialized tools like AGREEprep for sample preparation and CaFRI for carbon footprint assessment demonstrates the field's maturation in addressing specific environmental impact domains.
The SIGNIFICANCE mnemonic and 12 GAC principles continue to provide the foundational framework for tool development, ensuring that assessments remain aligned with core green analytical concepts. The emergence of complementary tools like RAPI and BAGI within the White Analytical Chemistry framework represents a significant advancement, enabling balanced evaluation of environmental, performance, and practical method attributes.
For researchers and method developers, selecting appropriate assessment tools requires careful consideration of evaluation goals, methodological characteristics, and desired output formats. Comprehensive tools like AGREE and GAPI provide broad environmental assessments, while specialized tools offer targeted evaluations of specific method aspects. The case study analysis demonstrates that applying multiple complementary tools generates the most complete environmental profile, revealing both strengths and improvement opportunities.
As Green Analytical Chemistry continues to evolve, assessment tools will likely incorporate more lifecycle considerations, artificial intelligence integration, and standardized validation protocols. These advancements will further enhance the objectivity, comparability, and practical utility of greenness assessment in promoting sustainable analytical practices across research and industrial applications.
Practical Guide to Using AGREE and GAPI for Method Validation
The adoption of Green Analytical Chemistry (GAC) principles has become imperative in modern laboratories, driven by the need to minimize the environmental impact of analytical practices. Among the various tools developed to quantify and benchmark the greenness of analytical methods, the Green Analytical Procedure Index (GAPI) and the Analytical GREEnness (AGREE) metric have emerged as two of the most comprehensive and widely accepted approaches. This guide provides a technical overview and detailed protocols for implementing these tools within the framework of method validation, particularly for researchers and scientists in pharmaceutical development and quality control. Proper application of these metrics enables objective assessment of method environmental performance, facilitates identification of areas for improvement, and supports the development of more sustainable analytical methodologies aligned with the SIGNIFICANCE mnemonic GAC principles.
The GAPI (Green Analytical Procedure Index) Framework
Core Principles and Structure
The Green Analytical Procedure Index (GAPI) is a multi-criteria assessment tool that provides a visual summary of an analytical method's environmental impact across its entire lifecycle. The tool employs five colored pentagrams, each divided into several subsections that are colored green, yellow, or red according to the degree of greenness for that particular aspect [74]. These pentagrams collectively evaluate critical stages including sample collection, transportation, storage, preparation, instrumentation, and final determination. This structured approach allows researchers to quickly identify which stages of their method have the highest environmental impact and prioritize improvements accordingly.
Unlike single-score metrics, GAPI's visual design provides immediate insight into the distribution of environmental impacts throughout the analytical procedure. However, a significant limitation of the traditional GAPI tool is that it does not provide a total numerical score that would enable direct quantitative comparison between different methods [74]. This gap has led to the development of modified versions, including the recently introduced Modified GAPI (MoGAPI), which incorporates a scoring system while retaining the visual advantages of the original framework [74].
Practical Application Protocol
Data Collection and Parameter Identification
To conduct a GAPI assessment, begin by systematically documenting all aspects of your analytical method. Create a detailed inventory that includes: sample collection method (in-line, online, or offline), preservation requirements, transportation needs, storage conditions, sample preparation techniques (including extraction methods and any derivatization steps), reagents and solvents used (including quantities and hazard classifications), instrumentation requirements, energy consumption, and waste generation [74] [75]. For example, in the assessment of an LC-MS/MS method for pesticide residues in mango fruit drink, researchers documented the use of citrate-buffered QuEChERS extraction with anhydrous MgSO₄ clean-up, which influenced the greenness rating of the sample preparation step [75].
Assessment and Pictogram Generation
For each of the five pentagrams in the GAPI tool, evaluate the corresponding method parameters against the GAPI criteria. Assign colors based on the following general scheme: green for environmentally friendly practices (e.g., in-line measurements, minimal solvent use, negligible waste), yellow for moderate impact practices, and red for practices with significant environmental concerns (e.g., high energy consumption >1.5 kWh per sample, large volumes of hazardous solvents, substantial waste generation) [74] [75]. The complete colored pictogram provides an at-a-glance overview of the method's environmental profile, with the ideal outcome being predominantly green sections across all pentagrams.
Interpretation and Optimization
Analyze the completed GAPI pictogram to identify sections with yellow or red coloring, which represent opportunities for method greening. For instance, if the reagent/solvent pentagram shows red coloring for toxicity, consider replacing hazardous solvents with safer alternatives. If the energy consumption section is red, evaluate opportunities to reduce analysis time or employ more energy-efficient instrumentation. The GAPI assessment of a micellar organic-solvent free HPLC method for determination of Ertapenem and Meropenem demonstrated predominantly green characteristics, highlighting the environmental advantages of eliminating organic solvents from the mobile phase [76].
Advanced Implementation: MoGAPI Tool
The recently developed Modified GAPI (MoGAPI) addresses the key limitation of traditional GAPI by introducing a quantitative scoring system alongside the visual assessment [74]. This tool calculates scores based on the number of options available in each assessment item, with maximum credits assigned to the greenest options. For example, in sample collection, in-line collection receives 3 credits, online collection receives 2 credits, and offline collection receives 1 credit [74]. The total credits are summed and divided by the maximum possible credits to calculate a percentage score, enabling direct comparison between methods.
The MoGAPI tool classifies methods into three categories: excellent green (≥75), acceptable green (50-74), and inadequately green (<50), similar to the classification used in the analytical Eco-Scale [74]. The software for MoGAPI is freely available as open source at bit.ly/MoGAPI, providing researchers with an accessible tool for standardized greenness assessment. Case studies have demonstrated consistent results between MoGAPI and AGREE assessments, validating the reliability of this modified approach [74].
The AGREE (Analytical GREEnness) Metric System
Foundation and Calculation Methodology
The AGREE metric is a comprehensive assessment tool that evaluates analytical methods against the 12 principles of Green Analytical Chemistry. Unlike GAPI, AGREE provides a single numerical score between 0 and 1, with 1 representing ideal adherence to all GAC principles [77]. The calculation incorporates weighted criteria, acknowledging that some environmental impacts are more significant than others. The result is presented as a circular pictogram with twelve sections, each corresponding to one GAC principle, with the overall score displayed in the center [77]. This intuitive visualization quickly communicates both the total score and the performance across individual principles.
The AGREE assessment considers multiple factors including temperature and pressure requirements, use of hazardous chemicals, waste generation, energy consumption, throughput, operator safety, and the need for sample pretreatment [78]. Each criterion is scored based on its degree of compliance with ideal green practices, with the scores then weighted and combined into the final assessment. For example, in the assessment of an RP-HPLC method for COVID-19 antivirals, the method achieved an AGREE score of 0.70, indicating good environmental performance [78].
AGREE Application Workflow
AGREE Assessment Methodology Workflow
Method Parameterization
Initiate the AGREE assessment by compiling a complete inventory of all method components and their characteristics. This includes quantifying the types and amounts of all solvents, reagents, and materials; determining energy consumption per sample (including both direct instrument usage and auxiliary requirements); calculating waste generation and disposal methods; evaluating operator safety considerations; assessing sample throughput and analysis time; and identifying any derivatization or pretreatment requirements [77]. For example, when assessing the greenness of a micellar HPLC method for carbapenem antibiotics, researchers specifically documented the use of sodium lauryl sulfate and Brij-35 in water instead of traditional organic solvents, which significantly improved the method's AGREE score [76].
Scoring and Weighting
Each of the twelve GAC principles is scored between 0 and 1, with higher scores indicating better compliance. The AGREE approach then applies weighting factors to each principle, recognizing that some environmental impacts are more significant than others [77]. For instance, the use of hazardous solvents typically carries greater weight than minor energy consumption differences. The freely available AGREE software facilitates this calculation, automatically applying the weighting factors and generating the final pictogram after the user inputs the method parameters.
Pictogram Interpretation
The output is a circular pictogram divided into twelve segments, each representing one GAC principle. The color of each segment ranges from red (poor compliance) to green (excellent compliance), providing immediate visual feedback on method performance across all principles. The overall score displayed in the center serves as a quantitative metric for comparison between methods. For methods with multiple sample preparation options, the AGREEprep extension specifically focuses on the sample preparation step, offering more granular assessment of this particularly impactful stage of analysis [77].
AGREEprep for Sample Preparation Assessment
AGREEprep is a specialized tool designed specifically for evaluating the greenness of sample preparation methods, based on ten principles of green sample preparation [77]. It calculates scores on a 0-1 scale and generates a pictogram similar to AGREE but focused exclusively on sample preparation aspects. The criteria include the choice between in-situ vs. ex-situ preparation, solvent and reagent safety, material sustainability, waste minimization, sample and reagent amounts, throughput, automation, energy consumption, and operator safety [77].
In application examples, AGREEprep has demonstrated its utility in differentiating between sample preparation approaches. For instance, when assessing procedures for determining phthalate esters in water, traditional liquid-liquid extraction with dichloromethane scored significantly lower (0.27) than modern approaches like stir-bar sorptive extraction (0.82), clearly highlighting the environmental advantages of the newer technique [77]. This specialized tool is particularly valuable for methods where sample preparation represents the most significant environmental impact.
Comparative Analysis of Greenness Assessment Tools
Tool Selection Guide
Table 1: Comparison of Green Assessment Metric Tools
| Tool | Assessment Scope | Scoring System | Key Advantages | Common Applications | Software Availability |
|---|---|---|---|---|---|
| GAPI | Entire analytical method | Qualitative (color-based) | Visual impact identification of problematic steps | HPLC/LC-MS methods [76] [75], pharmaceutical analysis | Manual assessment |
| MoGAPI | Entire analytical method | Quantitative (0-100%) + qualitative | Combines visual assessment with comparative scoring | Method comparison and optimization [74] | Free software (bit.ly/MoGAPI) [74] |
| AGREE | Entire analytical method | Quantitative (0-1) + qualitative | Comprehensive evaluation against 12 GAC principles | Method development validation [78] | Free downloadable software [77] |
| AGREEprep | Sample preparation only | Quantitative (0-1) + qualitative | Specialized focus on sample preparation impact | Sample preparation optimization [77] | Free downloadable software [77] |
| Analytical Eco-Scale | Entire analytical method | Quantitative (0-100) | Simple penalty-point system, easy calculation | Initial method screening [74] | Manual calculation |
Complementary Tool Applications
These greenness assessment tools are not mutually exclusive; rather, they offer complementary perspectives on method environmental performance. A comprehensive greenness evaluation might employ multiple tools to gain different insights: AGREE for an overall score benchmarked against GAC principles, GAPI for visual identification of problematic steps, and AGREEprep for detailed optimization of sample preparation [74] [77]. For example, in the development of an RP-HPLC method for simultaneous determination of five COVID-19 antiviral drugs, researchers employed both AGREE (score: 0.70) and MoGAPI (score: 70%) to provide complementary validation of the method's greenness [78].
The choice of tool depends on the specific assessment goals. For method development, GAPI is particularly valuable for identifying improvement opportunities through its visual output. For method comparison or certification, AGREE provides a standardized quantitative score. For methods with complex sample preparation, AGREEprep offers specialized assessment of this critical step. Regulatory submissions may benefit from including multiple assessments to provide comprehensive evidence of environmental consideration.
Case Studies and Experimental Protocols
Case Study 1: Micellar HPLC for Antibiotic Analysis
A green analytical method was developed for the simultaneous determination of Ertapenem and Meropenem using a micellar organic-solvent free HPLC approach [76]. The method employed sodium lauryl sulfate (25 mM) and Brij-35 (17 mM) in water at pH 2.5 as the mobile phase, completely eliminating organic solvents. Separation was achieved in <8 minutes using a monolithic RP-C18 column at 40°C with UV detection at 305 nm.
The greenness assessment using GAPI demonstrated significantly better environmental performance compared to conventional HPLC methods using organic solvents [76]. The method showed predominantly green characteristics in the GAPI pictogram, particularly in the reagent toxicity, waste generation, and energy consumption sections. The successful application to pharmaceutical formulations confirmed that the green approach did not compromise analytical performance, with linearity ranges of 5-100 µg/mL for Meropenem and 10-100 µg/mL for Ertapenem, and percentage recoveries ranging from 97.5 to 100.8% for both drugs [76].
Case Study 2: LC-MS/MS for Pesticide Multi-Residues
Researchers developed a robust LC-ESI-MS/MS method for the identification and quantification of 103 fortified pesticides in mango fruit drinks [75]. The sample preparation employed 5 mL dilution and citrate-buffered QuEChERS extraction with anhydrous MgSO₄ clean-up, which provided acceptable recovery for 100 pesticides at 1 µg/mL fortification. The method was validated according to SANTE guidelines (SANTE/11813/2021), with 95, 91, and 77 pesticides satisfactorily recovered at 0.1, 0.05, and 0.01 µg/mL fortification levels respectively.
The GAPI assessment conducted for this method indicated it was "much greener than other contemporary methods" [75]. The greenness was attributed to several factors: minimized solvent consumption through optimized QuEChERS extraction, reduced sample requirements, high throughput capability, and minimized waste generation. The method demonstrated that comprehensive multi-residue analysis could be performed with significantly reduced environmental impact compared to traditional approaches, without compromising analytical performance.
Case Study 3: RP-HPLC for COVID-19 Antivirals
A reversed-phase HPLC method was developed for the simultaneous determination of five COVID-19 antiviral drugs: favipiravir, molnupiravir, nirmatrelvir, remdesivir, and ritonavir [78]. The chromatographic separation used a Hypersil BDS C18 column with an isocratic mobile phase of water and methanol (30:70 v/v, pH 3.0) at a flow rate of 1 mL/min with UV detection at 230 nm. The method achieved separation of all five compounds within 6 minutes.
The greenness was evaluated using multiple tools, providing a comprehensive environmental assessment [78]. The method achieved an AGREE score of 0.70, AGREEprep score of 0.59, and MoGAPI score of 70%, consistently indicating good environmental performance across different metrics. The strategic solvent selection (using methanol instead of more hazardous acetonitrile) and minimal sample preparation requirements contributed significantly to these scores. The method demonstrates that with careful optimization, conventional HPLC methods can achieve satisfactory greenness performance while maintaining analytical effectiveness.
Research Reagent Solutions and Materials
Table 2: Essential Reagents and Materials for Green Analytical Methods
| Category | Specific Materials | Green Characteristics | Application Examples | Environmental Advantage |
|---|---|---|---|---|
| Green Solvents | Water, methanol, ethanol, micellar solutions [76] | Low toxicity, biodegradable | Mobile phase in HPLC [76] [78], extraction solvents | Reduced hazardous waste, safer disposal |
| Alternative Sorbents | Primary Secondary Amine (PSA), C18, anhydrous MgSO₄ [75] | Reduced quantity requirements, higher efficiency | QuEChERS sample preparation [75] | Minimized material consumption, less waste |
| Sample Preparation Materials | Trisodium citrate dehydrate, disodium hydrogen citrate [75] | Lower toxicity alternatives | Buffered QuEChERS extraction [75] | Safer handling, reduced environmental persistence |
| Chromatographic Columns | Monolithic columns [76], core-shell technology | Faster separations, lower pressure | Rapid HPLC analysis [76] | Reduced solvent consumption, lower energy use |
| Catalysts/Reagents | Enzymes, biodegradable catalysts | Renewable, biodegradable | Derivatization reactions | Reduced hazardous waste generation |
Strategic Implementation Framework
Successfully integrating greenness assessment into analytical method development requires a systematic approach. The following roadmap provides a structured framework:
Assessment Integration: Incorporate GAPI and AGREE evaluations at each stage of method development, not as an afterthought. This proactive approach identifies green improvement opportunities early in the development process.
Tool Selection: Choose appropriate metrics based on assessment goals. Use GAPI for visual identification of problematic steps during development, AGREE for final method scoring and comparison, and AGREEprep for methods with complex sample preparation requirements.
Iterative Improvement: Use assessment results to drive continuous improvement. Target yellow and red sections in GAPI or low-scoring principles in AGREE for optimization in subsequent method iterations.
Documentation and Reporting: Include greenness assessment results in method validation reports and regulatory submissions. Multiple metrics (e.g., both AGREE and GAPI scores) provide comprehensive evidence of environmental consideration.
Knowledge Transfer: Train analytical staff on greenness principles and assessment tools to build organizational capability in sustainable method development.
The AGREE and GAPI metrics provide robust, complementary frameworks for quantifying and improving the environmental performance of analytical methods. As demonstrated through multiple case studies, these tools enable objective assessment, facilitate method optimization, and provide documented evidence of environmental consideration. The recent development of enhanced versions like MoGAPI and AGREEprep addresses specific limitations of earlier tools, offering increasingly sophisticated assessment capabilities.
For researchers and drug development professionals, mastery of these assessment tools is no longer optional but essential for responsible analytical practice. By systematically implementing GAPI and AGREE evaluations throughout method development and validation, scientists can significantly reduce the environmental footprint of analytical operations while maintaining, and often enhancing, analytical performance. The ongoing evolution of these tools promises even more sophisticated assessment capabilities, further advancing the integration of Green Analytical Chemistry principles into mainstream laboratory practice.
Linking GAC to White Analytical Chemistry (WAC) for a Balanced Assessment
The field of analytical chemistry has undergone a significant paradigm shift, moving from a primary focus on analytical performance to a more holistic view that incorporates environmental and practical considerations. Green Analytical Chemistry (GAC) emerged as a specialized application of the Twelve Principles of Green Chemistry, aiming to reduce the environmental impact of analytical processes by minimizing or eliminating hazardous substances, reducing waste generation, and improving energy efficiency [5]. While GAC provided crucial initial guidance for developing more sustainable analytical methods, its primary limitation lay in its predominant focus on environmental aspects, sometimes at the expense of analytical performance and practical applicability [5] [79].
White Analytical Chemistry (WAC) represents the next evolutionary stage, integrating and balancing the environmental aspects of GAC with analytical performance and practical/economic feasibility [5]. Introduced in 2021, WAC employs a color-coded model inspired by the Red-Green-Blue (RGB) color space, where "whiteness" indicates a method that successfully harmonizes all three dimensions [5] [79]. This framework addresses the critical need for a balanced assessment approach that does not sacrifice analytical capability for sustainability, nor overlook environmental concerns in pursuit of performance [80]. The transition from GAC to WAC marks a maturation in sustainable analytical practice, moving from compartmentalized environmental considerations to integrated method development and evaluation.
Core Concepts: GAC, WAC, and the RGB Model
The SIGNIFICANCE Mnemonic and GAC Principles
Green Analytical Chemistry is fundamentally guided by the SIGNIFICANCE mnemonic, which encapsulates its twelve core principles [5]:
- S - Select direct analytical technique
- I - Integrate analytical processes and operations
- G - Generate as little waste as possible and minimize treatment
- N - Never use large volumes of reagents or samples
- I - Implement automated and miniaturized methods
- F - Favor reagents from renewable sources
- I - Increase safety for operator
- C - Carry out in-situ measurements
- A - Avoid derivatization
- N - Note that sample preparation is often the bottleneck
- C - Combine methods with other techniques
- E - Eliminate or replace toxic reagents
These principles provide a comprehensive framework for reducing the environmental footprint of analytical methods, with particular emphasis on solvent toxicity, waste generation, energy consumption, and operator safety [45] [5].
The RGB Model and WAC Principles
White Analytical Chemistry expands upon GAC through its RGB model, which evaluates methods across three dimensions [5] [79]:
- Green Component (Environmental Impact): Incorporates the traditional GAC principles focused on environmental sustainability, including toxicity of reagents, amount of waste generated, energy consumption, and other direct ecological impacts.
- Red Component (Analytical Performance): Assesses analytical efficiency through parameters such as accuracy, precision, sensitivity, selectivity, linearity, robustness, and scope of application.
- Blue Component (Practical/Economic Factors): Evaluates practical considerations including cost-efficiency, time-efficiency, operational simplicity, equipment requirements, and potential for automation.
The core innovation of WAC lies in its balanced approach. Rather than prioritizing one dimension over others, it recognizes that a truly sustainable method must perform adequately while being practically feasible to implement [79]. A method is considered "white" when it achieves an optimal balance across all three dimensions, similar to how white light results from the balanced combination of red, green, and blue light [5].
Comparative Analysis: GAC versus WAC Frameworks
Fundamental Differences in Approach and Scope
The transition from GAC to WAC represents more than merely adding additional assessment criteria; it constitutes a fundamental shift in how analytical methods are conceptualized, developed, and evaluated. Where GAC primarily focuses on mitigating negative environmental externalities, WAC adopts a holistic framework that integrates analytical accuracy, environmental sustainability, and practical usability [5]. This distinction becomes particularly evident in method development and optimization processes, where WAC encourages simultaneous consideration of all three dimensions rather than sequential optimization.
Practical Implications for Method Development and Selection
The practical implications of these differing approaches significantly impact analytical practices in pharmaceutical development and other research settings. Under the GAC framework, methods might be selected or modified primarily for their environmental benefits, potentially compromising analytical performance or practical feasibility. In contrast, the WAC framework encourages the development of methods that simultaneously excel across all three dimensions, or strategically balance trade-offs where necessary [79]. For instance, a method might utilize slightly more energy but substantially reduce solvent waste while maintaining excellent analytical performance - an approach that would be viewed favorably under WAC but might present a complex evaluation under traditional GAC assessment.
Table 1: Comparative Analysis of GAC and WAC Frameworks
| Aspect | Green Analytical Chemistry (GAC) | White Analytical Chemistry (WAC) |
|---|---|---|
| Primary Focus | Environmental impact reduction | Balanced integration of analytical, environmental, and practical aspects |
| Core Principles | 12 principles encapsulated in SIGNIFICANCE mnemonic [5] | RGB model: Red (analytical performance), Green (environmental impact), Blue (practical/economic factors) [5] [79] |
| Assessment Scope | Primarily environmental factors (solvent toxicity, waste generation, energy consumption) [45] | Holistic evaluation including analytical performance, environmental impact, and practical feasibility [5] |
| Methodology Selection | Favors methods with minimal environmental footprint | Selects methods balancing performance, sustainability, and practicality [79] |
| Key Limitations | May compromise analytical performance for environmental benefits [5] | Requires more complex assessment; potential for trade-off justification [8] |
| Industry Application | Environmental monitoring; regulatory compliance | Pharmaceutical QC; method development; complex matrices [5] |
Assessment Tools and Metrics for GAC and WAC
Quantitative Assessment Tools and Their Applications
The evaluation of analytical methods against GAC and WAC principles has been facilitated by the development of specialized metric tools that provide both qualitative and quantitative assessments. These tools vary in their complexity, scope, and methodological approach, from simple qualitative scoring systems to sophisticated quantitative assessments [45]. For GAC assessment, prominent tools include the Analytical Eco-Scale, which uses a points-based system to rate compliance with GAC values [5], and the Green Analytical Procedure Index (GAPI), which employs a colored pictogram to assess environmental impact across multiple parameters [5] [81].
For WAC assessment, the RGB 12 algorithm has been developed as an Excel-based tool that evaluates methods against the twelve criteria of WAC, generating scores for each of the three dimensions [81]. Other significant tools include AGREE (Analytical GREEnness metric), which evaluates methods based on the 12 principles of green chemistry [5] [80], and BAGI (Blue Applicability Grade Index), which focuses on practical applicability aspects such as cost, time, and operational simplicity [81] [79]. The integration of Lifecycle Assessment (LCA) and Greenhouse Gas Inventories (GHGI) into these assessment frameworks provides opportunities for more rigorous and transparent environmental evaluations [5].
Experimental Protocol for Method Assessment
Implementing a comprehensive GAC-WAC assessment requires a systematic approach to data collection and evaluation. The following protocol outlines the key steps for conducting such an assessment:
Method Characterization: Document all method parameters including sample preparation, instrumentation, reagent consumption, energy requirements, waste generation, analytical performance characteristics, and operational requirements.
Data Collection for Quantitative Indicators:
- Measure electricity consumption using wattmeters for specific instruments during complete analytical cycles
- Calculate carbon footprint based on energy consumption and local emissivity data (gCO₂ kW−¹h−¹)
- Precisely quantify mass/volume of all reagents, solvents, and wastes generated
- Document total water consumption (tap, distilled, ultrapure)
- Record total analysis time including method preparation, calibration, and sample processing [8]
Tool-Specific Assessment:
- AGREEprep Evaluation: Input data corresponding to the 10 principles of Green Sample Preparation using available software tools, adjusting weighting factors if justified [81]
- BAGI Assessment: Evaluate practical applicability aspects through the designated criteria focusing on operational parameters [81]
- RGB 12 Algorithm: Input method parameters into the Excel template to generate scores for red, green, and blue components [81]
Comparative Analysis: Calculate overall scores for each tool and compare against benchmark methods or established thresholds.
Interpretation and Optimization: Identify weaknesses in each dimension and implement improvement strategies using Analytical Quality by Design (AQbD) and Design of Experiments (DoE) approaches [5].
Table 2: Key Metric Tools for GAC and WAC Assessment
| Tool Name | Assessment Focus | Output Type | Key Parameters Measured | Strengths | Limitations |
|---|---|---|---|---|---|
| Analytical Eco-Scale [5] | GAC | Numerical score (0-100) | Reagent toxicity, waste, energy consumption | Simple scoring system; clear thresholds | Limited scope; primarily environmental focus |
| GAPI/ComplexGAPI [5] [81] | GAC | Colored pictogram (5 areas) | Sample collection, preparation, storage, transportation, analysis | Comprehensive lifecycle assessment | Qualitative assessment; limited quantification |
| AGREE/AGREEprep [45] [81] | GAC | Pictogram with score (0-1) | 12 GAC principles; sample preparation steps | Quantitative score; customizable weights | Requires detailed method information |
| RGB 12 Algorithm [81] [79] | WAC | Three scores for R, G, B components | Analytical performance, environmental impact, practical feasibility | Holistic assessment; balanced approach | Complex implementation; newer tool |
| BAGI [81] [79] | Practical aspects | Numerical score with blue pictogram | Cost, time, operational simplicity, automation | Focuses on practical implementation | Does not address environmental or performance aspects alone |
The Scientist's Toolkit: Research Reagent Solutions for Sustainable Analytical Chemistry
Essential Materials for Green and White Analytical Methods
Implementing GAC and WAC principles requires not only methodological changes but also specific reagents, materials, and technologies that enable more sustainable practices while maintaining analytical performance. The following toolkit highlights key solutions that facilitate the transition toward greener and whiter analytical chemistry.
Table 3: Essential Research Reagent Solutions for GAC and WAC Implementation
| Tool/Reagent | Function in GAC/WAC | Application Examples | GAC/WAC Benefits |
|---|---|---|---|
| Microextraction Devices (SPME, MEPS, BAμE) [81] | Miniaturized sample preparation | UV filters in water; pharmaceutical analysis in biological matrices [81] | Reduces solvent consumption (Green); decreases cost and time (Blue) |
| Alternative Solvents (bio-based, recyclable) | Replacement of hazardous reagents | Liquid chromatography mobile phases; extraction solvents | Reduces toxicity and waste (Green); may improve operator safety (Green) |
| Fabric Phase Sorptive Extraction (FPSE) [79] | Solvent-free sample preparation | Pre-concentration of analytes from complex matrices | Eliminates solvent use (Green); simplified operation (Blue) |
| Magnetic Nanoparticles [79] | Dispersive solid-phase extraction | Water analysis; biological samples | Enables miniaturization (Green); improves extraction efficiency (Red) |
| Short and Narrow-Bore Chromatographic Columns [79] | Rapid separation with reduced solvent consumption | Pharmaceutical QC; metabolite profiling | Reduces solvent waste and analysis time (Green, Blue); maintains resolution (Red) |
| Automated Sample Preparation Systems | Integrated sample processing | High-throughput analysis; routine testing | Improves reproducibility (Red); reduces operator time (Blue); may optimize reagent use (Green) |
Implementation Strategies and Case Studies
Practical Framework for Implementing WAC
Successfully implementing White Analytical Chemistry requires a systematic approach that integrates WAC principles throughout the method development and validation process. The following strategies provide a practical framework for implementation:
Integrated Method Development with AQbD and DoE: Incorporate Analytical Quality by Design (AQbD) and Design of Experiments (DoE) methodologies to systematically optimize methods across all three WAC dimensions simultaneously. This approach enables identification of the design space where methods meet analytical requirements while maximizing greenness and practical feasibility [5].
Holocentric Assessment Protocol: Employ multiple assessment tools (AGREE, BAGI, RGB 12) to obtain a comprehensive evaluation of new methods, comparing them against existing approaches across all three dimensions [8].
Strategic Solvent and Technology Selection: Prioritize the use of alternative solvents and miniaturized technologies that simultaneously address multiple WAC dimensions, such as microextraction techniques that reduce solvent consumption while maintaining or improving analytical performance [81] [79].
Lifecycle Thinking Integration: Incorporate Lifecycle Assessment (LCA) and Greenhouse Gas Inventory (GHGI) considerations into method development to address environmental impacts beyond immediate laboratory operations [5].
Case Study: Pharmaceutical Method Development
A practical illustration of WAC implementation can be found in the development of a green RP-HPLC method for the simultaneous analysis of azilsartan, medoxomil, chlorthalidone, and cilnidipine in human plasma. Researchers employed a WAC-assisted AQbD strategy that systematically balanced the three dimensions [5]:
- Red Dimension: The method was validated for accuracy, precision, sensitivity, and selectivity, meeting all analytical performance criteria for bioanalytical applications.
- Green Dimension: Method optimization focused on reducing solvent consumption through gradient optimization, selecting less toxic mobile phase components, and minimizing waste generation.
- Blue Dimension: The procedure was designed for cost-effectiveness and operational simplicity, enabling practical implementation in routine analytical laboratories.
The resulting method achieved an excellent white WAC score, demonstrating that carefully designed methods can successfully balance all three dimensions without significant trade-offs [5].
Case Study: UV Filter Analysis in Water Samples
A comprehensive assessment of ten sample preparation methods for determining UV filters in water samples using gas chromatography demonstrated the practical application of WAC principles [81]. The study employed AGREEprep, BAGI, and RGB 12 tools to evaluate:
- Microextraction Techniques: Methods including SPME, DLLME, and SBSE were evaluated for their environmental performance (AGREEprep), practical applicability (BAGI), and overall balance (RGB 12).
- Conventional Techniques: Larger-scale methods such as solid-phase extraction (SPE) and liquid-liquid extraction (LLE) were assessed using the same metrics for comparison.
The results demonstrated that microextraction techniques generally showed superior performance in the WAC framework, particularly in balancing the green dimension (reduced solvent consumption and waste generation) with acceptable analytical performance and practical feasibility [81].
Emerging Trends and Future Directions
The evolution from GAC to WAC represents a significant advancement in sustainable analytical practices, but further developments are ongoing. Several emerging trends are likely to shape future implementations:
Green Financing for Analytical Chemistry (GFAC): The proposed GFAC model aims to create dedicated funding mechanisms specifically for innovations aligned with GAC and WAC goals, helping to bridge gaps in current practices and promote the development of sustainable analytical technologies [5].
Integration of Advanced Data Analytics: The incorporation of machine learning approaches, such as Quantitative Structure-Retention Relationship (QSRR) models, combined with AQbD principles shows promise for optimizing methods across all three WAC dimensions simultaneously [82].
Good Evaluation Practice (GEP) Guidelines: Increasing recognition of the need for standardized assessment protocols has led to proposals for Good Evaluation Practices that would improve the reliability and comparability of greenness and whiteness assessments [8].
Expansion of Assessment Boundaries: Future developments will likely incorporate more comprehensive lifecycle thinking and circular economy principles into analytical method assessment, moving beyond immediate laboratory impacts to consider broader environmental implications [5].
The transition from Green Analytical Chemistry to White Analytical Chemistry marks a critical evolution in how the analytical community approaches method development and evaluation. By integrating environmental, performance, and practical considerations into a unified framework, WAC addresses the fundamental limitation of GAC - the potential conflict between analytical capability and sustainability goals. The RGB model provides a conceptually sound and practically implementable framework for achieving truly balanced analytical methods that are environmentally responsible, analytically sound, and practically feasible.
The implementation of WAC principles, supported by the growing array of assessment tools and metrics, enables researchers and pharmaceutical professionals to develop methods that align with broader sustainability goals without compromising analytical integrity or practical utility. As the field continues to evolve, the integration of WAC principles throughout the method development lifecycle will be essential for advancing both analytical science and environmental stewardship in parallel.
Benchmarking and Communicating the Greenness of Your Analytical Methods
The pharmaceutical industry is increasingly prioritizing sustainability, driven by a greater awareness of the environmental impacts associated with drug development and manufacturing [83]. Green Analytical Chemistry (GAC) is a critical discipline within this movement, focused on minimizing the negative impacts of analytical procedures on human safety, human health, and the environment [84]. The core of GAC is embodied in the 12 principles of GAC, which provide a framework for designing safer, more efficient, and environmentally benign analytical methods [84]. Evaluating the greenness of an analytical method involves a holistic consideration of multiple factors, including the reagents used, sample collection and processing, instruments, energy consumption, and the quantities of hazardous materials and waste generated [84]. Effectively benchmarking and communicating this greenness is essential for driving continuous improvement and fostering the adoption of sustainable practices in laboratories worldwide. This guide provides a comprehensive technical framework for achieving these goals, specifically contextualized within the SIGNIFICANCE mnemonic for GAC principles.
Established Greenness Assessment Metrics
Several metrics have been developed to quantitatively evaluate the environmental impact of analytical methods. Two prominent, comprehensive metrics are the Analytical Method Greenness Score (AMGS) and the Greenness Evaluation Metric for Analytical Methods (GEMAM).
Analytical Method Greenness Score (AMGS)
The AMGS is a metric developed by the American Chemical Society's Green Chemistry Institute in collaboration with industry partners [83]. It is specifically designed to evaluate the environmental impact of chromatographic analytical methods across multiple dimensions. A key advancement of the AMGS is its unique inclusion of instrument energy consumption in its evaluation, alongside more traditional factors like the energy consumed in the production and disposal of solvents and their safety/toxicity profiles [83]. The adoption of AMGS allows organizations to systematically trend data and improve their sustainability profiles by reducing hazardous waste and promoting greener alternatives [83].
Greenness Evaluation Metric for Analytical Methods (GEMAM)
GEMAM is another comprehensive metric that bases its evaluation criteria on both the 12 principles of GAC and the 10 factors of green sample preparation [84]. This metric is noted for being simple, flexible, and comprehensive. The results of a GEMAM assessment are presented on a 0–10 scale, providing a clear, quantitative output. Furthermore, GEMAM results are often accompanied by a pictogram that conveys both qualitative (via color) and quantitative (via number) information, making the results easy to interpret and communicate [84].
Table 1: Comparison of Key Greenness Assessment Metrics
| Metric Name | Key Basis for Evaluation | Output Format | Unique Features / Focus |
|---|---|---|---|
| Analytical Method Greenness Score (AMGS) | Solvent & energy lifecycle, safety/toxicity [83] | Numerical Score | Includes instrument energy consumption; widely used in pharmaceutical industry [83] |
| Greenness Evaluation Metric for Analytical Methods (GEMAM) | 12 GAC principles & 10 sample preparation factors [84] | 0-10 scale with pictogram | Provides both qualitative (color) and quantitative (number) information [84] |
Metric Evaluation and Selection Protocol
Selecting the appropriate metric is a critical first step in the benchmarking process. The following protocol provides a detailed methodology for this evaluation, ensuring the chosen metric aligns with the laboratory's specific needs and the analytical method's characteristics.
Experimental Protocol for Metric Evaluation
Objective: To systematically compare and select the most appropriate greenness assessment metric for a given analytical method and organizational context.
Materials and Reagents:
- Documentation for the analytical method (e.g., SOP).
- Data on solvent consumption (type and volume).
- Data on energy consumption of instruments used.
- Safety Data Sheets (SDS) for all reagents.
- Waste generation logs.
- Access to published literature on GEMAM [84] and AMGS [83].
Methodology:
- Define Assessment Scope and Boundaries: Clearly delineate the stages of the analytical method to be assessed (e.g., from sample preparation to final analysis and waste disposal). This ensures a consistent and complete evaluation.
- Data Collection: Gather all quantitative and qualitative data required by the candidate metrics (AMGS and GEMAM). This includes, but is not limited to:
- Volumes and types of all solvents and reagents used.
- Energy consumption (in kWh) of all instruments over the method's runtime.
- Toxicity and hazard classifications for all chemicals (from SDS).
- Amount of waste generated, categorized by hazard type.
- Details on sample preparation techniques.
- Pilot Application: Apply both the AMGS and GEMAM metrics to the same, well-defined analytical method. Adhere strictly to the calculation procedures outlined for each metric.
- Evaluation of Feasibility: Document the time, expertise, and resources required to complete each assessment. Note the clarity of instructions and the ease of data acquisition.
- Evaluation of Outputs: Critically assess the outputs generated by each metric.
- Quantitative Resolution: Does the numerical score (e.g., GEMAM's 0-10 scale) provide sufficient granularity to differentiate between similar methods? [84]
- Communication Effectiveness: Is the output (pictogram, score) easily understandable by technicians, managers, and other stakeholders? GEMAM's pictogram is specifically designed for this purpose [84].
- Actionable Insight: Does the metric's output clearly indicate which aspects of the method are the least green, thereby guiding improvement efforts? For example, AMGS can highlight if energy consumption or solvent toxicity is the primary driver of environmental impact [83].
- Decision Matrix: Create a decision matrix weighted according to organizational priorities (e.g., communication clarity, technical depth, regulatory alignment) to make the final selection.
A Workflow for Comprehensive Greenness Benchmarking
The following workflow diagram, generated using Graphviz, outlines the logical sequence of steps for conducting a robust greenness assessment, from initial scoping to continuous improvement.
Diagram 1: Greenness assessment workflow
Visualization and Communication of Greenness Data
Effectively communicating the results of a greenness assessment is as crucial as the calculation itself. Adhering to data visualization best practices ensures that the message is clear and accessible to the target audience, which may include fellow researchers, management, and regulatory bodies.
Principles of Effective Data Visualization
- Know Your Audience and Message: Tailor the complexity and focus of the visualization to the viewer. A lab manager may need operational details, while an executive may require a high-level summary [85].
- Select Appropriate Visual Encodings: Exploit preattentive attributes (like position, length, and color) that the human brain processes rapidly and accurately [85]. For quantitative data, length and position are the most precise encodings, making bar and line charts excellent choices [85].
- Use Color Effectively: Color should be used purposefully to convey meaning, not merely for decoration. The choice of color palette should match the data type [85]:
- Qualitative Palette: For categorical data with no inherent order (e.g., different reagent names).
- Sequential Palette: For numeric data that has a natural ordering (e.g., greenness scores from low to high).
- Diverging Palette: For numeric data that diverges from a central value (e.g., comparing a method's score against a benchmark).
- Ensure Accessibility with Color Contrast: When using color to convey information in graphical objects or user interface components (like the elements of a pictogram), a minimum contrast ratio of 3:1 against adjacent colors is required by WCAG (Web Content Accessibility Guidelines) to ensure perceivability by users with moderately low vision [86]. This is critical for making your communications inclusive.
Experimental Protocol for Creating a GEMAM Pictogram
Objective: To create a visual pictogram that effectively communicates the greenness score of an analytical method as determined by the GEMAM metric.
Materials and Reagents:
- Final GEMAM score (on a 0-10 scale).
- Graphic design software (e.g., Adobe Illustrator, Inkscape, or even advanced presentation software).
- Access to a color contrast checker (e.g., the WebAIM Contrast Checker) [87].
Methodology:
- Choose a Base Shape: Select a simple, recognizable shape such as a circle or a hexagon to serve as the background of the pictogram.
- Map Score to Color: Define a color scale where the GEMAM score corresponds to a specific fill color for the base shape. For example:
- 0-3 (Poor): #EA4335 (Red)
- 4-6 (Moderate): #FBBC05 (Yellow)
- 7-10 (Excellent): #34A853 (Green)
- Add the Numerical Score: Place the numerical score (e.g., "7.5") prominently in the center of the shape.
- Verify Contrast: Use a contrast checker to ensure the contrast ratio between the text color (foreground) and the shape's fill color (background) meets accessibility standards. For large text (like a prominent score), a ratio of at least 3:1 is required [87] [86]. White (#FFFFFF) or a very dark gray (#202124) text will typically provide sufficient contrast against the strong colors suggested.
- Finalize and Label: Add a brief, descriptive label below the pictogram, such as "GEMAM Score," for clarity.
The Scientist's Toolkit: Essential Research Reagent Solutions
Transitioning to greener analytical methods often involves replacing traditional reagents with more sustainable alternatives and utilizing tools that minimize waste and energy use. The following table details key solutions and materials essential for implementing green chemistry principles in the laboratory.
Table 2: Essential Materials for Greener Analytical Methods
| Item / Solution | Function in Green Chemistry | Example & Rationale |
|---|---|---|
| Green Solvents | To replace hazardous, volatile, or persistent solvents used in extraction, separation, and analysis. | Switching from acetonitrile or methanol in HPLC to ethanol or water-based mobile phases reduces toxicity and environmental impact [83]. |
| Automated Sample Preparation Systems | To miniaturize procedures, reduce solvent consumption, improve precision, and lower energy use compared to manual methods. | Automated solid-phase extraction (SPE) or liquid handling systems can precisely handle microliter volumes, drastically cutting reagent use and waste generation. |
| Energy-Efficient Instrumentation | To perform separations and analyses with lower overall energy consumption, a key factor in metrics like AMGS [83]. | Utilizing modern UHPLC systems that operate at higher pressures and optimized flow rates can reduce run times and total energy use per sample. |
| Waste Segregation & Treatment Systems | To properly handle different waste streams for recycling, neutralization, or safe disposal, preventing environmental release. | Separate containers for halogenated vs. non-halogenated waste allow for specialized treatment, reducing hazardous impact. |
| Metric Calculation Software / Spreadsheets | To provide a structured, automated framework for collecting data and calculating complex greenness scores like AMGS or GEMAM. | Internal tools, as developed by AstraZeneca for AMGS, help trend data and facilitate continuous process verification [83]. |
| Color Contrast Checker | To ensure that any visual outputs (pictograms, charts) are accessible to all audiences, including those with low vision. | Using an online tool like the WebAIM Contrast Checker verifies that color pairs meet WCAG guidelines (e.g., 3:1 ratio for graphical objects) [87] [86]. |
The systematic benchmarking and communication of method greenness are no longer optional but integral to sustainable scientific progress in drug development and beyond. By leveraging established and comprehensive metrics like GEMAM and AMGS, laboratories can move from vague intentions to quantitative, actionable data. The structured protocols for evaluation, visualization, and reagent selection outlined in this guide provide a clear pathway for researchers and scientists to not only assess their current environmental footprint but also to drive meaningful improvements. Effectively communicating these results ensures that greenness becomes a key criterion in method selection, procurement, and innovation, ultimately protecting human health and the environment—the very core of the SIGNIFICANCE principles of Green Analytical Chemistry.
Conclusion
The SIGNIFICANCE mnemonic provides an indispensable framework for systematically integrating the 12 principles of Green Analytical Chemistry into pharmaceutical research and drug development. By moving from foundational understanding through practical application, troubleshooting, and rigorous validation, professionals can successfully design analytical methods that are not only environmentally responsible but also economically efficient and analytically sound. The future of pharmaceutical analysis lies in embracing these principles, supported by evolving metrics and tools like AGREE and GAPI, to align laboratory practices with global sustainability goals. This paradigm shift promises to drive innovation, enhance laboratory safety, reduce environmental footprint, and create a new standard of excellence in biomedical and clinical research.
References
- 1. HPLC 2025 Preview: The Road To Sustainable Analytical ... [https://www.chromatographyonline.com/view/hplc-2025-preview-the-road-to-sustainable-analytical-chemistry]
- 2. The Role of Green Chemistry in Generic Drug Development [https://www.drugpatentwatch.com/blog/the-role-of-green-chemistry-in-generic-drug-development-a-sustainable-approach-to-medicine/?srsltid=AfmBOoojDFLlmA2YGYtgVm7EYeUJ5_orQqJnyom2nCPZd_u4jbB5bqz6]
- 3. Green Analytical Chemistry—Recent Innovations [https://www.mdpi.com/2673-4532/6/1/10]
- 4. Green analytical chemistry: integrating sustainability into ... [https://pmc.ncbi.nlm.nih.gov/articles/PMC11772533/]
- 5. Green and white analytical chemistry: Advances ... [https://www.sciencedirect.com/science/article/abs/pii/S0022354925004599]
- 6. Recent application of green analytical chemistry: eco-friendly ... [https://fjps.springeropen.com/articles/10.1186/s43094-024-00658-6]
- 7. Green analytical chemistry metrics for evaluating the ... [https://pmc.ncbi.nlm.nih.gov/articles/PMC11697060/]
- 8. How to correctly evaluate greenness, whiteness and other ... [https://pubs.rsc.org/en/content/articlehtml/2025/gc/d5gc00615e]
- 9. Green Analytical Chemistry | Vol 13, June 2025 [https://www.sciencedirect.com/journal/green-analytical-chemistry/vol/13/suppl/C]
- 10. Applying green analytical chemistry for rapid analysis of ... [https://www.sciencedirect.com/science/article/pii/S187853521200295X]
- 11. Principles of Green Chemistry [https://greenchemistry.yale.edu/about/principles-green-chemistry]
- 12. Principles of green chemistry: building a sustainable future [https://link.springer.com/article/10.1007/s44371-025-00152-9]
- 13. Basics of Green Chemistry [https://www.epa.gov/greenchemistry/basics-green-chemistry]
- 14. DOZNTM3.0: A Quantitative Green Chemistry Evaluator for ... [https://www.sciencedirect.com/science/article/pii/S2772826925000744]
- 15. DOZN™ Quantitative Green Chemistry Evaluator [https://chemistryforsustainability.org/tools-metrics/dozntm-quantitative-green-chemistry-evaluator]
- 16. Twelve Principles of Green Chemistry [https://openbooks.lib.msu.edu/orgchemlabmanual/chapter/twelve-principles-of-green-chemistry/]
- 17. 12 Principles of Green Chemistry | Sustainability Global [https://sustainabilityglobal.org/12-principles-of-green-chemistry/]
- 18. The Twelve Principles of Green Chemistry: What it is, & ... [https://www.compoundchem.com/2015/09/24/green-chemistry/]
- 19. Research on the development of green chemistry ... [https://pmc.ncbi.nlm.nih.gov/articles/PMC4540131/]
- 20. Green chemistry and responsible research and innovation [https://www.sciencedirect.com/science/article/pii/S0959652624034607]
- 21. The 12 principles of green analytical chemistry and ... [https://www.sciencedirect.com/science/article/abs/pii/S0165993613001234]
- 22. Proper waste management can significantly reduce ... [https://joint-research-centre.ec.europa.eu/jrc-news-and-updates/proper-waste-management-can-significantly-reduce-greenhouse-gas-emissions-eu-2025-08-14_en]
- 23. Waste Reduction Model | US EPA [https://www.epa.gov/waste-reduction-model]
- 24. Green Analytical Chemistry in Pharmaceuticals (GAC) [https://www.nrigroupindia.com/green-analytical-chemistry-eco-friendly-drug-analysis/]
- 25. Navigating the Labyrinth: Stage-Gate and Integrated Risk ... [https://greenfieldchemical.com/2024/05/28/navigating-the-labyrinth-stage-gate-and-integrated-risk-management-for-successful-drug-development/]
- 26. Generic and Biosimilar Drugs Generate $408 Billion in ... [https://accessiblemeds.org/resources/press-releases/generic-biosimilar-drugs-generate-408-billion-savings-2022/]
- 27. Comparative effectiveness and costs of generic and brand ... [https://pmc.ncbi.nlm.nih.gov/articles/PMC4461091/]
- 28. Impact of changes in regulatory framework on approval of ... [https://pmc.ncbi.nlm.nih.gov/articles/PMC12016575/]
- 29. Healthcare & Pharma Logistics & Supply Chain at GAC [https://www.gac.com/sectors/healthcare]
- 30. Green Approaches to Sample Preparation Based on ... [https://pmc.ncbi.nlm.nih.gov/articles/PMC7180442/]
- 31. Green solvents and their role in modern sample ... [https://link.springer.com/article/10.1007/s44371-025-00325-6]
- 32. The ten principles of green sample preparation [https://www.sciencedirect.com/science/article/pii/S0165993622000139]
- 33. Comprehensive review of greenness, whiteness, and ... [https://www.sciencedirect.com/science/article/pii/S2772577425000060]
- 34. Assessing the Environmental Impact of Analytical Methods [https://www.chromatographyonline.com/view/the-green-component-assessing-the-environmental-impact-of-analytical-methods]
- 35. Solventless Microextration Techniques for Pharmaceutical ... [https://www.frontiersin.org/journals/chemistry/articles/10.3389/fchem.2021.785830/full]
- 36. Green microextraction methodologies for sample ... [https://www.sciencedirect.com/science/article/pii/S2772577422000222]
- 37. A Sustainable Approach to Green Sample Preparation and ... [https://www.chromatographyonline.com/view/a-sustainable-approach-to-green-sample-preparation-and-analytical-performance-using-hs-spme-gc-qtof-ms]
- 38. Green Analytical Approaches and Eco-Friendly Solvents [https://www.orientjchem.org/vol41no2/green-analytical-approaches-and-eco-friendly-solvents-advancing-industrial-applications-and-environmental-sustainability-a-comprehensive-review/]
- 39. Ionic Liquid Market Size, Trends, Share & Forecast Report ... [https://www.mordorintelligence.com/industry-reports/ionic-liquid-market]
- 40. Ionic Liquids Market Size to Hit USD 136.18 Million by 2034 [https://www.precedenceresearch.com/ionic-liquids-market]
- 41. Ionic liquids-based technologies as a sustainable agent for ... [https://www.sciencedirect.com/science/article/abs/pii/S2214714425004398]
- 42. The power of biobased solvents in paint, electronics, and ... [https://worldbiomarketinsights.com/the-power-of-biobased-solvents-in-paint-electronics-and-more/]
- 43. Bio-based Solvents Market Volume and Share 2034 [https://www.towardschemandmaterials.com/insights/bio-based-solvents-market]
- 44. Microwave-assisted extraction: Recent advances in ... [https://www.sciencedirect.com/science/article/pii/S2772826925000677]
- 45. Analytical chemistry in the era of sustainability: evaluating ... [https://www.sciencedirect.com/science/article/pii/S2214158825000182]
- 46. A comprehensive review of ultrasonic assisted extraction ... [https://www.sciencedirect.com/science/article/pii/S1350417723003589]
- 47. Recent advancement in ultrasound-assisted novel ... [https://pmc.ncbi.nlm.nih.gov/articles/PMC10541372/]
- 48. The impact of microwave-assisted organic chemistry on ... [https://pubmed.ncbi.nlm.nih.gov/11893546/]
- 49. Theory of Microwave Heating for Organic Synthesis [https://cem.com/microwave-chemistry/theory]
- 50. Microwave-assisted synthesis [https://wiki.anton-paar.com/en/microwave-assisted-synthesis/]
- 51. Process Efficiency and Energy Consumption during the ... [https://www.mdpi.com/1996-1073/14/22/7638]
- 52. Making waves: how ultrasound-targeted drug delivery is ... [https://pmc.ncbi.nlm.nih.gov/articles/PMC8978185/]
- 53. An overview of the current progress in green analytical ... [https://www.sciencedirect.com/science/article/abs/pii/S016599362300417X]
- 54. Flow Cytometry Protocol | Abcam [https://www.abcam.com/en-us/technical-resources/protocols/flow-cytometry-for-intracellular-and-extracellular-targets]
- 55. Flow Cytometry Experimental Process—Spectral versus ... [https://www.thermofisher.com/us/en/home/life-science/cell-analysis/flow-cytometry/flow-cytometry-learning-center/flow-cytometry-resource-library/flow-cytometry-methods/spectral-flow-cytometry-experimental-process.html]
- 56. Greenness evaluation metric for analytical methods and ... [https://pmc.ncbi.nlm.nih.gov/articles/PMC12318332/]
- 57. Green and sustainable evaluation of methods for sample ... [https://www.sciencedirect.com/science/article/pii/S277257742400034X]
- 58. Top Ten Ways to Avoid Greenwashing and Greenhushing ... [https://antigreenwashcharter.org/top-ten-ways-to-avoid-greenwashing-and-greenhushing-in-2025/]
- 59. Sensitivity Analysis Based New Numerical Approach with ... [https://link.springer.com/article/10.1007/s42835-023-01639-0]
- 60. Sensitivity Analysis - NCBI - NIH [https://www.ncbi.nlm.nih.gov/books/NBK126178/]
- 61. Green analytical chemistry metrics for evaluating the ... [https://www.sciencedirect.com/science/article/pii/S2095177924001102]
- 62. Application of Life Cycle Assessment in the pharmaceutical ... [https://www.sciencedirect.com/science/article/pii/S095965262401998X]
- 63. AGREE—Analytical GREEnness Metric Approach and ... [https://pmc.ncbi.nlm.nih.gov/articles/PMC7588019/]
- 64. Everything You Need to Know About LCA and Carbon ... [https://ecochain.com/blog/lca-and-carbon-footprint/]
- 65. Integrating life cycle assessment into green infrastructure [https://www.frontiersin.org/journals/sustainable-cities/articles/10.3389/frsc.2025.1601091/full]
- 66. Integrating life cycle assessment and ecodesign to improve ... [https://www.sciencedirect.com/science/article/pii/S2352550925000284]
- 67. How Life Cycle Assessment Supports Design Innovation [https://earthshiftglobal.com/blog/how-life-cycle-assessment-supports-design-innovation]
- 68. PMI-LCA Tool Development Challenge [https://acsgcipr.org/funding-awards/pmi-lca-tool-development-challenge/]
- 69. Comparison of the Greenness Assessment ... [https://www.mdpi.com/2673-4532/4/4/32]
- 70. GREENER Pharmaceuticals for More Sustainable Healthcare [https://pmc.ncbi.nlm.nih.gov/articles/PMC9476650/]
- 71. Ten principles for developing and implementing tools in the ... [https://www.sciencedirect.com/science/article/pii/S2352554125001299]
- 72. The 12 principles of green analytical chemistry and the ... [https://hero.epa.gov/hero/index.cfm/reference/details/reference_id/4963899]
- 73. Red analytical performance index (RAPI) and software [https://pubs.rsc.org/en/content/articlehtml/2025/gc/d4gc05298f]
- 74. Modified GAPI (MoGAPI) Tool and Software for the ... [https://www.mdpi.com/2673-4532/5/3/30]
- 75. Development, validation and a GAPI greenness assessment ... [https://pmc.ncbi.nlm.nih.gov/articles/PMC10703049/]
- 76. assessment using GAPI, AGREE and analytical Eco-scale ... [https://www.sciencedirect.com/science/article/abs/pii/S0026265X22010906]
- 77. AGREEprep – Analytical greenness metric for sample ... [https://www.sciencedirect.com/science/article/abs/pii/S016599362200036X]
- 78. Development and validation of a RP-HPLC method for ... [https://pmc.ncbi.nlm.nih.gov/articles/PMC12264094/]
- 79. White Analytical Chemistry: Balancing Performance ... [https://www.chromatographyonline.com/view/white-analytical-chemistry-balancing-performance-sustainability-and-practicality-in-modern-methods]
- 80. Integrating green and white analytical principles for ... [https://www.sciencedirect.com/science/article/pii/S2772577424000958]
- 81. A Comprehensive Assessment of Sample Preparation ... [https://www.mdpi.com/2076-3417/14/17/7690]
- 82. Recent applications of liquid chromatography-based ... [https://pubmed.ncbi.nlm.nih.gov/41176062/]
- 83. Utilisation of Analytical Method Greenness Score to drive ... [https://pubs.rsc.org/en/content/articlelanding/2025/gc/d5gc01574j]
- 84. Greenness evaluation metric for analytical methods and ... [https://www.sciencedirect.com/science/article/pii/S209517792500019X]
- 85. Designing Effective Data Visualizations [https://guides.library.jhu.edu/datavisualization/design]
- 86. Understanding Success Criterion 1.4.11: Non-text Contrast [https://www.w3.org/WAI/WCAG21/Understanding/non-text-contrast.html]
- 87. Contrast Checker [https://webaim.org/resources/contrastchecker/]