NEMI Assessment for Chromatography: A Practical Guide to Evaluating Method Greenness
This article provides a comprehensive guide to the National Environmental Methods Index (NEMI) for researchers, scientists, and drug development professionals using chromatographic techniques.
NEMI Assessment for Chromatography: A Practical Guide to Evaluating Method Greenness
Abstract
This article provides a comprehensive guide to the National Environmental Methods Index (NEMI) for researchers, scientists, and drug development professionals using chromatographic techniques. It covers the foundational principles of NEMI assessment, detailed methodological application to HPLC and HPTLC procedures, troubleshooting common implementation challenges, and comparative validation with other green chemistry metrics. By integrating NEMI within broader frameworks like White Analytical Chemistry and Quality by Design, this resource enables laboratories to quantitatively evaluate and improve the environmental sustainability of their analytical methods while maintaining analytical performance and regulatory compliance.
Understanding NEMI: Principles and Framework for Green Chromatography
Historical Development and Core Principles
The National Environmental Methods Index (NEMI) is one of the oldest and most established greenness assessment tools in analytical chemistry. It was developed in 2002 by the Methods and Data Comparability Board (MDCB) [1]. Its creation addressed a critical need: to provide a searchable database and a simple, visual system for evaluating the environmental impact of analytical procedures [2] [1].
NEMI emerged alongside the broader green chemistry movement, which gained formal structure with the publication of the 12 principles of green chemistry by Paul Anastas and others [3]. While these principles provided a framework for synthetic chemistry, analytical chemistry needed its own tailored metrics. NEMI filled this gap by offering a way for scientists to quickly assess and compare the environmental footprint of their methods, particularly those in chromatography laboratories which traditionally consumed large volumes of potentially hazardous solvents [3].
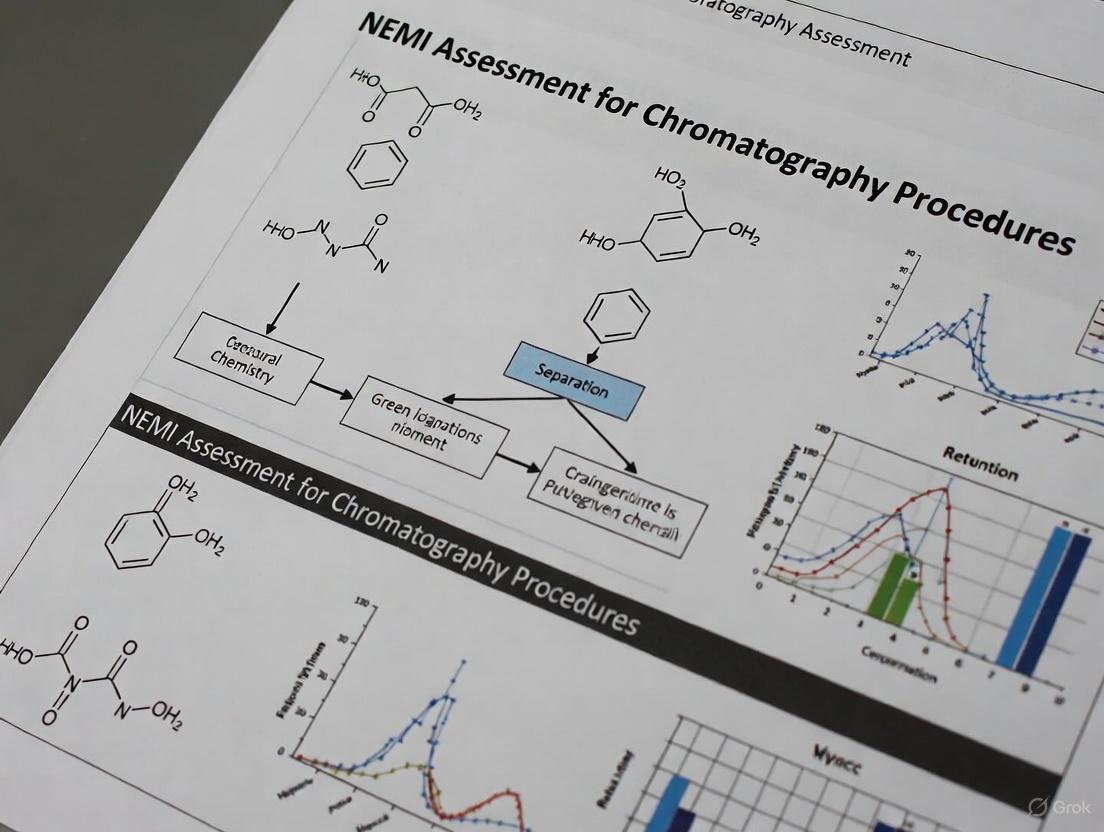
The core principle of NEMI is a simple, visual pictogram that allows for an at-a-glance assessment of a method's environmental impact. This pictogram is a circle divided into four quadrants, each representing a different criterion for environmental friendliness [2] [1]. A quadrant is colored green only if the method meets the specific criterion associated with it.
Table 1: The Four Criteria of the NEMI Pictogram
| Quadrant | Criterion | Requirement for Green Color |
|---|---|---|
| PBT | Persistent, Bio-accumulative, and Toxic | Chemicals used are not on the PBT list [1]. |
| Hazardous | Hazardous Waste | None of the reagents are listed on the D, F, P, or U hazardous wastes lists [1]. |
| Corrosive | Corrosive | The pH of the sample and reagents is between 2 and 12 [1]. |
| Waste | Waste Quantity | The total waste generated is 50 g or less per analysis [1]. |
Application in Chromatography: A Practical Workflow
The following diagram illustrates the logical process of applying the NEMI criteria to evaluate an analytical method, leading to the final pictogram.
NEMI Assessment Logical Workflow
Detailed Protocol for NEMI Assessment of a Chromatographic Procedure
Objective: To evaluate the greenness of a chromatographic method using the National Environmental Methods Index (NEMI).
Materials:
- Method Documentation: Complete standard operating procedure (SOP) for the chromatographic method.
- Chemical Inventory Lists: Access to official PBT and hazardous waste lists (e.g., from the US EPA).
- pH Meter: For verification if not specified in the method.
- Waste Calculation Tools: Data on solvent volumes and consumables.
Procedure:
Compile Method Parameters:
- List all chemicals, solvents, and reagents used in the analysis, including sample preparation and mobile phase composition.
- Record the exact pH of all final solutions as per the method.
- Calculate the total waste generated per single analysis run. This includes all solvents, sample preparation materials, and consumables.
Evaluate PBT Criterion (Quadrant 1):
- Cross-reference every chemical used against the official PBT (Persistent, Bio-accumulative, and Toxic) chemical list.
- Decision: If none of the chemicals are on the PBT list, this quadrant is colored green.
Evaluate Hazardous Criterion (Quadrant 2):
- Cross-reference every chemical against the "D", "F", "P", and "U" hazardous waste lists.
- Decision: If none of the reagents are present on these lists, this quadrant is colored green.
Evaluate Corrosive Criterion (Quadrant 3):
- Verify the pH of the final sample solution or analytical stream. If not explicitly stated, measure using a calibrated pH meter.
- Decision: If the pH is between 2 and 12 (inclusive), this quadrant is colored green.
Evaluate Waste Criterion (Quadrant 4):
- Sum the mass (in grams) of all waste produced in a single analytical run.
- Decision: If the total waste is ≤ 50 g, this quadrant is colored green.
Construct the NEMI Pictogram:
- Draw a circle and divide it into four equal quadrants.
- For each criterion above that is met, fill the corresponding quadrant with green.
- Leave any unmet criterion as a white/blank quadrant.
Interpretation: A method with all four quadrants green is considered the most environmentally friendly according to NEMI's criteria. The presence of one or more blank quadrants immediately highlights specific areas where the method has a higher environmental impact [2] [1].
Comparative Analysis with Other Green Assessment Tools
NEMI is often used alongside other greenness assessment tools to provide a more comprehensive profile. The following table summarizes how NEMI compares to other commonly used metrics.
Table 2: Comparison of NEMI with Other Green Assessment Tools
| Tool Name | Type of Output | Scope of Assessment | Key Advantage | Key Limitation |
|---|---|---|---|---|
| NEMI | Qualitative (Green/Blank quadrants) | Reagent hazard, corrosiveness, waste amount [1]. | Simple, fast, and provides an immediate visual summary [2] [1]. | Provides only general, qualitative information. Does not cover the entire analytical process (e.g., sample collection) [2] [4]. |
| Analytical Eco-Scale | Semi-quantitative (Score out of 100) | Reagents, energy, waste [2]. | Provides a total score, allowing for easier ranking of methods. An "excellent green analysis" score is >75 [2] [4]. | Penalty points are assigned by the user, which can introduce subjectivity [1]. |
| GAPI | Qualitative (Color-coded pentagon) | Comprehensive, covering all steps from sample collection to final determination [5] [4]. | More comprehensive than NEMI; evaluates the entire analytical procedure [2] [4]. | The pictogram is more complex to create and interpret than NEMI [4]. |
| AGREE | Quantitative (Score 0-1) + Visual | Comprehensive, based on all 12 principles of GAC [2] [1]. | Provides a quantitative score in the center of the pictogram, is digital, and easy to use [2]. | A more recent tool; may require specialized software for full implementation [1]. |
Essential Research Reagent Solutions
The following table details key reagents and materials frequently encountered in chromatography, along with their relevance to NEMI assessment.
Table 3: Key Reagents and Materials in Chromatographic Analysis
| Item | Function in Chromatography | Relevance to NEMI Assessment |
|---|---|---|
| Acetonitrile | Common organic modifier in Reversed-Phase HPLC mobile phases [3]. | Often a significant contributor to the "Hazardous" and "Waste" criteria due to its toxicity and the large volumes typically used [3]. |
| Methanol | Alternative organic modifier in mobile phases. | Generally considered less toxic than acetonitrile but still contributes to hazardous waste and overall waste volume [3]. |
| Chlorinated Solvents (e.g., Methylene Chloride) | Used in certain extractions and normal-phase chromatography [3]. | Highly likely to be listed as hazardous, often failing the "Hazardous" criterion. Their use is a major red flag in NEMI [3]. |
| Strong Acids/Bases (e.g., TFA, NaOH) | Used for pH adjustment in mobile phases or sample digestion. | Can push the pH outside the 2-12 range, causing the method to fail the "Corrosive" criterion [1]. |
| Solid Phase Extraction (SPE) Cartridges | For sample clean-up and pre-concentration of analytes. | Contribute to the physical waste generated, impacting the "Waste" criterion if the total mass exceeds 50 g per analysis [5]. |
| Micellar Solvents (e.g., SDS) | Used in Micellar Liquid Chromatography (MLC) as a green alternative [5]. | Can help methods pass the "Hazardous" and "PBT" criteria, making MLC a greener technique as assessed by NEMI [5]. |
The National Environmental Methods Index (NEMI) is one of the oldest and most established tools for evaluating the environmental impact of analytical procedures [1] [6]. Developed in 2002 by the Methods and Data Comparability Board, it provides a simple, pictorial system for assessing and comparing the greenness of analytical methods, including chromatography procedures [7] [8]. Its primary function is to offer researchers, scientists, and drug development professionals a mechanism to quickly evaluate whether their analytical methods adhere to fundamental environmental safety criteria [1]. The tool is freely accessible through the NEMI database (www.nemi.gov), which contains one of the largest collections of environmental analytical methods and serves as a valuable resource for method selection and development [6].
NEMI's significance lies in its ability to provide immediate, general information about the environmental impact of an analytical procedure through a simple visual representation [1]. Unlike more complex assessment tools that require detailed calculations and specialized software, NEMI offers a straightforward approach that enables rapid screening of methods for their environmental compliance [7]. This makes it particularly valuable during the initial stages of method development or when comparing multiple established procedures for routine use in pharmaceutical analysis and drug development [9].
The Four Quadrants of NEMI: Core Assessment Criteria
The NEMI assessment is visually represented by a circular pictogram divided into four quadrants, with each quadrant corresponding to a specific environmental criterion [8]. A quadrant is colored green only when the analytical method satisfies the requirement for that criterion. If the criterion is not met, the quadrant remains uncolored (blank) [1] [6]. This simple color-coding system allows researchers to quickly assess a method's environmental profile at a glance. The table below details the four core criteria that form the basis of NEMI's assessment framework.
Table 1: The Four Core Assessment Criteria of the NEMI Pictogram
| Quadrant | Criterion | Requirement for Green Coloring | Data Sources for Verification |
|---|---|---|---|
| 1 | PBT Chemicals | No chemicals used are Persistent, Bioaccumulative, and Toxic (PBT) | EPA's Toxic Release Inventory (TRI) PBT list [8] |
| 2 | Hazardous Chemicals | No solvents or reagents are classified as hazardous (Corrosive, Ignitable, Reactive, or Toxic) | EPA's Resource Conservation and Recovery Act (RCRA) lists (D, F, P, U) [1] [8] |
| 3 | Corrosivity | The pH of the sample solution remains between 2 and 12 throughout the procedure | Method documentation and reagent specifications |
| 4 | Waste Generation | The total amount of waste generated per analysis is less than 50 g | Calculation based on solvent volumes and consumables |
NEMI's Four-Quadrant Assessment Pictogram
Quadrant 1: PBT Chemicals
The first quadrant of the NEMI pictogram addresses the use of Persistent, Bioaccumulative, and Toxic (PBT) chemicals [8]. For this quadrant to be colored green, the analytical method must not utilize any reagents, solvents, or other chemicals that are listed on the Environmental Protection Agency's (EPA) Toxic Release Inventory (TRI) as PBT substances [1]. PBT chemicals are of particular environmental concern because they resist natural degradation, accumulate in living organisms, and exhibit toxicity even at low concentrations [1]. The presence of such chemicals in analytical methods poses long-term risks to ecosystems and human health, as they can persist in the environment and enter the food chain. When developing or evaluating chromatography methods, researchers must consult the TRI PBT list to verify that all mobile phase components, extraction solvents, and derivatization reagents are free from PBT-listed substances.
Quadrant 2: Hazardous Chemicals
The second quadrant evaluates the use of hazardous chemicals according to the EPA's Resource Conservation and Recovery Act (RCRA) [8]. This quadrant is colored green only if none of the chemicals used in the analytical procedure are classified as hazardous wastes under the RCRA categories D, F, P, or U [1]. These categories encompass a wide range of hazardous characteristics, including ignitability, corrosivity, reactivity, and toxicity [8]. Common organic solvents used in chromatography, such as acetonitrile, methanol, and chlorinated solvents, often fall into these hazardous categories [7]. To achieve a green rating for this quadrant, method developers should prioritize substituting hazardous solvents with safer alternatives, such as ethanol or water-based mobile phases, where analytically feasible [10].
Quadrant 3: Corrosivity (pH)
The third quadrant focuses on corrosivity, specifically the pH of solutions used throughout the analytical procedure [8]. This quadrant is colored green when the pH of all solutions remains between 2 and 12 during the entire analytical process [1]. Solutions with pH values outside this range (highly acidic or highly basic) are considered corrosive and pose special handling, disposal, and environmental concerns [7]. In chromatography applications, this criterion is particularly relevant during sample preparation steps, which may involve acid or base hydrolysis, pH adjustment for extraction efficiency, or sample clean-up procedures [11]. Method developers should aim to minimize the use of extreme pH conditions and consider neutral alternatives whenever possible to meet this criterion.
Quadrant 4: Waste Generation
The fourth and final quadrant addresses waste generation, a critical concern in analytical laboratories seeking to minimize their environmental footprint [8]. This quadrant is colored green when the total amount of waste produced per analysis is less than 50 grams [1]. Waste includes all solvents, reagents, consumables, and other materials that are disposed of after the analysis is complete [7]. For chromatography methods, this typically encompasses mobile phase waste, sample preparation solvents, and used columns or cartridges [10]. Strategies to reduce waste include miniaturizing methods, scaling down sample volumes, implementing solvent recycling systems, and extending column lifetime through proper maintenance [11] [10].
Experimental Protocol: Conducting a NEMI Assessment
Materials and Data Requirements
Table 2: Essential Research Reagents and Resources for NEMI Assessment
| Item | Function in NEMI Assessment | Examples/Specifications |
|---|---|---|
| Chemical Inventory | Document all reagents, solvents, and standards used | List all mobile phase components, extraction solvents, derivatization reagents, etc. |
| Safety Data Sheets (SDS) | Verify hazard classifications and physicochemical properties | Obtain latest SDS for all chemicals from manufacturers |
| EPA PBT List | Check for Persistent, Bioaccumulative, Toxic chemicals | Access via EPA's Toxic Release Inventory (TRI) |
| RCRA Hazardous Waste Lists | Identify regulated hazardous chemicals | Review RCRA D, F, P, and U lists (available online) |
| pH Measurement Tools | Verify solution pH meets corrosivity criterion | pH meter, indicators, or method documentation |
| Waste Tracking System | Quantify total waste generated per analysis | Record solvent volumes, consumables, and disposables |
Step-by-Step Assessment Procedure
Compile Complete Chemical Inventory: Create a comprehensive list of all chemicals used throughout the analytical procedure, including sampling, sample preparation, separation, and detection stages. Document the exact names, concentrations, and quantities of each chemical used per analysis [1] [8].
Evaluate PBT Status (Quadrant 1): Cross-reference each chemical from the inventory against the EPA's Toxic Release Inventory PBT list. If any chemical appears on this list, the first quadrant cannot be colored green. Document the PBT status of each substance for your assessment records [8].
Assess Hazard Classification (Quadrant 2): Review Safety Data Sheets for all chemicals and compare against the RCRA hazardous waste lists (D, F, P, U). Pay particular attention to sections addressing hazardous waste classification. If any chemical is classified as hazardous waste under these categories, the second quadrant remains uncolored [1] [8].
Verify pH Range (Quadrant 3): Identify all steps in the procedure where solution pH is relevant. This includes sample preparation, extraction, mobile phase preparation, and any pH adjustment steps. Measure or review documented pH values for these solutions. If all solutions maintain pH between 2 and 12 throughout the procedure, the third quadrant can be colored green [1].
Calculate Waste Generation (Quadrant 4): Quantify the total mass of waste generated per analysis. Include all solvents, reagents, sample materials, consumables, and any other disposables. Convert liquid volumes to mass using appropriate density values (approximately 1 g/mL for aqueous solutions). If the total waste is less than 50 g per analysis, the fourth quadrant qualifies for green coloring [8].
Construct Final NEMI Pictogram: Create the four-quadrant circle and color each quadrant based on the assessment results. Only those quadrants whose criteria are fully met should be colored green. The completed pictogram provides an immediate visual representation of the method's environmental performance [6].
NEMI in Practice: Application to Chromatography Methods
In pharmaceutical analysis, NEMI has been widely applied to assess the greenness of various chromatographic methods. For instance, a comparative study of liquid chromatographic methods for analyzing hydroxychloroquine in biological samples revealed a limitation of NEMI: all 18 evaluated methods received identical NEMI pictograms, suggesting it may lack the discriminative power for detailed comparisons between similar methods [7]. Similarly, an assessment of seven chromatographic methods for neurotransmitter analysis found that while NEMI provided a quick overview, it failed to differentiate effectively between methods, as all shared the same shortcomings in the PBT and hazardous chemical quadrants [6].
These applications highlight both the utility and limitations of NEMI in real-world scenarios. Its strength lies in providing a basic environmental screening tool that promotes awareness of key sustainability criteria among researchers [12]. However, its qualitative nature and limited scope mean it is often used alongside more comprehensive assessment tools like the Analytical Eco-Scale, GAPI, and AGREE for a more complete environmental profile [7] [1] [6].
Complementary Assessment Tools and Future Directions
While NEMI serves as an excellent introductory tool for greenness assessment, researchers should be aware of its limitations, including its qualitative nature and limited scope [1] [6]. For more comprehensive evaluations, several advanced metric tools have been developed:
- Analytical Eco-Scale (AES): A semi-quantitative tool that assigns penalty points for hazardous reagents, energy consumption, and waste generation, providing a numerical score where higher values indicate greener methods [7] [8].
- Green Analytical Procedure Index (GAPI): A more comprehensive visual tool that evaluates the entire analytical procedure across multiple stages, using a color-coded system to indicate environmental impact [7] [6].
- Analytical GREEnness (AGREE) Metric: A recently developed tool that incorporates all 12 principles of Green Analytical Chemistry, providing both a numerical score and a visual output for easier interpretation and comparison [10] [1].
The field of green analytical chemistry continues to evolve, with emerging concepts like White Analytical Chemistry (WAC) seeking to balance environmental, practical, and analytical criteria [13] [8]. For chromatography researchers, employing a combination of assessment tools—using NEMI for initial screening and more sophisticated metrics for comprehensive evaluation—represents the most robust approach to developing truly sustainable analytical methods.
NEMI's Role in the Green Analytical Chemistry (GAC) Landscape
Green Analytical Chemistry (GAC) has emerged as a critical subdiscipline focused on minimizing the environmental impact of analytical procedures while maintaining analytical performance. The field has evolved significantly since its inception in 2000, driven by growing environmental awareness and the need for sustainable laboratory practices [14]. Within this framework, the National Environmental Methods Index (NEMI) represents a foundational milestone as one of the first systematic tools developed to assess the environmental impact of analytical methods [15]. Established as a user-friendly pictogram, NEMI provides researchers with a straightforward mechanism to evaluate whether a method complies with four basic environmental criteria related to toxicity, waste, and safety [14]. Its simplicity and accessibility made it particularly valuable for initial greenness assessments in chromatographic method development, offering a starting point for what would become an increasingly sophisticated landscape of green metrics.
The introduction of NEMI marked a significant shift in how analytical chemists approach method development, encouraging early consideration of environmental factors alongside traditional performance parameters such as accuracy, precision, and sensitivity [5]. For chromatography professionals, NEMI provided a standardized approach to document and compare the environmental attributes of methods, fostering greater awareness of solvent toxicity, waste generation, and hazardous chemical usage [14]. While more comprehensive tools have since emerged, NEMI's establishment of core assessment criteria continues to influence the evolution of green chemistry metrics, making it an essential historical and practical component of the GAC landscape.
Core Principles and Assessment Methodology of NEMI
Fundamental Design and Structure
The NEMI assessment tool employs a simple, visual pictogram consisting of four quadrants, each representing a specific environmental criterion. A method is considered "green" for a particular criterion if it meets the established benchmark, indicated by a filled-in green quadrant in the pictogram. Conversely, if the method fails to meet the criterion, the quadrant remains blank, providing an immediate visual representation of the method's environmental performance [14]. This binary (yes/no) assessment approach makes NEMI particularly accessible for initial screening and comparative evaluations of analytical methods.
Detailed Assessment Criteria
Table 1: NEMI Assessment Criteria and Benchmark Values
| Criterion | Requirement for Green Status (Filled Quadrant) | Data Source |
|---|---|---|
| PBT (Persistent, Bioaccumulative, Toxic) | None of the reagents used are persistent, bioaccumulative, and toxic. | EPA's Toxic Substances Control Act (TSCA) list |
| Hazardous | None of the reagents appear on the TRI (Toxic Release Inventory) list as hazardous. | EPA's Toxic Release Inventory (TRI) list |
| Corrosive | pH remains between 2 and 12 during the entire analytical process. | Method documentation and reagent specifications |
| Waste | Total waste generated is ≤50 g per single analysis. | Calculation from method parameters |
The four quadrants of the NEMI pictogram evaluate the following aspects of an analytical method [14] [15]:
PBT (Persistent, Bioaccumulative, and Toxic): This quadrant is filled green only if none of the chemicals used in the method are classified as PBT substances according to the U.S. Environmental Protection Agency's Toxic Substances Control Act (TSCA) list. This criterion addresses long-term environmental impact.
Hazardous: This quadrant remains blank if any reagents are listed on the EPA's Toxic Release Inventory (TRI) as hazardous substances. It focuses on immediate toxicity and potential for harm.
Corrosive: This quadrant is filled green only if the pH throughout the analytical procedure remains between 2 and 12, ensuring that strongly acidic or basic conditions that could pose handling risks or environmental concerns are avoided.
Waste: This quadrant is filled green if the total waste generated per analytical sample is 50 grams or less. This criterion encourages method miniaturization and waste reduction.
The binary nature of this assessment provides clear, unambiguous feedback but lacks granularity in distinguishing between methods that share the same pictogram profile but may have different levels of environmental impact [14].
Experimental Protocol for Conducting a NEMI Assessment
Protocol 1: Standard NEMI Assessment for Chromatographic Methods
Purpose: To systematically evaluate the greenness profile of a chromatographic method (e.g., HPLC, UPLC) using the National Environmental Methods Index (NEMI) criteria.
Materials and Reagents:
- Detailed method procedure for the chromatographic analysis
- Safety Data Sheets (SDS) for all solvents, reagents, and chemicals used
- Method parameters (sample volume, mobile phase composition and volume, flow rate, run time)
- Access to EPA's TSCA and TRI lists (available online)
Procedure:
Method Documentation and Inventory:
- Compile a complete list of all chemicals, solvents, and reagents used in the analytical procedure, including those for sample preparation, mobile phase preparation, and calibration standards.
- Record precise volumes/masses of each chemical used per sample analysis.
PBT Criterion Assessment:
- Cross-reference each chemical from the inventory against the EPA's TSCA PBT list.
- If any chemical is listed as a PBT substance, the PBT quadrant remains blank.
- If no chemicals are PBT-listed, the PBT quadrant is filled green.
Hazardous Criterion Assessment:
- Cross-reference each chemical against the EPA's Toxic Release Inventory (TRI) list of hazardous chemicals.
- Using SDS, also check for other hazard classifications (e.g., GHS hazard statements).
- If any chemical is listed on the TRI or is classified as hazardous, the Hazardous quadrant remains blank.
- If no chemicals are hazardous-listed, the Hazardous quadrant is filled green.
Corrosive Criterion Assessment:
- Identify all procedural steps where pH is a factor (e.g., mobile phase pH, extraction step pH).
- Measure or review the documented pH values for these steps.
- If the pH for all steps remains between 2 and 12 (inclusive), the Corrosive quadrant is filled green.
- If the pH in any step is <2 or >12, the Corrosive quadrant remains blank.
Waste Criterion Assessment:
- Calculate the total waste mass generated per single sample analysis.
Total Waste (g) = Sum of masses of all solvents and reagents used per sample + any solid waste- For liquids, assume density of ~1 g/mL for approximate calculation unless exact densities are known.
- If the calculated waste is ≤50 g, the Waste quadrant is filled green.
- If the calculated waste is >50 g, the Waste quadrant remains blank.
Pictogram Generation and Reporting:
- Draw or generate the four-quadrant NEMI pictogram.
- Fill each quadrant based on the outcomes from steps 2-5.
- Report the final pictogram alongside the method summary.
Workflow Visualization
The following diagram illustrates the logical decision process for a NEMI assessment:
NEMI Assessment Decision Workflow: This diagram outlines the logical sequence and decision points for evaluating a chromatographic method against NEMI's four criteria, showing the conditions under which each pictogram quadrant is filled.
NEMI in Practice: Application to Chromatography
Case Study: Comparative Assessment of HPLC Methods
In a practical application, NEMI was used to evaluate three chromatographic methods developed for quantifying sulfadiazine and trimethoprim in bovine meat and chicken muscles [5]:
- Method I: Conventional RP-HPLC using a water:ethanol (90:10 v/v) mobile phase.
- Method II: Micellar Liquid Chromatography (MLC) using 0.1 M SDS, 12% isopropanol in 0.1 N citric acid.
- Method III: UPLC-MS/MS using ammonium acetate:acetonitrile (80:20 v/v).
The NEMI assessment revealed that Methods II (MLC) and III (UPLC-MS/MS) demonstrated superior greenness profiles compared to the conventional HPLC approach [5]. The MLC method benefited from using less hazardous surfactants and alcohols while generating minimal waste, and the UPLC-MS/MS method achieved significant reductions in solvent consumption and analysis time through miniaturization and increased efficiency.
Essential Research Reagent Solutions
Table 2: Key Reagents and Their Functions in Green Chromatography
| Reagent/Solution | Function in Chromatography | Green Considerations |
|---|---|---|
| Ethanol | Polar protic solvent for mobile phases and extraction | Renewable, biodegradable, less toxic alternative to acetonitrile or methanol [5]. |
| Water | Primary solvent for reversed-phase mobile phases | Non-toxic, non-hazardous, ideal green solvent [5] [16]. |
| Supercritical CO₂ | Extraction solvent and mobile phase (in SFC) | Non-flammable, non-toxic, easily removed; requires specialized equipment [16]. |
| Ionic Liquids | Extraction solvents, stationary phase modifiers | Low volatility reduces air pollution; toxicity varies [16]. |
| Surfactants (e.g., SDS) | Mobile phase component in Micellar Liquid Chromatography (MLC) | Reduces need for organic solvents; biodegradable options preferred [5]. |
| Bio-based Solvents | Replacements for petroleum-derived solvents | Derived from renewable resources; overall greenness depends on lifecycle impact [16]. |
Comparative Analysis with Other GAC Tools
Evolution Beyond NEMI
While NEMI pioneered greenness assessment, its limitations spurred the development of more sophisticated tools. The Analytical Eco-Scale introduced a semi-quantitative approach by assigning penalty points to non-green attributes, with a perfect method scoring 100 [14]. The Green Analytical Procedure Index (GAPI) expanded assessment scope with a color-coded pictogram covering the entire analytical process from sample collection to final determination [14] [10]. The most recent advancement, AGREE (Analytical GREEnness), integrates all 12 principles of GAC into a comprehensive evaluation that provides both a unified pictogram and a numerical score between 0 and 1 [14] [10].
Tool Comparison and Strategic Application
Table 3: Comparison of NEMI with Other Greenness Assessment Tools
| Assessment Tool | Assessment Approach | Key Advantages | Key Limitations |
|---|---|---|---|
| NEMI | Binary (Yes/No) for 4 criteria | Simple, intuitive, rapid evaluation | Lacks granularity; doesn't cover energy use or sample prep [14] [15] |
| Analytical Eco-Scale | Penalty points subtracted from ideal score (100) | Semi-quantitative, allows method ranking | Relies on expert judgment for penalties; no visual output [14] |
| GAPI | Color-coded pictogram for multiple process steps | Comprehensive workflow coverage | No single overall score; some subjectivity in color assignment [14] [10] |
| AGREE | Numerical score (0-1) based on 12 GAC principles | Holistic, user-friendly software, combines score and graphic | Potential subjectivity in weighting criteria [14] [10] |
NEMI remains most valuable as an introductory educational tool and for initial screening of methods. For more comprehensive assessments, particularly in research publications or regulatory submissions, modern tools like AGREE and GAPI offer more nuanced evaluations [14] [10]. The field continues to evolve with the development of specialized metrics such as AGREEprep for sample preparation and the Carbon Footprint Reduction Index (CaFRI) focused specifically on climate impacts [14].
The National Environmental Methods Index (NEMI) occupies a fundamental position in the history and practice of Green Analytical Chemistry. Its straightforward, visual approach successfully introduced environmental considerations into analytical method development, particularly in chromatography. While its binary assessment structure and limited scope are superseded by more sophisticated contemporary tools, NEMI's core principles continue to influence modern green metrics. For today's researcher, NEMI provides an accessible entry point for greenness assessment, while the evolving ecosystem of GAC tools offers increasingly comprehensive frameworks for developing truly sustainable chromatographic methods that minimize environmental impact without compromising analytical performance.
The National Environmental Methods Index (NEMI) is a foundational tool in Green Analytical Chemistry (GAC), designed to provide a quick, visual assessment of an analytical method's environmental impact [6]. Developed by the Methods and Data Comparability Board (MDCB), it emerged as one of the first standardized approaches to evaluating the ecological footprint of laboratory procedures, particularly in chromatography [1] [8]. In the pharmaceutical industry, where analytical methods are routinely employed for quality control and therapeutic drug monitoring, understanding and applying the NEMI pictogram is crucial for transitioning toward more sustainable laboratory practices without compromising analytical performance [17].
The NEMI tool functions as a visual communication device, translating complex data about chemical usage, waste generation, and environmental hazards into an easily interpretable pictogram. This allows researchers, scientists, and drug development professionals to rapidly compare the greenness of multiple analytical methods [6] [7]. Its simplicity and accessibility have established NEMI as a starting point for environmental assessment within a broader strategy that often incorporates more comprehensive metrics.
Decoding the NEMI Pictogram: Structure and Criteria
The NEMI pictogram is a simple circle divided into four equal quadrants [17]. Each quadrant represents a specific environmental criterion, as detailed in Table 1. A quadrant is colored green only if the analytical method meets the associated environmental standard; otherwise, it remains blank (white) [1] [8]. This binary, pass-fail system is the core of NEMI's straightforward visual language.
Table 1: The Four Criteria of the NEMI Pictogram
| Quadrant | Criterion | Description | Requirement for Green Color |
|---|---|---|---|
| PBT | Persistent, Bio-accumulative, and Toxic | Assesses whether any chemicals used are on the EPA's PBT list [8]. | No chemicals used are PBT substances [1]. |
| Hazardous | Hazardous Waste | Evaluates if reagents are classified as hazardous waste [2]. | No solvents/reagents are on the RCRA D, F, P, or U hazardous waste lists [1]. |
| Corrosive | Corrosive | Determines the corrosiveness of the chemical environment [17]. | The pH of the sample or solvents is between 2 and 12 [1]. |
| Waste | Waste Quantity | Measures the total waste generated per analytical run [7]. | The waste amount is ≤ 50 g per sample analysis [1]. |
The following diagram illustrates the decision-making process for determining the final NEMI pictogram, from assessing each individual criterion to the final visual output.
Diagram: NEMI Pictogram Decision Workflow. This flowchart outlines the logical process for determining the color of each quadrant in the NEMI pictogram based on the four environmental criteria.
Experimental Protocol for NEMI Assessment
Implementing a NEMI assessment requires a systematic approach to evaluate an analytical method against the four established criteria. This protocol provides a step-by-step guide for researchers to consistently apply the NEMI tool to chromatographic methods.
Data Collection and Calculation
- Step 1: Compile a Chemical Inventory. List all solvents, reagents, and chemicals used in the analytical procedure, including those for sample preparation, mobile phase composition, and calibration [7].
- Step 2: Determine Total Waste Mass. Calculate the total mass of waste generated per analytical run. This includes all solvents, reagents, and consumables. The calculation is: Total Waste (g) = Σ (Volume of each solvent (mL) × Density (g/mL)) + mass of solid waste (g). A method is considered compliant if the total is ≤ 50 g [1] [8].
- Step 3: Measure or Calculate pH. Determine the pH of the final sample solution or the most extreme pH condition used in the procedure (e.g., pH of extraction solvents or mobile phase). A pH meter is typically used for this measurement. The method is compliant if the value is between 2 and 12, inclusive [1].
Reference Checking and Pictogram Creation
- Step 4: Screen for PBT Substances. Cross-reference all chemicals from Step 1 against the EPA's Toxic Release Inventory (TRI) PBT list. If any chemical is on the list, the PBT quadrant remains blank [8].
- Step 5: Screen for Hazardous Waste. Cross-reference all chemicals against the EPA's Resource Conservation and Recovery Act (RCRA) lists (D, F, P, and U). If any chemical appears on these lists, the Hazardous quadrant remains blank [1] [8].
- Step 6: Construct the NEMI Pictogram. Draw a circle and divide it into four equal quadrants. Label each quadrant (PBT, Hazardous, Corrosive, Waste). Based on the results from Steps 2-5, color the compliant quadrants green and leave non-compliant quadrants blank [2] [17].
NEMI in Practice: A Chromatographic Case Study
A published study evaluating chromatographic methods for the analysis of Empagliflozin provides a clear illustration of NEMI's application and limitations [17]. In this study, 26 different chromatographic methods were assessed using the NEMI tool.
The outcome was revealing: the majority of methods received an identical NEMI pictogram, with only the Corrosive and Waste quadrants colored green, while the PBT and Hazardous quadrants were consistently blank [17]. This result highlights a key finding in modern GAC: while contemporary methods often control waste and pH effectively, they frequently rely on solvents or reagents that are classified as hazardous or PBT, such as acetonitrile or methanol in the mobile phase [2] [7].
This case study demonstrates that while NEMI successfully identifies a common environmental challenge in HPLC methods, its binary and simplistic nature makes it difficult to differentiate between methods that are otherwise quite different in their consumption of reagents, energy use, or sample preparation workflow [17]. Consequently, a method that uses 100 mL of acetonitrile and one that uses 10 mL may receive the same NEMI score, as both would likely fail the hazardous criterion and generate similar waste mass above the 50 g threshold.
Successfully implementing a NEMI assessment requires access to specific informational resources and reagents. Table 2 below lists key reagents and their functional role in the context of green chromatography, along with crucial database links.
Table 2: Essential Research Reagents and Resources for NEMI Assessment
| Reagent/Resource | Function/Role in Analysis | Relevance to NEMI Assessment |
|---|---|---|
| Acetonitrile & Methanol | Common organic modifiers in reversed-phase HPLC mobile phases [7]. | Often cause the "Hazardous" quadrant to be blank due to classification. |
| Phosphate Buffers | Used to control pH of the mobile phase for separation of ionizable analytes [7]. | Critical for the "Corrosive" quadrant; pH must be between 2-12. |
| Water (HPLC Grade) | The greenest solvent, used as the weak mobile phase in reversed-phase HPLC [14]. | Positively contributes to greenness; non-hazardous and non-PBT. |
| EPA PBT List | Official list of Persistent, Bio-accumulative, and Toxic chemicals [8]. | Essential reference for checking the "PBT" quadrant criterion. |
| RCRA Hazardous Waste Lists (D, F, P, U) | Lists defining hazardous wastes under the Resource Conservation and Recovery Act [1]. | Essential reference for checking the "Hazardous" quadrant criterion. |
| NEMI Online Database | Publicly accessible database (www.nemi.gov) for environmental methods [6] [17]. | Primary portal for accessing official criteria and related method information. |
Comparative Analysis with Other Green Metrics
While NEMI provides an excellent introductory framework, it is most powerful when used as part of a suite of assessment tools. The field of GAC has evolved to include several metrics that offer more granular or comprehensive evaluations.
- Analytical Eco-Scale Assessment (ESA): This is a semi-quantitative tool that assigns an overall score out of 100. It starts with a perfect score of 100 and deducts penalty points for hazardous reagents, high energy consumption, and large waste generation [2] [6]. A score above 75 is considered excellent green. Unlike NEMI, it accounts for the amount and degree of hazard, providing better differentiation between methods [17].
- Green Analytical Procedure Index (GAPI): This tool uses a multi-colored pictogram (green, yellow, red) to evaluate the environmental impact of each step in the entire analytical procedure, from sample collection to final determination [2] [6]. It is more comprehensive than NEMI as it covers aspects like sample collection, preservation, and transportation, which NEMI omits [7].
- Analytical Greenness (AGREE) Metric: AGREE is a modern, software-based tool that evaluates methods against all 12 principles of GAC. It provides a digital score between 0 and 1 in the center of a circular pictogram, offering a balanced and user-friendly assessment [14]. It is considered one of the most advanced metrics currently available [14].
Table 3: Comparison of NEMI with Other Green Assessment Tools
| Feature | NEMI | Analytical Eco-Scale | GAPI | AGREE |
|---|---|---|---|---|
| Type of Output | Visual (4-quadrant pictogram) | Numerical score (0-100) | Visual (5-section pictogram) | Visual & Numerical (score 0-1) |
| Basis of Assessment | 4 criteria (PBT, Hazardous, Corrosive, Waste) | Penalty points for hazards, energy, waste | Multiple criteria across all analytical steps | 12 Principles of GAC |
| Ease of Use | Very easy, fast | Moderate, requires calculation | Complex, requires detailed method knowledge | Easy (uses free software) |
| Key Advantage | Quick visual comparison | Quantitative, allows ranking | Comprehensive, covers entire method | Holistic, aligns with GAC principles |
| Key Limitation | Qualitative, limited scope, low differentiating power [17] | Relies on expert judgment for penalties [14] | No overall score, can be subjective [14] | Does not fully cover pre-analytical steps [14] |
The NEMI pictogram remains a valuable entry-point tool for rapidly gauging the environmental profile of chromatographic methods. Its strength lies in its simplicity and ability to communicate core hazards at a glance. As demonstrated, its interpretation is straightforward once the four criteria are understood. However, the scientific community recognizes that its binary and limited scope is a significant drawback for thorough environmental benchmarking [2] [17].
For researchers and drug development professionals, the strategic path forward involves using NEMI as a first-pass filter rather than a standalone verdict. A robust greenness assessment protocol should triangulate results by complementing NEMI with more quantitative tools like the Analytical Eco-Scale and comprehensive frameworks like GAPI or AGREE [17] [7]. This multi-tool approach provides both the quick insight offered by NEMI and the nuanced, actionable data needed to genuinely reduce the ecological footprint of pharmaceutical analysis, thereby supporting the industry's vital journey toward greater sustainability.
Advantages and Limitations of the NEMI Framework
The National Environmental Methods Index (NEMI) is a foundational tool in the field of Green Analytical Chemistry (GAC), first developed in 2002 by the Methods and Data Comparability Board [1] [8]. It was created as one of the earliest systematic approaches to help scientists evaluate the environmental impact of analytical methods, including chromatographic procedures [14] [6]. NEMI functions as both a searchable database and a qualitative assessment tool, providing researchers with a mechanism to evaluate and select analytical methods based on their environmental footprint [1]. The primary purpose of NEMI is to offer a quick, visual representation of a method's greenness, allowing scientists to make more environmentally conscious decisions in method selection and development for drug analysis and other applications [6] [8].
The NEMI Assessment Framework
Core Principles and Pictogram Design
The NEMI framework employs a simple, visually intuitive pictogram system that enables rapid assessment of an analytical method's environmental performance [1]. The pictogram consists of a circle divided into four quadrants, each representing a specific environmental criterion. A quadrant is colored green only if the method meets the established benchmark for that criterion; if not, the quadrant remains uncolored [1] [8]. This binary (yes/no) approach allows for immediate visual interpretation of a method's environmental strengths and weaknesses without requiring complex calculations or specialized expertise [1].
The Four Assessment Criteria
Table 1: The Four Key Assessment Criteria in the NEMI Framework
| Criterion | Requirement for Green Coloring | Purpose | Regulatory Basis |
|---|---|---|---|
| PBT Substances | No chemicals used are on the Persistent, Bioaccumulative, and Toxic (PBT) list | Prevents use of environmentally persistent chemicals | EPA's Toxic Release Inventory (TRI) [8] |
| Hazardous Chemicals | No solvents or reagents are classified as hazardous waste | Reduces handling and disposal hazards | EPA's Resource Conservation and Recovery Act (RCRA) categories (D, F, P, U lists) [1] [8] |
| Corrosiveness | Sample pH remains between 2 and 12 throughout the procedure | Minimizes corrosion potential and environmental damage | - |
| Waste Generation | Total waste produced is ≤50 g per analysis | Encourages waste minimization and pollution prevention | - |
The four criteria work together to provide a comprehensive overview of the most significant environmental impacts associated with analytical methods, with particular relevance to chromatography procedures where solvent use and waste generation are substantial concerns [1] [18].
Experimental Protocol for Conducting NEMI Assessment
Sample NEMI Assessment of a Chromatographic Method
Protocol: Applying the NEMI Framework to a Chromatography Procedure
Objective: To systematically evaluate the greenness of a chromatographic method for pharmaceutical analysis using the NEMI framework.
Materials Required:
- Complete method documentation including reagents, volumes, and procedures
- Safety Data Sheets (SDS) for all chemicals
- pH measurement equipment
- Waste tracking system
Step-by-Step Procedure:
Chemical Inventory Assessment
- Create a comprehensive list of all chemicals, solvents, and reagents used in the analytical procedure
- Cross-reference each chemical against the EPA's PBT list (available at www.nemi.gov)
- Documentation: Record any PBT substances found. If none are present, the first quadrant qualifies for green coloring [1] [8]
Hazardous Waste Evaluation
pH Assessment
- Measure pH at each stage of the analytical procedure where aqueous solutions are used
- Determine if pH remains between 2 and 12 throughout the method
- Documentation: Record all pH measurements. If consistently between 2-12, the third quadrant qualifies for green coloring [1]
Waste Quantification
- Calculate total waste generated per analytical run, including:
- Sample preparation waste
- Mobile phase waste
- Cleaning solutions
- Consumables
- Ensure measurement includes all materials that require disposal
- Documentation: Sum total waste. If ≤50 g per analysis, the fourth quadrant qualifies for green coloring [1] [8]
- Calculate total waste generated per analytical run, including:
Pictogram Completion
- Color only those quadrants where all criteria are fully met
- Leave non-compliant quadrants blank (uncolored)
- Include the completed NEMI pictogram in method documentation
Validation:
- Repeat assessment for method variations or modifications
- Compare NEMI profiles of alternative methods to select the greenest option
- Use assessment during method development to improve environmental performance
Workflow Visualization
Diagram 1: NEMI Assessment Workflow. This flowchart illustrates the systematic process for evaluating an analytical method using the NEMI framework, from initial chemical inventory to final pictogram generation.
Advantages of the NEMI Framework
Practical Benefits for Chromatography Research
The NEMI framework offers several significant advantages that have contributed to its enduring relevance in analytical chemistry, particularly in chromatographic method development:
Simplicity and Accessibility: The straightforward pictogram approach requires minimal training to implement and interpret, making green chemistry principles accessible to researchers at all levels [1] [6]. The binary assessment system (green/uncolored) eliminates ambiguity and simplifies decision-making during method selection.
Rapid Visual Assessment: The color-coded pictogram enables immediate understanding of a method's environmental profile at a glance, facilitating quick comparisons between multiple methods [1]. This visual efficiency is particularly valuable in industrial settings where time constraints are significant.
Freely Accessible Database: NEMI provides a publicly available database (www.nemi.gov) containing over 800 analytical methods with their environmental profiles, offering a valuable resource for method selection and benchmarking [19] [6].
Early Integration Capability: The framework can be applied during initial method development stages, allowing researchers to identify and address environmental concerns before method validation [18]. This proactive approach is more efficient than retrospective assessment.
Educational and Regulatory Value
Educational Tool: NEMI serves as an effective introduction to green chemistry concepts for students and early-career researchers, building foundational awareness of environmental considerations in analytical science [1] [18].
Standardized Benchmarking: By establishing consistent criteria across different methodologies, NEMI enables objective comparison of diverse analytical approaches, supporting evidence-based selection of environmentally preferable methods [6].
Limitations and Constraints
Technical Limitations
Despite its utility, the NEMI framework possesses several limitations that restrict its comprehensiveness for modern green chemistry evaluation:
Qualitative Binary Assessment: The simple yes/no approach lacks granularity and cannot differentiate between degrees of greenness [14] [1]. Methods with minor violations receive the same assessment as those with major environmental concerns.
Limited Scope: NEMI evaluates only four environmental parameters, omitting other critical factors such as energy consumption, operator safety, reagent toxicity, and renewability of materials [14] [8]. This narrow focus provides an incomplete picture of a method's overall environmental impact.
No Lifecycle Considerations: The framework does not account for upstream environmental costs associated with reagent production, equipment manufacturing, or downstream waste treatment processes [14].
Inadequate for Modern Techniques: NEMI's criteria do not fully address the environmental aspects of emerging technologies such as microextraction techniques, capillary chromatography, or on-line sample preparation [19].
Practical Implementation Challenges
Table 2: Comparative Analysis of Green Assessment Tools
| Assessment Tool | Scoring System | Scope | Visual Output | Key Advantages | Key Limitations |
|---|---|---|---|---|---|
| NEMI | Qualitative (Binary) | 4 criteria | 4-quadrant circle | Simple, rapid visual assessment | Limited scope, no quantitative scoring [14] [1] |
| Analytical Eco-Scale | Semi-quantitative (0-100 points) | Reagents, energy, waste, hazards | Numerical score | Detailed penalty point system, enables fine differentiation | No visual component, requires expert judgment [14] [1] |
| GAPI | Semi-quantitative | Entire analytical process | 5-section pentagram | Comprehensive workflow assessment | Complex pictogram, subjective color assignment [14] [6] |
| AGREE | Quantitative (0-1 scale) | 12 GAC principles | Circular diagram with score | Comprehensive, combines score with visual output | Does not sufficiently address pre-analytical processes [14] |
Oversimplification Risk: The binary nature may lead researchers to overlook incremental improvements that don't change the pictogram but still reduce environmental impact [14]. Methods showing partial improvement in environmental performance may not receive appropriate recognition.
Lack of Guidance: NEMI identifies environmental concerns but provides no specific direction for method improvement or optimization, limiting its utility in method development [1].
Subjectivity in Waste Calculation: The ≤50g waste criterion can be interpreted differently across laboratories, potentially compromising comparability between assessments [1].
Complementary Assessment Tools and Research Reagents
Advanced Green Assessment Metrics
To address NEMI's limitations, researchers should employ complementary assessment tools that provide more comprehensive environmental evaluation:
Analytical Eco-Scale: A semi-quantitative tool that assigns penalty points for non-green practices, resulting in a numerical score where 100 represents an ideal green analysis [1] [6]. This approach enables more nuanced differentiation between methods.
Green Analytical Procedure Index (GAPI): Extends assessment to the entire analytical process from sample collection to final detection using a multi-section color-coded pictogram [14] [19]. Particularly valuable for evaluating complex analytical workflows.
AGREE and AGREEprep: Comprehensive metrics based on the 12 principles of GAC that provide both quantitative scores (0-1) and visual outputs [14] [19]. AGREEprep specifically focuses on sample preparation, often the most environmentally impactful stage.
White Analytical Chemistry (WAC): An emerging approach that balances environmental sustainability with analytical performance and practical utility, addressing the multi-dimensional nature of method optimization [8].
Research Reagent Solutions for Greener Chromatography
Table 3: Essential Reagents for Green Chromatography Methods
| Reagent Category | Green Alternatives | Function | Environmental Benefit |
|---|---|---|---|
| Extraction Solvents | Ethanol, ethyl acetate, cyclopentyl methyl ether | Sample preparation, extraction | Reduced toxicity and environmental persistence compared to chlorinated solvents [19] |
| Mobile Phase Modifiers | Methanol, ethanol, acetone | HPLC mobile phase components | Lower toxicity and better biodegradability vs. acetonitrile [18] |
| Green Solvents | Ionic liquids, deep eutectic solvents, bio-derived solvents | Extraction, reaction media | Reduced volatility, lower toxicity, renewable sourcing [19] |
| Sorbents | Biobased sorbents, molecularly imprinted polymers | Sample cleanup, extraction | Enhanced selectivity, reduced solvent consumption [19] |
The NEMI framework represents a pioneering effort to introduce environmental considerations into analytical method evaluation, particularly for chromatography procedures in pharmaceutical research. Its straightforward pictogram approach provides an accessible entry point for green chemistry implementation, enabling rapid assessment and comparison of methods based on four key environmental criteria [1] [6]. However, its qualitative nature and limited scope constrain its utility for comprehensive environmental assessment [14] [8].
For contemporary chromatography research, NEMI serves most effectively as a preliminary screening tool rather than a comprehensive assessment system. Researchers should employ it in conjunction with more advanced metrics such as AGREE, GAPI, or Analytical Eco-Scale to obtain a multidimensional understanding of their method's environmental impact [14] [19] [6]. The future of green assessment in chromatography lies in integrated approaches that balance environmental considerations with analytical performance, practical feasibility, and economic constraints—a concept embodied by the emerging White Analytical Chemistry framework [8].
The ongoing evolution of green assessment tools reflects analytical chemistry's growing commitment to sustainability, with NEMI establishing the foundational principles upon which more sophisticated evaluation systems continue to build [14]. As the field advances, the integration of lifecycle assessment, carbon footprint calculations, and more nuanced environmental impact metrics will further enhance our ability to develop truly sustainable chromatographic methods for pharmaceutical analysis and drug development.
Implementing NEMI Assessment in Chromatographic Workflows
Step-by-Step Guide to NEMI Evaluation for HPLC Methods
The National Environmental Methods Index (NEMI) is a foundational and user-friendly tool designed for the rapid assessment of the environmental impact of analytical methods, including High-Performance Liquid Chromatography (HPLC) procedures [2] [14]. Its development was motivated by the need to provide analytical chemists with a simple, visual means to evaluate the greenness of their methods, aligning with the broader principles of Green Analytical Chemistry (GAC) [5] [14]. The core strength of NEMI lies in its straightforward pictogram, which offers an at-a-glance summary of a method's environmental performance based on four key criteria [2] [20].
This guide provides a detailed, step-by-step protocol for applying the NEMI assessment to HPLC methods, enabling researchers, scientists, and drug development professionals to systematically evaluate and improve the environmental sustainability of their chromatographic procedures within the context of modern green chemistry principles.
Principles of the NEMI Assessment
The NEMI assessment tool operates on a binary, pass/fail system for four environmental criteria, visualized as a pictogram divided into four quadrants [2] [14]. A quadrant is colored green only if the method satisfies all the requirements associated with that criterion. If any requirement is not met, the quadrant remains blank (white). The four criteria evaluated are:
- PBT: The method does not use reagents containing Persistent, Bio-accumulative, and Toxic substances.
- Hazardous: The method does not use reagents that the United States Environmental Protection Agency (EPA) classifies as hazardous.
- Corrosive: The method does not use reagents with a pH ≤ 2 or ≥ 12.
- Waste: The method generates ≤ 50 g of waste per sample analysis [2].
A method is considered to have a better environmental profile if more quadrants are filled in green. However, it is crucial to note that while NEMI is valued for its simplicity and speed, this same simplicity is its primary limitation, as it does not distinguish degrees of greenness or account for the entire analytical workflow, such as sample preparation and energy consumption [2] [14].
Step-by-Step Evaluation Protocol
Step 1: Data Compilation for the Target HPLC Method
The first step involves gathering all necessary data on the reagents and materials used in the HPLC method. A detailed methodology is essential for an accurate assessment.
- Action: Compile a complete inventory of all chemicals, solvents, and reagents used in the method, including their quantities per analysis. This includes the mobile phase components, standards, sample preparation solvents, and any cleaning solutions.
- Essential Information:
- Names and Chemical Abstracts Service (CAS) numbers of all substances.
- Exact volumes or masses used for a single sample analysis.
- The pH of the final solutions or mobile phases.
Step 2: Criterion 1 - PBT (Persistent, Bio-accumulative, and Toxic) Assessment
This step evaluates whether the method uses any PBT substances.
- Action: For each chemical in your inventory, consult official lists from regulatory bodies like the US EPA to determine if it is classified as persistent, bio-accumulative, and toxic.
- Evaluation Rule: If ANY chemical used in the method is listed as a PBT substance, this quadrant fails and remains white. If NONE of the chemicals are PBTs, this quadrant passes and is colored green [2].
- Example: A method using the solvent n-hexane would fail this criterion, as it is classified as hazardous [5].
Step 3: Criterion 2 - Hazardous Substance Assessment
This step identifies the use of any hazardous reagents.
- Action: Cross-reference all chemicals with the US EPA's list of hazardous wastes (e.g., F-list, K-list, P-list, U-list).
- Evaluation Rule: If ANY chemical is EPA-listed as hazardous, this quadrant fails. If NONE are listed, the quadrant passes and is colored green [2].
Step 4: Criterion 3 - Corrosivity Assessment
This step assesses whether the method employs highly acidic or basic conditions.
- Action: Measure or calculate the pH of all solutions used throughout the analytical process. Identify the most extreme pH value (lowest or highest).
- Evaluation Rule: If ANY solution has a pH ≤ 2 or ≥ 12, the quadrant fails. If ALL solutions have a pH between 2 and 12, the quadrant passes and is colored green [2].
- Example: An HPLC mobile phase buffered at pH 5.5, like water:ethanol (90:10 v/v, pH=5.5), would pass this criterion [5].
Step 5: Criterion 4 - Waste Generation Assessment
This step quantifies the total waste produced per sample.
- Action: Sum the masses (in grams) of all solvents, reagents, and consumables used for a single sample analysis. For liquids, assume a density of 1 g/mL for aqueous solutions or consult safety data sheets for organic solvents.
- Evaluation Rule: If the total waste generated is > 50 g, the quadrant fails. If the total waste is ≤ 50 g, the quadrant passes and is colored green [2].
- Example: A method using 20 mL of a solvent with a density of 0.79 g/mL would contribute 15.8 g of waste from that solvent alone.
Step 6: Pictogram Generation and Interpretation
The final step is to synthesize the results from Steps 2-5 into the final NEMI pictogram.
- Action: Draw a circle and divide it into four equal quadrants. Label each quadrant with one criterion: PBT, Hazardous, Corrosive, and Waste.
- Coloring: For each criterion that passed (i.e., met the green condition), fill the corresponding quadrant with the color green. Leave any failed quadrant white.
- Interpretation: A fully green pictogram indicates the method meets all four environmental criteria. The presence of white quadrants quickly highlights specific areas where the method has a higher environmental impact and could be improved.
The following workflow diagram summarizes the step-by-step NEMI evaluation process:
Case Study: NEMI Evaluation of HPLC Methods for Antibiotic Analysis
To illustrate the practical application of this protocol, consider a published study that evaluated three chromatographic methods for quantifying sulfadiazine and trimethoprim in meat samples [5].
- Method I: Conventional RP-HPLC using a mobile phase of water:ethanol (90:10 v/v, pH=5.5).
- Method II: Micellar Liquid Chromatography (MLC) using 0.1 M SDS, 12% isopropanol in 0.1 N citric acid (pH=5.5).
- Method III: UPLC-MS/MS using ammonium acetate:acetonitrile (80:20 v/v, pH=5.5).
The evaluation of these methods using the NEMI protocol yielded the following results:
Table 1: NEMI Evaluation Results for Case Study Methods [5]
| Method | PBT | Hazardous | Corrosive | Waste | Overall Greenness Profile |
|---|---|---|---|---|---|
| Method I (Conventional HPLC) | Pass (Green) | Pass (Green) | Pass (Green) | Fail (White) | Moderate |
| Method II (MLC) | Pass (Green) | Pass (Green) | Pass (Green) | Pass (Green) | Greener |
| Method III (UPLC-MS/MS) | Pass (Green) | Pass (Green) | Pass (Green) | Pass (Green) | Greener |
Interpretation: The study concluded that Methods II (MLC) and III (UPLC-MS/MS) were the greenest, as their NEMI pictograms were fully green [5]. Method I likely failed the waste criterion due to higher solvent consumption typical of conventional HPLC, demonstrating how NEMI can guide analysts towards more sustainable techniques like MLC or UPLC, which use less solvent and generate less waste.
Comparison of NEMI with Other Greenness Assessment Tools
While NEMI is an excellent starting point for greenness assessment, it is one of many available tools. A comprehensive thesis on chromatography greenness assessment should recognize that more recent tools offer deeper insights.
Table 2: Comparison of NEMI with Other Green Assessment Tools [2] [14] [20]
| Tool Name | Type of Output | Scope of Assessment | Key Advantages | Key Limitations |
|---|---|---|---|---|
| NEMI | Pictogram (4 quadrants) | Reagent toxicity & waste | Very simple, fast, visual | Binary output; limited scope; ignores energy & toxicity [2] |
| Analytical Eco-Scale | Numerical score (0-100) | Reagents, energy, waste | Quantitative; allows method comparison [2] | Relies on expert judgment for penalties [14] |
| GAPI | Pictogram (5 pentagrams, multi-color) | Full method from sampling to detection | Comprehensive; visualizes bottlenecks [2] [14] | No single final score; some subjectivity [14] |
| AGREE | Pictogram (12 segments) & numerical score (0-1) | Full method based on 12 GAC principles | Comprehensive, user-friendly, provides a final score [2] [14] | Does not fully account for pre-analytical processes [14] |
As noted in a study on Remdesivir methods, "NEMI is the easiest and fastest greenness evaluation tool; however, the information it provides is particularly of limited scope and sometimes inaccurate" [2]. For a robust environmental impact assessment, using NEMI in conjunction with more comprehensive tools like AGREE or GAPI is highly recommended.
The Scientist's Toolkit: Essential Reagents and Materials
When designing or modifying an HPLC method for improved greenness and NEMI profile, the choice of reagents is critical. The following table lists key solutions and their functions in the context of green chemistry.
Table 3: Research Reagent Solutions for Greener HPLC Methods
| Reagent / Material | Function in HPLC | Green Chemistry Considerations |
|---|---|---|
| Ethanol | Organic solvent in mobile phase | Biobased, less hazardous alternative to acetonitrile [5] |
| Micellar Solutions (e.g., SDS) | Mobile phase in Micellar Liquid Chromatography (MLC) | Low toxicity, biodegradable, reduces organic solvent use [5] |
| Water (at various pH) | Aqueous component of mobile phase | Non-toxic, non-hazardous, ideal green solvent |
| Ammonium Acetate Buffer | Buffer for mobile phase | Low toxicity, suitable for LC-MS applications [5] |
| Methanol | Organic solvent in mobile phase | Preferable to acetonitrile from a green perspective, but still hazardous [21] |
| UPLC Columns (e.g., 50 x 2.1 mm, 1.7 µm) | Stationary phase for separation | Smaller particle sizes enable faster runs and lower solvent consumption [5] |
Advanced Concepts and Future Perspectives
The field of green analytical chemistry is rapidly evolving beyond the foundational principles captured by NEMI. The concept of White Analytical Chemistry (WAC) has emerged as a holistic framework that integrates environmental impact (the green component) with analytical performance quality (the red component) and practical & economic feasibility (the blue component) [22] [23] [24]. A truly "white" method represents an ideal balance between these three dimensions.
Furthermore, new assessment tools continue to be developed. AGREEprep focuses specifically on the environmental impact of sample preparation steps [25]. The Carbon Footprint Reduction Index (CaFRI) estimates carbon emissions associated with analytical procedures, and the Analytical Green Star Analysis (AGSA) provides an intuitive star-shaped diagram for multi-criteria assessment [14]. Staying informed of these advancements ensures that research in chromatography remains at the forefront of both scientific and environmental best practices.
Within the framework of green analytical chemistry (GAC), the environmental profiling of analytical methods is crucial for sustainable pharmaceutical development [14]. This case study applies the National Environmental Methods Index (NEMI) to assess a published high-performance liquid chromatography (HPLC) method for the simultaneous determination of alectinib and its impurity, 5-trifluoroacetate [24]. Alectinib, a second-generation anaplastic lymphoma kinase inhibitor, is a critical therapeutic for non-small cell lung cancer (NSCLC), making quality control of its formulation essential [24] [26]. The NEMI tool provides a simple, pictogram-based assessment, serving as a foundational greenness metric for evaluating the environmental impact of chromatographic procedures [1].
Background and Context
Alectinib as a Therapeutic Agent
Alectinib (marketed as Alecensa) is an oral ATP-competitive ALK tyrosine kinase inhibitor approved for the treatment of ALK-positive metastatic NSCLC [24] [26]. Its potency is approximately five times greater than the first-generation inhibitor crizotinib, and it is effective against various ALK mutations that confer resistance to crizotinib [24]. The safety and efficacy of drugs like alectinib are partially dependent on controlling impurities in the active pharmaceutical ingredient and final dosage form [24].
Green Analytical Chemistry and the Role of NEMI
Green Analytical Chemistry aims to minimize the environmental impact of analytical activities by reducing waste, energy consumption, and the use of hazardous reagents [27] [14]. The National Environmental Methods Index (NEMI) is one of the oldest and simplest metrics for this purpose [1]. Its pictogram is a circle divided into four quadrants, each representing a different environmental criterion. A quadrant is colored green only if the method meets that specific criterion [1].
NEMI Assessment Workflow
Chromatographic Method
The assessed HPLC method was developed for the simultaneous analysis of alectinib and its impurity in Alecensa capsules (150 mg alectinib/capsule) [24].
- Stationary Phase: Ascentis Express 90 Å C8 column (10 cm × 4.6 mm, 2.7 µm) [24].
- Mobile Phase: Gradient system with Acetonitrile and Ammonium Acetate buffer [24].
- Detection: Photodiode Array (PDA) detector at 269 nm [24].
- Optimization: The method was optimized using a Box-Behnken experimental design, with optimal conditions selected via a desirability function [24].
Validation Procedure
The method was validated according to the International Council for Harmonisation (ICH) Q2(R2) guidelines, demonstrating satisfactory analytical performance [24].
- Linearity, LOD, and LOQ:
- Alectinib: LOD 0.1 µg/mL, LOQ 0.3 µg/mL.
- 5-trifluoroacetate impurity: LOD 0.3 µg/mL, LOQ 0.5 µg/mL [24].
- Recovery Study: Performed using the commercial capsule formulation, yielding high recovery percentages, confirming the method's precision and accuracy [24].
- Measurement Uncertainty: A bottom-up approach was used to estimate uncertainty, identifying and quantifying sources affecting the chromatographic responses [24].
NEMI Assessment and Data Presentation
Application of NEMI Criteria
The NEMI assessment of the HPLC method for alectinib is based on its compliance with four key criteria [1]:
Table 1: NEMI Assessment Criteria and Method Compliance
| Criterion | Requirement for Green Profile | Method Compliance |
|---|---|---|
| PBT Chemicals | No persistent, bioaccumulative, and toxic (PBT) chemicals used. | Not Compliant (Likely due to reagents/solvents) |
| Hazardous Waste | No solvents from "D", "F", "P", or "U" hazardous waste lists. | Not Compliant (Likely due to acetonitrile) |
| Corrosivity (pH) | Sample pH between 2 and 12. | Compliant (Ammonium acetate buffer) |
| Waste Amount | Total waste generated is ≤ 50 g per sample. | Not Compliant |
NEMI Pictogram and Interpretation
Based on the criteria in Table 1, the NEMI pictogram for this method is:
NEMI Pictogram for Alectinib HPLC Method
The single green quadrant indicates the method is only partially compliant with green chemistry principles. The primary environmental concerns arise from the use of potentially hazardous solvents and the generation of more than 50 g of waste [1].
The Scientist's Toolkit: Essential Research Reagents and Materials
Table 2: Key Research Reagent Solutions for HPLC Analysis of Alectinib
| Item | Function/Description |
|---|---|
| Ascentis Express C8 Column | Core stationary phase for chromatographic separation. The 2.7 µm particle size provides high efficiency [24]. |
| Acetonitrile | Organic modifier in the mobile phase for gradient elution, critical for resolving alectinib and its impurity [24]. |
| Ammonium Acetate | Source for the aqueous buffer component of the mobile phase, helping to control pH and improve peak shape [24]. |
| Alectinib Reference Standard | High-purity material used for calibration, quantification, and method validation [24]. |
| 5-trifluoroacetate Impurity Standard | High-purity impurity standard essential for specificity testing and quantifying the impurity [24]. |
| Alecensa Capsules | The commercial drug product (150 mg alectinib/capsule) used as the real-world sample matrix for the method [24]. |
The NEMI assessment provides a rapid, initial evaluation of the environmental profile of the HPLC method for alectinib analysis. The results indicate that while the method is analytically sound for its intended purpose, there is significant potential for improvement from a green chemistry perspective. Key areas for future work include investigating the replacement of hazardous solvents with safer alternatives and implementing strategies for waste reduction, such as miniaturization or recycling. For a more comprehensive sustainability assessment, the use of advanced metrics like AGREE, GAPI, or the White Analytical Chemistry (WAC) model is recommended, as they offer a more nuanced evaluation encompassing analytical performance and practical applicability alongside environmental impact [24] [14] [1].
The National Environmental Methods Index (NEMI) provides a foundational framework for evaluating the environmental impact of analytical methods. Although newer metrics like AGREE and GAPI have emerged with more comprehensive scoring systems, NEMI's straightforward approach focuses on four key criteria: persistent, bioaccumulative, or toxic (PBT) chemicals; hazardous waste generation; corrosive pH levels; and waste quantity [28]. In the context of High-Performance Thin-Layer Chromatography (HPTLC), applying NEMI principles means selecting solvent systems and developing protocols that minimize environmental impact while maintaining analytical performance.
The comparison between normal-phase (NP) and reversed-phase (RP) HPTLC is particularly relevant for green analytical chemistry. NP-HPTLC typically utilizes a polar stationary phase (e.g., silica gel) with non-polar to moderately polar mobile phases. In contrast, RP-HPTLC employs a non-polar stationary phase (e.g., C18-bonded silica) with aqueous-organic mobile phases [29] [30]. This fundamental difference in separation mechanics directly influences their environmental footprint, method practicality, and alignment with NEMI's criteria for greener analytical procedures.
Theoretical Foundations and Separation Mechanisms
Normal-Phase HPTLC
In normal-phase chromatography, the stationary phase is more polar than the mobile phase. Retention is governed by adsorption kinetics and the affinity of analytes for the polar sites on the stationary phase, typically silica gel (Si–OH groups). The separation of analytes is primarily based on their polarity, with more polar compounds exhibiting stronger retention and higher Rf values [30]. Selectivity can be finely tuned by adjusting the polarity of the mobile phase through the addition of polar modifiers such as ethyl acetate or alcohols.
Reversed-Phase HPTLC
Reversed-phase chromatography inverts this relationship: the stationary phase is less polar than the mobile phase. RP-HPTLC plates are often silica-based supports bonded with hydrophobic ligands like C8 or C18. The dominant retention mechanism is partitioning, driven by hydrophobic interactions between the analytes and the alkyl chains of the stationary phase [30]. Consequently, the most hydrophobic compounds are retained most strongly. Mobile phases typically consist of water mixed with water-miscible organic solvents like methanol or acetonitrile, and retention decreases as the proportion of organic solvent increases [31].
Experimental Protocols for NP- and RP-HPTLC
Protocol for Normal-Phase HPTLC Analysis
Application Note: Concurrent quantification of three antiviral agents (Remdesivir, Favipiravir, Molnupiravir). Objective: To separate and quantify multiple drugs using a sustainable normal-phase system.
Materials and Reagents:
- HPTLC Plates: Silica Gel 60 F254
- Mobile Phase: Ethyl acetate : ethanol : water (9.4 : 0.4 : 0.25, v/v/v) [29]
- Standard Solutions: 50-2000 ng/band for Favipiravir and Molnupiravir; 30-800 ng/band for Remdesivir
- Sample Application: Automatic applicator (e.g., Automatic TLC Sampler 4) with 6 mm band width
- Development Chamber: Twin-through chamber, pre-saturated with mobile phase vapor for 20 minutes
- Detection: Densitometry at 244 nm for Remdesivir and Molnupiravir; 325 nm for Favipiravir [29]
Procedure:
- Plate Pre-washing: Pre-wash the HPTLC plates with methanol and activate at 60°C for 5 minutes.
- Sample Application: Apply standard and sample bands as 6 mm bands, 8 mm from the bottom edge.
- Chromatographic Development: Develop the plate in the pre-saturated chamber with a mobile phase migration distance of 80 mm.
- Drying: Air-dry the developed plate in a fume hood.
- Detection and Quantification: Scan the plate using a densitometer at the specified wavelengths and generate the calibration curves.
Protocol for Reversed-Phase HPTLC Analysis
Application Note: Quantification of piperine (PPN) in food spices and vitamin A palmitate (VAP) in fortified edible oils. Objective: To develop a green, cost-effective, and robust quantitative method for analytes in complex matrices.
Materials and Reagents:
- HPTLC Plates: RP-18 F254s (e.g., Silica gel 60 RP-18)
- Mobile Phase for PPN: Ethanol : water (80 : 20, v/v) [28]
- Mobile Phase for VAP: Ethanol : water (for manual, on-site analysis) [32]
- Standard Solutions: Prepare stock solutions in an appropriate solvent (e.g., ethanol, n-heptane).
- Detection: Fluorescence detection (FLD) at 366 nm for VAP [32] or UV-Vis densitometry at 343 nm for PPN [28]
Procedure:
- Sample Preparation:
- Application: Apply samples and standards as bands onto the RP-HPTLC plate.
- Development: Develop the plate in an appropriate chamber saturated with the hydro-organic mobile phase.
- Drying: Gently dry the developed plate.
- Detection: Document the plate under FLD at 366 nm for VAP or scan at the respective λmax for other analytes.
Comparative Data Analysis and NEMI Assessment
Performance and Practical Comparison
The following table summarizes the key characteristics of NP- and RP-HPTLC based on the cited application notes.
Table 1: Comparative Analysis of NP-HPTLC and RP-HPTLC Methods
| Parameter | Normal-Phase HPTLC | Reversed-Phase HPTLC |
|---|---|---|
| Stationary Phase | Silica Gel 60 F254 [29] [28] | Silica Gel 60 RP-18 F254s [28] [32] |
| Mobile Phase | Ethyl acetate : ethanol : water (9.4:0.4:0.25, v/v) [29] | Ethanol : water (6:4 to 8:2, v/v) [29] [28] |
| Typical Rf Value | Piperine: 0.29 ± 0.01 [28] | Piperine: 0.52 ± 0.01 [28] |
| Detection | UV-Densitometry (244 nm, 325 nm) [29] | UV-Densitometry (343 nm) or FLD (366 nm) [28] [32] |
| Linear Range | 30-800 ng/band (RMD); 50-2000 ng/band (FAV, MOL) [29] | Method-dependent (e.g., VAP in oils) [32] |
| Primary Applications | APIs, mid- to high-polarity natural products [29] | Hydrophobic compounds (e.g., vitamins in oil), green analysis [32] |
NEMI and Greenness Assessment
When evaluated against the principles of Green Analytical Chemistry (GAC), which NEMI simply embodies, distinct profiles emerge for each technique.
Table 2: NEMI and Green Metric Assessment of HPTLC Methods
| Assessment Criterion | Normal-Phase HPTLC | Reversed-Phase HPTLC |
|---|---|---|
| Solvent Hazard (NEMI PBT) | Ethyl acetate (less toxic) [29] | Ethanol & Water (non-toxic) [29] [32] |
| Waste Generation | Low volume (~15 mL/run) [29] | Very low volume (~10 mL/run); greener solvents [29] |
| Corrosivity (pH) | Neutral, non-corrosive [29] | Neutral, non-corrosive [29] |
| Energy Consumption | Ambient development; low energy [28] | Ambient development; low energy [32] |
| AGREE Score | High score (e.g., 0.90 for piperine analysis) [28] | Superior score expected due to ethanol/water [29] [32] |
| Overall Greenness | Good | Excellent |
Reversed-phase HPTLC frequently demonstrates superior greenness when using ethanol-water mobile phases. These solvents are biodegradable, non-hazardous, and avoid the waste disposal challenges associated with more toxic solvents [29] [32]. Normal-phase methods can also be optimized for sustainability by replacing traditional solvents like hexane and chloroform with greener alternatives such as ethyl acetate [29] [28].
The Scientist's Toolkit: Essential Research Reagents
Selecting the appropriate materials is critical for successful and sustainable HPTLC method development.
Table 3: Essential Research Reagents and Materials for HPTLC
| Item | Function/Description | Application Notes |
|---|---|---|
| HPTLC Plates Si 60 | Polar stationary phase for NP-HPTLC; provides active silanol groups for adsorption-based separation. | Standard for separating compounds of medium to high polarity [29] [28]. |
| HPTLC Plates RP-18 | Non-polar stationary phase for RP-HPTLC; C18 chains enable partitioning based on hydrophobicity. | Ideal for separating non-polar to moderately polar analytes; compatible with aqueous mobile phases [28] [32]. |
| Ethyl Acetate | Polar organic solvent; acts as a mobile phase component or modifier in NP-HPTLC. | A greener alternative to more hazardous solvents like dichloromethane [29] [28]. |
| Ethanol | Green organic solvent; used as the primary organic component in RP-HPTLC mobile phases. | Preferred for its low toxicity and environmental impact; often mixed with water [29] [32]. |
| Water (HPLC Grade) | Polar solvent; used as a component in mobile phases for both NP and RP systems. | In RP-HPTLC, it is the weak solvent. Must be high purity to avoid contamination and baseline noise. |
| Densitometer / FLD Scanner | Instrument for in-situ quantification of analyte bands on the HPTLC plate. | Enables detection at multiple wavelengths and provides quantitative data (peak area/height) [29] [32]. |
| Twin-Trough Chamber | Development chamber that allows for pre-saturation with mobile phase vapor. | Ensures reproducible chromatographic development and reduces edge effects [28] [32]. |
The application of NEMI principles to HPTLC method development provides a clear, practical pathway toward more sustainable analytical practices. The comparative analysis demonstrates that while both normal-phase and reversed-phase HPTLC can be optimized for environmental friendliness, reversed-phase systems utilizing ethanol-water mobile phases often present a superior green profile according to core NEMI criteria [29] [32].
The choice between NP- and RP-HPTLC should be guided by analyte properties, with NP-HPTLC offering superior separation for polar compounds and isomers, and RP-HPTLC excelling for non-polar analytes and greener solvent compatibility. The ongoing integration of comprehensive green assessment tools like AGREE and GAPI, alongside foundational frameworks like NEMI, is crucial for advancing white analytical chemistry—balancing analytical efficacy, ecological safety, and practical applicability in modern laboratories [29] [10].
Integrating NEMI with Method Development and Validation Protocols
The National Environmental Methods Index (NEMI) serves as a foundational tool for evaluating the environmental impact of analytical methods, particularly in chromatography [14] [6]. As global initiatives increasingly emphasize sustainability, integrating green chemistry principles into analytical workflows has become essential for pharmaceutical and environmental laboratories [8] [33]. NEMI provides a straightforward, pictogram-based assessment system that helps researchers quickly identify and mitigate the environmental hazards associated with their analytical procedures [2] [8].
This protocol details the systematic integration of NEMI into the development and validation of chromatographic methods. The framework ensures that environmental considerations are embedded throughout the analytical lifecycle—from initial design to routine application—without compromising data quality or regulatory compliance. The guidelines are structured to be practical for researchers, scientists, and drug development professionals engaged in sustainable analytical practices.
Background and Principles of NEMI
The NEMI Pictogram and Assessment Criteria
The NEMI tool employs a simple, visual pictogram—a circle divided into four quadrants—to represent whether an analytical method meets baseline green chemistry criteria [2] [8]. Each quadrant corresponds to a specific environmental concern, and it is colored green only if the method complies with the associated criterion.
Table 1: The Four Criteria of the NEMI Pictogram
| Quadrant | Criterion | Compliance Requirement |
|---|---|---|
| PBT | Persistent, Bio-accumulative, and Toxic | None of the chemicals used are listed as PBT by the EPA's Toxic Release Inventory (TRI) [8]. |
| Hazardous | Hazardous | None of the reagents are listed as hazardous under the EPA's Resource Conservation and Recovery Act (e.g., F, K, P, U lists) [8]. |
| Corrosive | Corrosive | The pH of the solutions used throughout the method remains between 2 and 12 [6] [8]. |
| Waste | Waste | The total chemical waste generated per analytical run is less than 50 g [8]. |
A method is considered to have a good green profile only when all four quadrants are colored green [8]. It is a qualitative and binary tool; it indicates compliance or non-compliance but does not differentiate degrees of greenness [14] [2].
Role in a Broader Green Assessment Strategy
While NEMI is valued for its simplicity and speed, it has limitations. It does not address energy consumption, operator safety, or the specifics of sample preparation [14] [8]. Therefore, it is recommended that NEMI be used as a first-pass screening tool within a broader greenness assessment strategy that may include more comprehensive metrics like the Analytical Eco-Scale (AES), Green Analytical Procedure Index (GAPI), or Analytical GREEnness (AGREE) metric [5] [2] [33]. These tools offer semi-quantitative or quantitative evaluations that provide a deeper, more holistic view of a method's environmental impact [14] [20].
Protocol for Integrating NEMI into Method Development
This section provides a step-by-step workflow for incorporating NEMI assessment during the development of a new chromatographic method.
The following diagram illustrates the iterative process of integrating NEMI into chromatographic method development.
Detailed Experimental Procedures
Step 1: Reagent and Solvent Selection
The primary determinant of a method's NEMI profile is the chemicals used [5] [34].
- Substitute Hazardous Solvents: Replace toxic solvents like acetonitrile or methanol with greener alternatives where analytically feasible. For example, ethanol or aqueous-organic mobile phases have been successfully used in greener HPLC methods [5] [33]. In micellar liquid chromatography (MLC), surfactants like SDS can replace organic solvents [5].
- Avoid PBT and Listed Hazardous Reagents: Consult the EPA's Toxic Release Inventory (TRI) and Resource Conservation and Recovery Act (RCRA) lists to screen all proposed chemicals [8].
- Control pH: Select buffers and adjust methods to maintain a pH between 2 and 12 to avoid the "Corrosive" penalty. For instance, using ammonium acetate buffer is a common practice [5] [34].
Step 2: Waste Reduction through Miniaturization and Efficiency
The "Waste" quadrant is directly influenced by the scale of the analysis.
- Reduce Column Dimensions: Shift from conventional columns (e.g., 150 mm × 4.6 mm, 5 µm) to smaller UPLC columns (e.g., 50 mm × 2.1 mm, 1.7 µm). This reduces mobile phase consumption and waste generation [5].
- Optimize Flow Rates and Run Time: Lower flow rates and shorter run times directly decrease solvent usage. Techniques like UPLC-MS/MS are recognized for their high throughput and reduced waste production [5].
Step 3: Initial NEMI Assessment and Iterative Optimization
- Compile a list of all chemicals, their quantities, and the expected waste mass per analysis.
- Plot the initial NEMI pictogram. If any quadrant is not green, return to Step 1 to refine the method conditions. This iterative process is key to designing an environmentally benign method from the start.
Protocol for Integrating NEMI into Method Validation
Once a method with a green NEMI profile has been developed, its environmental credentials should be formally documented during validation.
Incorporating NEMI into the Validation Report
The standard method validation report should include a dedicated section for environmental impact assessment.
- NEMI Pictogram: Include the final NEMI pictogram in the summary of the validated method [2].
- Supporting Data: Provide a table that justifies the green status of each quadrant, as shown below.
Table 2: Example NEMI Data Table for a Validated HPLC Method (Cefotaxime Analysis)
| NEMI Criterion | Status | Justification & Evidence |
|---|---|---|
| PBT | Green | Acetonitrile, ammonium acetate not on EPA PBT list. |
| Hazardous | Green | Reagents not listed as hazardous (RCRA F, K, P, U). |
| Corrosive | Green | Mobile phase pH = 6.1 (within 2-12 range). |
| Waste | Green | Estimated waste < 50 g per sample analysis. |
Complementary Greenness Assessment
To provide a more robust sustainability profile, complement the NEMI assessment with other tools.
- Analytical Eco-Scale (AES): Calculate a score by subtracting penalty points for hazardous reagents, energy consumption, and waste from a baseline of 100. A score above 75 is considered an excellent green method [2] [6].
- Green Analytical Procedure Index (GAPI): Use GAPI to evaluate the entire analytical procedure, from sample collection to final determination, providing a more detailed pictogram than NEMI [5] [2].
Case Study and Experimental Data
The following example demonstrates the practical application of this protocol.
Experimental Scenario: Green HPLC for Antibiotic Residue Analysis
- Objective: Develop and validate an HPLC method for quantifying sulfadiazine and trimethoprim in meat samples [5].
- Developed Method: A conventional HPLC method (Method I) using a water:ethanol (90:10, v/v) mobile phase was developed and compared against a MLC method and a UPLC-MS/MS method [5].
The Scientist's Toolkit: Key Research Reagent Solutions
Table 3: Essential Materials for Green Chromatographic Method Development
| Reagent/Equipment | Function in Method | Greenness Consideration |
|---|---|---|
| Ethanol | Organic modifier in mobile phase | A greener alternative to acetonitrile and methanol [5]. |
| Ammonium Acetate Buffer | Aqueous component of mobile phase | Provides a non-corrosive pH and is not classified as hazardous [5] [34]. |
| Sodium Dodecyl Sulfate (SDS) | Surfactant in Micellar Liquid Chromatography (MLC) | Reduces or eliminates the need for organic solvents, significantly improving greenness [5]. |
| UPLC/MS-MS System | High-throughput analytical instrument | Miniaturization reduces solvent consumption and waste generation per analysis [5]. |
| Venusil XBP C8 Column | Analytical column | Used in developed methods with greener mobile phases [34]. |
Results and NEMI Assessment Comparison
The greenness of the three developed methods was evaluated [5].
Table 4: Comparative Greenness Assessment of Three Chromatographic Methods [5]
| Method Description | NEMI Pictogram Profile | Key Greenness Findings |
|---|---|---|
| Method I: HPLC-UVMobile Phase: Water:Ethanol | Not all quadrants were green. | The use of ethanol improved greenness, but the method was not the greenest overall. |
| Method II: MLC-UVMobile Phase: SDS, Isopropanol, Citric Acid | All quadrants were green. | MLC was identified as one of the greenest approaches due to minimal hazardous waste. |
| Method III: UPLC-MS/MSMobile Phase: Ammonium Acetate:Acetonitrile | All quadrants were green. | High-throughput technique with low waste generation, confirmed as a green, safe practice. |
The assessment concluded that Method II (MLC) and Method III (UPLC-MS/MS) were the greenest, successfully estimating drug residues at levels equivalent to their maximum residue limits (MRL) while minimizing environmental impact [5]. This case study confirms that with deliberate planning, methods can be both analytically superior and environmentally friendly.
Integrating the National Environmental Methods Index into chromatographic method development and validation provides a clear, systematic approach to enhancing laboratory sustainability. By following the protocols outlined herein—proactively selecting green reagents, optimizing for waste reduction, and iteratively assessing the NEMI profile—researchers can significantly reduce the environmental footprint of their analytical procedures. Embedding the NEMI pictogram and its justification within the formal validation documentation ensures that environmental considerations become a standard criterion of analytical method quality, aligning scientific practice with the principles of Green Analytical Chemistry.
The National Environmental Methods Index (NEMI) is a critical tool for evaluating the environmental sustainability of analytical methods, particularly in chromatography procedures [8]. Developed by the Multiagency Methods and Data Comparability Board (MDCB), NEMI provides a standardized approach for assessing the environmental impact of analytical techniques used in pharmaceutical research and drug development [8]. This framework is especially valuable for chromatographic methods, which traditionally consume significant quantities of organic solvents and generate substantial hazardous waste [35].
NEMI's primary function involves assessing methods against four key environmental criteria, with results presented in an easily interpretable pictogram [8]. For researchers and scientists developing chromatography procedures, creating compliant NEMI profiles ensures methods align with Green Analytical Chemistry (GAC) principles, minimizing environmental impact while maintaining analytical integrity [14] [35]. The index has evolved to include more specialized tools like ComplexGAPI for evaluating preliminary steps in material-based testing, though NEMI remains foundational for initial environmental assessment [14].
NEMI Assessment Criteria and Evaluation Framework
Core Evaluation Parameters
The NEMI framework assesses analytical methods against four primary environmental criteria, each represented in a distinct quadrant of its characteristic circular pictogram [8]. For a method to be considered compliant and display a fully green pictogram, it must satisfy all four conditions simultaneously. The specific criteria are detailed in the table below.
Table 1: Core NEMI Assessment Criteria for Analytical Methods
| Criterion | Requirement for Compliance | Basis for Assessment |
|---|---|---|
| PBT Substances | Contains no Persistent, Bioaccumulative, and Toxic (PBT) substances | U.S. EPA Toxic Release Inventory (TRI) list [8] |
| Hazardous Chemicals | Uses no hazardous reagents | U.S. EPA Resource Conservation and Recovery Act (RCRA) categories (e.g., F, K, P, U Lists) [8] |
| Corrosiveness | Does not employ corrosive chemicals (pH between 2 and 12, inclusive) | pH of reagents and waste [8] |
| Waste Generation | Generates ≤ 50 g of waste per single analysis | Total mass of solvents, reagents, and consumables used [8] |
The NEMI Pictogram
Compliance with these criteria is visualized through a circular pictogram divided into four quadrants [8]. A green-colored quadrant indicates the method meets that specific criterion, while a blank quadrant signals non-compliance and highlights an area of environmental concern. This intuitive visual format allows researchers to quickly compare the greenness of multiple chromatographic methods.
Experimental Protocol for Creating a NEMI Profile
Workflow for NEMI Profile Development
The following workflow outlines the systematic process for creating a compliant NEMI profile for a chromatography procedure.
Step-by-Step Methodology
- Comprehensive Chemical Inventory: Create a complete list of all chemicals used in the chromatographic procedure, including mobile phase solvents, sample preparation reagents, calibration standards, and cleaning solutions [8]. For each chemical, document the specific product name, chemical abstract service (CAS) number, and manufacturer.
- Mass and Volume Quantification: Precisely measure or calculate the masses (in grams) or volumes (converted to mass using density) of each chemical consumed in a single analytical run. This includes the final diluted volumes of mobile phase and the exact amounts used for sample preparation and injection [8].
- Total Waste Calculation: Sum the masses of all inputs from the previous step. The total must be 50 grams or less for the method to pass the waste criterion [8]. Ensure calculations account for all consumables if a full lifecycle assessment is required.
- PBT Substance Verification: Cross-reference each chemical from Step 1 against the U.S. Environmental Protection Agency's (EPA) Toxic Release Inventory (TRI) list of PBT substances [8]. Any chemical on this list causes automatic failure for this criterion.
- Hazardous Chemical Screening: Check each chemical against the hazardous waste lists under the EPA's Resource Conservation and Recovery Act (RCRA), specifically the F, K, P, and U lists [8]. The method fails this criterion if any listed hazardous substance is used.
- pH Measurement and Assessment: Using a calibrated pH meter, measure the pH of all reagent solutions and the combined waste stream generated from a single analysis [8]. The method is compliant only if all measured pH values fall within the range of 2 to 12, inclusive.
- Data Compilation and Pictogram Generation: Tabulate results for all four criteria. Generate the final NEMI pictogram, coloring each quadrant green only if its corresponding criterion is met [8].
Research Reagent Solutions for Compliant Chromatography
Selecting appropriate reagents and materials is fundamental to developing chromatographic methods that comply with NEMI's green criteria.
Table 2: Essential Reagents and Materials for Green Chromatography Development
| Item Category | Specific Examples | Function in Chromatography | Greenness Considerations |
|---|---|---|---|
| Green Solvents | Ethanol, Acetone, Ethyl Acetate, Propylene Carbonate | Mobile phase component, sample reconstitution, extraction solvent | Replace acetonitrile and methanol; check RCRA lists and PBT status [35] [8] |
| Alternative Columns | Core-Shell (Fused-Core), Superficially Porous Particles | Stationary phase for separation | Enables faster separations, reducing solvent consumption and waste [35] |
| Sample Prep Sorbents | Hydrophilic-Lipophilic Balance (HLB) Polymers | Solid-phase extraction (SPE) for sample clean-up | High efficiency allows for smaller sorbent beds and reduced solvent volumes [14] |
| Benign Standards | - | Analytical reference standards | Select substitutes for toxic analogs; verify absence from PBT and RCRA lists [8] |
| Waste Treatment Kits | Neutralization buffers, Passivation agents | Post-analysis waste management | Treats waste to achieve pH 2-12 and reduce hazard before disposal [8] |
Data Presentation and Analysis for NEMI Profiling
Quantitative Assessment of Chromatographic Methods
Applying the NEMI criteria to real chromatographic data allows for a clear comparison of method greenness. The table below summarizes a hypothetical evaluation of three common HPLC methods.
Table 3: Comparative NEMI Assessment of Example HPLC Methods
| Method Parameter | Conventional HPLC | Greener HPLC | UHPLC |
|---|---|---|---|
| Analytical Column | 150 mm x 4.6 mm, 5 µm | 100 mm x 4.6 mm, 5 µm | 50 mm x 2.1 mm, 1.7 µm |
| Mobile Phase | Acetonitrile : Phosphate Buffer (50:50) | Ethanol : Water (50:50) | Ethanol : Water (40:60) |
| Flow Rate | 1.0 mL/min | 1.0 mL/min | 0.5 mL/min |
| Run Time | 20 minutes | 15 minutes | 5 minutes |
| Total Waste per Run | ~20 g | ~15 g | ~5 g |
| PBT Check | Fail (Acetonitrile) | Pass | Pass |
| Hazard Check | Fail (Acetonitrile) | Pass | Pass |
| Corrosiveness (pH) | Pass (~7.0) | Pass (~7.0) | Pass (~7.0) |
| Waste Check | Pass (<50 g) | Pass (<50 g) | Pass (<50 g) |
| Overall NEMI Result | 2/4 Quadrants | 4/4 Quadrants | 4/4 Quadrants |
Strategic Implementation for Compliance
Achieving a fully compliant NEMI profile (4/4 green quadrants) requires strategic method development focused on solvent selection and waste minimization. As shown in Table 3, replacing toxic solvents like acetonitrile with greener alternatives such as ethanol is the most critical step for meeting the PBT and Hazardous criteria [8]. Furthermore, adopting modern techniques like UHPLC, which utilizes smaller column dimensions and particles, significantly reduces solvent consumption and waste generation, ensuring compliance with the waste criterion [35].
Solving Common NEMI Implementation Challenges and Method Improvement
Addressing Persistent, Bioaccumulative, and Toxic (PBT) Chemical Use
Persistent, Bioaccumulative, and Toxic (PBT) chemicals represent a significant concern in environmental chemistry and public health due to their longevity in the environment, tendency to accumulate in biological tissues, and inherent toxicity. These substances are regulated under Section 6(h) of the Toxic Substances Control Act (TSCA), as amended by the Frank R. Lautenberg Chemical Safety for the 21st Century Act, which mandates the Environmental Protection Agency (EPA) to take expedited action to reduce exposures to these chemicals to the extent practicable [36]. The core concern with PBT chemicals stems from their ability to build up in the environment over extended periods, creating potential risks for exposed populations including the general public, consumers, commercial users, and susceptible subpopulations such as workers, subsistence fishers, indigenous tribes, and children [36].
The regulatory approach to PBT chemicals differs from other substances in that no risk evaluation is required prior to action, reflecting the heightened concern regarding their environmental and health impacts [36]. The EPA has issued final rules for several PBT chemicals, including decabromodiphenyl ether (decaBDE) and phenol, isopropylated phosphate (3:1) (PIP 3:1), with recent revisions in October 2024 that require workplace safety protections, set limits on concentrations in products and articles, and prohibit water releases [36]. Understanding the properties, uses, and regulatory status of these chemicals is essential for researchers and analytical chemists who must develop methods that either avoid their use or minimize their environmental impact.
Experimental Protocols for PBT Chemical Assessment in Chromatography
Protocol 1: Identification and Documentation of PBT Chemicals in Analytical Methods
Objective: To systematically identify and document the use of PBT chemicals in chromatographic analytical procedures.
Materials:
- EPA PBT Chemical List [36]
- ECHA PBT Assessment List [37]
- Laboratory inventory of chemicals and reagents
- Safety Data Sheets (SDS) for all chemicals
Procedure:
- Compile Chemical Inventory: Create a comprehensive list of all chemicals, solvents, and reagents used in the analytical laboratory, including those employed in sample preparation, mobile phases, and standards.
- Cross-Reference with PBT Lists: Compare the laboratory chemical inventory against official PBT chemical lists from the EPA [36] and ECHA [37].
- Document PBT Properties: For each identified PBT chemical, document its specific PBT characteristics (persistence, bioaccumulation potential, and toxicity profile) based on regulatory classifications.
- Assess Usage Patterns: Quantify the volumes and frequencies of PBT chemical use in various analytical methods.
- Identify Alternatives: Research and document potential alternative chemicals or methods that could replace PBT chemical use.
Data Analysis: Create a summary table of identified PBT chemicals used in the laboratory, including their specific applications, quantities used, and potential alternatives. This assessment forms the foundation for subsequent green chemistry evaluations.
Protocol 2: Implementation of Green Analytical Chemistry (GAC) Principles for PBT Reduction
Objective: To integrate Green Analytical Chemistry principles into method development and validation to reduce PBT chemical use.
Materials:
- Greenness assessment tools (NEMI, Analytical Eco-Scale, GAPI, AGREE)
- Chromatography data system (e.g., Clarity software) [38]
- Alternative green solvents and reagents
Procedure:
- Method Evaluation: Assess existing chromatographic methods using multiple greenness assessment tools: National Environmental Methods Index (NEMI), Analytical Eco-Scale Assessment (ESA), Green Analytical Procedure Index (GAPI), and Analytical Greenness metric (AGREE) [2].
- Identify PBT Hotspots: Pinpoint specific steps in analytical procedures where PBT chemicals are used, focusing on sample preparation, mobile phase composition, and detection methods.
- Method Modification: Redesign methods to replace PBT chemicals with safer alternatives while maintaining analytical performance.
- Miniaturization and Automation: Implement microextraction techniques, reduce sample volumes, and automate processes to minimize chemical consumption [14].
- Validation: Revalidate modified methods to ensure they meet accuracy, precision, sensitivity, and specificity requirements.
Data Analysis: Compare the greenness scores of original and modified methods using the selected assessment tools. Document improvements in environmental impact while demonstrating maintained or enhanced analytical performance.
Workflow Diagram: PBT Assessment and Mitigation in Method Development
NEMI Assessment Framework for Chromatography Procedures
Principles of National Environmental Methods Index (NEMI)
The National Environmental Methods Index (NEMI) is a foundational greenness assessment tool that provides a simple, pictogram-based evaluation of analytical methods. The NEMI pictogram consists of four quadrants representing different environmental criteria: PBT (persistent, bioaccumulative, and toxic), Hazardous, Corrosive, and Waste [2]. Each quadrant is colored green if the method meets specific environmental safety criteria for that category, providing a quick visual assessment of a method's greenness profile [2] [14].
For a method to receive a green indicator in all four NEMI quadrants, it must satisfy the following conditions:
- PBT Quadrant: None of the chemicals used are persistent, bioaccumulative, and toxic
- Hazardous Quadrant: None of the chemicals used are listed as hazardous under the Clean Air Act, Clean Water Act, or RCRA
- Corrosive Quadrant: No chemicals used have a pH less than 2 or greater than 12
- Waste Quadrant: The method does not generate more than 50 g of waste [2]
While NEMI's binary (green/blank) assessment system provides simplicity and quick visualization, it lacks granularity in distinguishing between degrees of greenness and does not assess the entire analytical workflow [14]. This limitation has led to the development of more comprehensive assessment tools, but NEMI remains valuable for initial screening and educational purposes due to its straightforward approach.
Protocol 3: Conducting NEMI Assessment for Chromatographic Methods
Objective: To perform a standardized NEMI assessment for chromatographic methods with specific focus on PBT chemical identification.
Materials:
- NEMI criteria documentation
- Chemical inventory with safety data
- pH measurement equipment
- Waste tracking system
Procedure:
- Chemical Classification:
- Review all chemicals used in the method against EPA PBT lists [36]
- Check Clean Air Act, Clean Water Act, and RCRA hazardous chemical lists
- Document any PBT or hazardous chemicals
Corrosivity Assessment:
- Measure pH of all solutions used in the method
- Note any chemicals with pH < 2 or > 12
- Consider buffer solutions and their disposal requirements
Waste Quantification:
- Calculate total waste generated per analysis
- Include solvents, samples, columns, and consumables
- Convert to mass (grams) for comparison against 50 g threshold
Pictogram Generation:
- For each quadrant, assign green if criteria are met
- Leave blank if criteria are not met
- Create final NEMI pictogram for the method
Comparative Analysis:
- Compare NEMI profiles of different methods for the same analysis
- Use results to select greener alternatives
Data Analysis: Generate a NEMI assessment table for each method evaluated, clearly indicating which criteria are met and which require improvement. This assessment serves as a baseline for further green chemistry optimization using more sophisticated tools.
Advanced Green Assessment Tools Beyond NEMI
While NEMI provides a foundational assessment, several more comprehensive greenness evaluation tools have been developed to address its limitations:
Analytical Eco-Scale Assessment (ESA): This semi-quantitative tool assigns penalty points to non-green attributes of an analytical method, which are subtracted from a base score of 100. The resulting score facilitates direct comparison between methods, with scores above 75 considered excellent, 50-75 acceptable, and below 50 inadequate [2] [14].
Green Analytical Procedure Index (GAPI): GAPI offers a more comprehensive visual assessment using a five-part, color-coded pictogram that evaluates the entire analytical process from sample collection to final detection. This tool helps identify high-impact stages within a method but lacks an overall numerical score [2] [14].
Analytical Greenness (AGREE) Metric: AGREE is based on the 12 principles of Green Analytical Chemistry and provides both a unified circular pictogram and a numerical score between 0 and 1. This tool offers comprehensive coverage and user-friendly interpretation but involves some subjective weighting of criteria [2] [14].
AGREEprep: This specialized tool focuses specifically on evaluating the environmental impact of sample preparation, which often represents the most resource-intensive step in analytical procedures [14].
Table 1: Comparison of Greenness Assessment Tools for Chromatographic Methods
| Assessment Tool | Assessment Basis | Output Format | Strengths | Limitations |
|---|---|---|---|---|
| NEMI [2] [14] | Four environmental criteria | Four-quadrant pictogram | Simple, quick, visual | Binary assessment, limited scope |
| Analytical Eco-Scale [2] [14] | Penalty points for non-green attributes | Numerical score (0-100) | Quantitative, facilitates comparison | Subjective penalty assignments |
| GAPI [2] [14] | Multiple stages of analytical process | Five-section pictogram | Comprehensive, visual workflow assessment | No overall score, somewhat subjective |
| AGREE [2] [14] | 12 principles of GAC | Circular pictogram with 0-1 score | Comprehensive, digital output | Does not cover pre-analytical processes |
Application Notes: PBT Chemical Management in Chromatographic Analysis
Case Study: Greenness Assessment of Antiviral Drug Analysis Methods
A comprehensive assessment of chromatographic methods for the analysis of remdesivir (REM), an antiviral medication, demonstrates the practical application of greenness assessment tools. The study evaluated 16 reported analytical procedures using four different greenness metrics: NEMI, Eco-Scale Assessment (ESA), Green Analytical Procedure Index (GAPI), and Analytical Greenness metric (AGREE) [2].
The LC-MS/MS analysis for the active metabolite of REM reported by Avataneo et al. and Du et al. proved to be the most environmentally friendly bioanalytical method based on GAPI and AGREE assessments. Meanwhile, the HPLC method for REM analysis in intravenous solution reported by Jitta et al. was identified as the greenest analytical method for pharmaceutical dosage form analysis according to ESA, GAPI, and AGREE tools [2].
This case study illustrates several key findings:
- Different assessment tools may yield varying results, highlighting the importance of using multiple metrics
- Methods requiring smaller sample volumes and less hazardous solvents consistently score higher
- Miniaturization and automation contribute significantly to improved greenness profiles
- The choice of detection method impacts environmental footprint
Regulatory Compliance Framework for PBT Chemicals in Analytical Laboratories
Table 2: Regulatory Status of Common PBT Chemicals in Chromatography
| PBT Chemical | Common Analytical Uses | Regulatory Status | Key Restrictions | Compliance Deadline |
|---|---|---|---|---|
| DecaBDE [36] | Flame retardant in instrument enclosures | Prohibited with specific exemptions | Manufacturing, processing, and distribution prohibited for most uses; workplace protections required | Various deadlines (2022-2036) based on application |
| PIP (3:1) [36] | Plasticizer, flame retardant, anti-wear additive | Restricted with specific exclusions | Processing and distribution prohibited for most uses; certain aviation and military uses excluded | October 2024 for most articles; 2025-2054 for specific applications |
| Other PBT Chemicals [39] [37] | Various laboratory applications | TRI reporting requirements | Lowered reporting thresholds for certain PBT chemicals | Varies by chemical and jurisdiction |
Research Reagent Solutions: Green Alternatives for Chromatography
Table 3: Essential Materials for Green Chromatographic Analysis
| Material Category | Traditional PBT-Containing Materials | Green Alternatives | Function | Environmental Benefit |
|---|---|---|---|---|
| Solvents [14] | Chlorinated solvents (e.g., chloroform) | Bio-based solvents, water, ethanol | Mobile phase, extraction | Reduced toxicity, biodegradability |
| Columns [40] | Conventional C18 columns | Superficially porous particles, green phases | Separation | Reduced solvent consumption, faster analysis |
| Sample Preparation [14] | Liquid-liquid extraction with hazardous solvents | SULLME, microextraction techniques | Sample preparation | Miniaturization, reduced waste |
| Instrumentation [38] | Conventional HPLC systems | UHPLC systems with reduced dimensions | Separation and detection | Reduced solvent consumption, energy efficiency |
Decision Framework for PBT Chemical Replacement in Analytical Methods
The integration of PBT chemical assessment into chromatographic method development represents a critical advancement in green analytical chemistry. The NEMI framework, while foundational, should be supplemented with more comprehensive assessment tools like GAPI and AGREE to obtain a complete picture of a method's environmental impact. The regulatory landscape for PBT chemicals continues to evolve, with recent EPA rules imposing stricter controls on decaBDE and PIP (3:1) [36], necessitating ongoing vigilance from researchers and method developers.
Future directions in PBT chemical management in analytical chemistry include the development of more sophisticated assessment tools that incorporate lifecycle analysis and carbon footprint calculations [14], increased adoption of miniaturized and automated systems to reduce chemical consumption [14], and greater emphasis on green chemistry principles in analytical method validation protocols [2]. By systematically addressing PBT chemical use through comprehensive assessment frameworks and implementation of greener alternatives, analytical laboratories can significantly reduce their environmental footprint while maintaining scientific rigor and regulatory compliance.
Strategies for Reducing Hazardous Waste Generation in Chromatography
Chromatography, a cornerstone technique in pharmaceutical development and analytical testing, often relies on hazardous solvents and energy-intensive processes, generating significant hazardous waste. Within the framework of a broader thesis on the National Environmental Methods Index (NEMI) assessment for chromatography procedures, this document details practical strategies and protocols for reducing this environmental footprint. The NEMI framework provides a foundational, binary assessment of a method's environmental impact based on criteria such as solvent toxicity and waste generation [14]. Moving beyond this basic evaluation, the field has developed advanced metrics and techniques that enable researchers to systematically align laboratory practices with the principles of Green Analytical Chemistry (GAC). This application note provides researchers and drug development professionals with actionable methodologies to minimize hazardous waste without compromising analytical performance, supporting the industry's shift towards more sustainable operations.
Greenness Assessment in Chromatography
Evolution Beyond Basic NEMI Assessment
The National Environmental Methods Index (NEMI) was an early tool that introduced a simple pictogram to indicate whether a method met four basic environmental criteria. However, its binary (yes/no) structure lacks the granularity to distinguish degrees of greenness or assess the entire analytical workflow [14]. This limitation has spurred the development of more sophisticated assessment tools that offer quantitative scores and holistic evaluations, enabling a more nuanced understanding of a method's environmental impact.
Modern Greenness Assessment Tools
The table below summarizes key metrics now used to complement and expand upon the basic NEMI assessment, providing a multi-dimensional view of a method's sustainability.
Table 1: Key Greenness Assessment Metrics for Analytical Methods
| Metric Tool | Primary Focus | Output Type | Key Advantages | Application in This Guide |
|---|---|---|---|---|
| AGREE [14] [10] | 12 Principles of GAC | Numerical score (0-1) & radial chart | Holistic, user-friendly, facilitates direct comparison | Primary tool for evaluating overall method greenness |
| AGREEprep [14] | Sample Preparation | Numerical score & pictogram | First dedicated tool for sample prep, a major waste source | Used to assess and improve sample preparation protocols |
| GAPI/MoGAPI [14] [10] | Entire Analytical Workflow | Color-coded pictogram | Visualizes environmental impact across all stages | Helps identify specific high-impact stages in a workflow |
| Analytical Eco-Scale [14] [10] | Penalty for non-green attributes | Numerical score (100 = ideal) | Simple, semi-quantitative, easy to calculate | Quick benchmarking of new or existing methods |
| AGSA [14] | Multiple green criteria | Score & star-shaped diagram | Intuitive visualization for method comparison | Provides a visual summary of a method's sustainability profile |
Core Strategies for Waste Reduction
Alternative Chromatographic Techniques
Adopting inherently greener separation techniques is one of the most effective ways to reduce hazardous waste at the source.
Table 2: Comparison of Alternative Green Chromatography Techniques
| Technique | Key Green Feature | Hazardous Waste Reduction | Typical Applications | Protocol Considerations |
|---|---|---|---|---|
| Supercritical Fluid Chromatography (SFC) [41] [42] | Uses supercritical CO₂ as primary mobile phase | Reduces organic solvent use by 60-90% | Chiral separations, natural products, APIs | CO₂ must be highly pure; often requires 5-30% organic modifier |
| Ultra-High-Performance LC (UHPLC) [43] [42] | Smaller particle columns (<2µm) | Reduces solvent consumption by up to 80% | High-throughput analysis, method transfer | System must be rated for high pressures (>1000 bar) |
| Micellar Liquid Chromatography (MLC) [41] | Uses surfactants in aqueous mobile phases | Eliminates or minimizes organic solvents | Pharmaceutical formulations, biological fluids | Requires optimization of surfactant type and concentration |
| Centrifugal Partition Chromatography (CPC) [44] | Liquid-liquid technique; no solid support | Eliminates solid support waste (e.g., silica gel) | Natural product isolation, preparative chromatography | Relies on selecting a suitable biphasic solvent system |
Solvent Management and Selection
Solvent consumption is a primary contributor to the environmental impact of chromatography.
Table 3: Green Solvent Alternatives and Management Strategies
| Strategy | Protocol / Implementation | Expected Impact | Practical Considerations |
|---|---|---|---|
| Solvent Replacement | Substitute acetonitrile with ethanol or methanol; use water-based mobile phases [43] [42] | Lower toxicity, better biodegradability, reduced disposal cost | May require method re-validation; can affect selectivity and backpressure |
| Solvent Recycling | Implement in-line density-based recirculation or membrane filtration (e.g., Organic Solvent Nanofiltration) [44] | Recover >90% of solvents for reuse; significantly reduces purchasing and waste costs | Initial investment in equipment; requires monitoring of solvent purity |
| Waste Segregation | Collect acetonitrile and methanol wastes separately for easier recycling [45] | Lowers hazardous waste disposal volume and cost | Requires clear labeling and multiple waste containers in the lab |
Sample Preparation Miniaturization
Sample preparation is often the most waste-intensive step. Green Sample Preparation (GSP) principles advocate for miniaturization, automation, and integration [46].
- Solid-Phase Microextraction (SPME): A solvent-free technique where a coated fiber is exposed to the sample or its headspace to absorb analytes, which are then thermally desorbed in the GC injector [41].
- Liquid-Phase Microextraction (LPME): Uses minimal volumes of solvent (often <100 µL) for extraction, drastically reducing solvent consumption compared to traditional Liquid-Liquid Extraction (LLE) [41].
- Automation and Integration: Automated systems save time, lower reagent consumption, and reduce errors and operator exposure. Integrating multiple preparation steps into a single, continuous workflow cuts down on resource use and waste production [46].
Detailed Experimental Protocols
Protocol 1: Method Transfer from HPLC to UHPLC
Objective: Transfer an existing HPLC method to a UHPLC platform to reduce solvent consumption and analysis time while maintaining chromatographic resolution.
Materials:
- UHPLC system capable of withstanding pressures up to 1500 bar.
- UHPLC column with same chemistry as original HPLC column but smaller particle size (e.g., 1.8 µm vs. 5 µm).
- Mobile phase solvents (e.g., acetonitrile, methanol, aqueous buffers).
Procedure:
- System Calibration: Ensure the UHPLC system's dwell volume and delay volume are characterized, as these differ from HPLC systems and can impact gradient transfer.
- Scaling Calculations: Reduce the column dimensions and adjust the flow rate using scaling equations. A typical starting point is to keep the linear velocity constant.
- New Flow Rate:
Flow_rate_UHPLC = Flow_rate_HPLC × (Column_ID_UHPLC² / Column_ID_HPLC²) - Gradient Time Adjustment:
Gradient_time_UHPLC = Gradient_time_HPLC × (Column_Volume_UHPLC / Column_Volume_HPLC)
- New Flow Rate:
- Initial Run: Perform an initial isocratic scouting run to determine the system backpressure and check for peak shape.
- Gradient Optimization: Execute the scaled gradient method. The total run time and solvent volume per injection will be significantly reduced.
- Performance Verification: Confirm that critical resolution (Rs) between the key peak pair is maintained ≥ 2.0. Ensure the signal-to-noise ratio (S/N) is comparable to the original method.
Greenness Assessment: Calculate the solvent volume saved per analysis. Use AGREE to compare the greenness score of the UHPLC method against the original HPLC method [14] [10].
Protocol 2: Implementing Supercritical Fluid Chromatography (SFC)
Objective: Develop a chiral separation method using SFC to eliminate the use of halogenated solvents like hexane and iso-propanol commonly used in normal-phase HPLC.
Materials:
- SFC system comprising a CO₂ pump, a modifier pump, a back-pressure regulator, and a chiral column (e.g., amylose- or cellulose-based).
- Source of SFC-grade CO₂.
- Organic modifier (e.g., methanol, ethanol).
Procedure:
- Column and Modifier Selection: Install a suitable chiral column. Begin with methanol as a green modifier.
- Initial Scouting: Start with a low modifier percentage (e.g., 5% methanol) and a low back-pressure (e.g., 100 bar). Run a gradient from 5% to 50% modifier over 10-15 column volumes.
- Peak Tracking: If peaks are detected, optimize the isocratic modifier percentage for resolution. If no peaks elute, increase the modifier strength or try a different column chemistry.
- Temperature and Pressure Optimization: Systematically vary the column temperature (e.g., 25°C to 40°C) and back-pressure (e.g., 100 to 150 bar) to fine-tune selectivity and efficiency.
- Method Validation: Validate the final method for specificity, linearity, accuracy, and precision according to ICH guidelines.
Greenness Assessment: The method's primary mobile phase (CO₂) is non-toxic and largely recycled within the system. Use AGREEprep to highlight the green advantages of the sample preparation and the overall method [41] [47].
Protocol 3: On-Line Solvent Recycling using Membrane Filtration
Objective: Integrate an Organic Solvent Nanofiltration (OSN) unit with a preparative chromatography system to recycle spent mobile phase.
Materials:
- Preparative chromatograph (e.g., CPC or HPLC).
- Organic Solvent Nanofiltration (OSN) unit with appropriate membrane molecular weight cutoff (MWCO).
- Solvent reservoirs for fresh and recycled mobile phase.
Procedure:
- System Configuration: Plumb the waste stream from the chromatograph's detector to the feed inlet of the OSN unit. Connect the permeate stream (the purified solvent) to a "recycled solvent" reservoir.
- Membrane Selection: Choose a stable OSN membrane with a MWCO significantly lower than the molecular weight of the target analyte to prevent product loss.
- Process Parameters: Set the OSN unit's operating pressure and cross-flow rate according to the manufacturer's specifications for the solvent mixture.
- Integration with Chromatography: The recycled solvent from the OSN permeate can be mixed with a portion of fresh modifier to create the mobile phase for subsequent injections.
- Efficiency Monitoring: Periodically sample the recycled solvent and analyze by GC-MS to ensure no analyte or impurity buildup. Monitor API loss, which should be minimized (<3%) [44].
Greenness Assessment: Quantify the percentage of solvent recycled per run. Use CaFRI (Carbon Footprint Reduction Index) to estimate the reduction in carbon emissions associated with solvent manufacturing and waste disposal [14].
The Scientist's Toolkit
Table 4: Essential Reagents and Materials for Green Chromatography
| Item | Function/Description | Green Rationale | Example Use Case |
|---|---|---|---|
| Supercritical CO₂ [42] | Primary mobile phase in SFC | Non-toxic, non-flammable, reusable | Replacing hexane/IPA in normal-phase chiral separations |
| Natural Deep Eutectic Solvents (NADES) [41] | Green solvents for extraction and sample prep | Biodegradable, low toxicity, from renewable sources | Extracting plant-based natural products |
| Ethanol [43] | Alternative organic modifier | Less toxic and safer than acetonitrile | Replacing acetonitrile in reversed-phase LC |
| Hydrogen Generator [42] | Source of carrier gas for GC | Can be generated on-demand, faster separations | Replacing helium, which is a finite resource |
| Metal-Organic Frameworks (MOFs) [42] | Stationary phase or SPME coating | High porosity, tunable selectivity, potential for recyclability | Selective extraction of contaminants from complex matrices |
Workflow and Decision Pathways
The following diagram illustrates a logical workflow for transitioning a traditional chromatographic method to a greener alternative, incorporating NEMI principles and modern assessment tools.
The transition to sustainable chromatography is an achievable and critical goal for modern laboratories. By moving beyond the basic NEMI assessment to employ advanced metrics like AGREE and AGREEprep, and by adopting strategic changes such as alternative techniques (SFC, UHPLC), solvent management, and miniaturization, researchers can drastically reduce hazardous waste generation. The detailed protocols provided herein offer a clear pathway for implementing these green strategies. As the field evolves, fostering collaboration between academia, industry, and regulators will be essential to phase out outdated, wasteful methods and embed sustainability as a core component of analytical science [46].
Within pharmaceutical development, the principles of Green Analytical Chemistry (GAC) are driving the adoption of more sustainable and safer analytical practices, particularly in high-performance liquid chromatography (HPLC) [48] [49]. Reversed-phase (RP)-HPLC, a cornerstone technique for analyzing active pharmaceutical ingredients (APIs) and monitoring impurities, traditionally relies on significant volumes of hazardous solvents like acetonitrile and methanol [50]. These solvents pose substantial environmental, health, and safety (EHS) concerns due to their toxicity and the challenges associated with waste disposal [50]. Furthermore, the pH of the aqueous mobile phase component is a critical parameter that must be carefully managed to ensure robust separation, column stability, and operator safety.
This application note details practical strategies for optimizing mobile phases by integrating safer solvent alternatives and prudent pH management. The guidance is framed within the context of the National Environmental Methods Index (NEMI) assessment, a tool that provides a simple, visual representation of a method's environmental impact [48] [49]. By adopting these protocols, researchers can develop chromatographic methods that not only meet analytical performance criteria but also align with the broader objectives of sustainable drug development.
Safer Solvent Alternatives for Mobile Phases
Green Solvent Selection Guide
A primary strategy for greening RP-HPLC is the substitution of classic, hazardous organic modifiers with safer, bio-based, or more sustainable alternatives [51] [50]. The following table summarizes the properties of conventional and greener solvents, facilitating an informed selection process.
Table 1: Comparison of Conventional and Greener Solvents for RP-HPLC Mobile Phases
| Solvent | EHS & Environmental Profile | Key Chromatographic Properties | NEMI Considerations | Practical Notes & Challenges |
|---|---|---|---|---|
| Acetonitrile | Toxic, hazardous waste, high environmental impact [50] | Low viscosity, low UV cut-off (190 nm), preferred for UV detection [50] | Typically fails PBT and Hazardous criteria [49] | Conventional, high-hazard option. Cost and supply volatility can be concerns. |
| Methanol | Less toxic than ACN but still hazardous [50] | Higher viscosity than ACN, higher UV cut-off (205 nm) [50] | Often fails Hazardous criterion [49] | Conventional option. More biodegradable than ACN but still regulated. |
| Ethanol (EtOH) | Less toxic, biodegradable, lower VOC emissions, renewable [50] | Similar selectivity to MeOH; higher viscosity can increase backpressure [50] | Can help a method pass Hazardous and PBT criteria [50] | Leading green alternative. Often requires 5-15% higher composition than MeOH for equivalent elution strength. Cost-effective. |
| Isopropanol/ n-Propanol | Less toxic than ACN/MeOH [50] | Strong elution strength, high viscosity, high UV cut-off [50] | Can help a method pass Hazardous and PBT criteria [50] | Useful for strongly retained analytes. High viscosity often requires mixing with lower viscosity solvents (e.g., EtOH) or elevated column temperatures. |
| Acetone | Preferred green solvent in several guides [50] | Low viscosity, very low UV cut-off (330 nm), limiting UV detection below this wavelength [50] | Can help a method pass Hazardous and PBT criteria [50] | Excellent for non-UV detection (e.g., CAD, MS). UV transparency is a major limitation for PDA/UV methods. |
| Ethyl Lactate | Bio-based, readily biodegradable, low toxicity [51] | Properties similar to mid-range alcohols [51] | Can help a method pass Hazardous and PBT criteria | Emerging bio-based solvent. Cost and availability may be factors. |
| Supercritical CO₂ | Non-toxic, non-flammable, easily removed [51] | Used in SFC; requires specialized instrumentation [51] | Would pass all NEMI criteria | Not a direct replacement for LC mobile phases without significant system modification. |
Experimental Protocol: Scouting and Transitioning to Green Solvents
Objective: To systematically identify a greener solvent system that provides equivalent or superior chromatographic performance compared to a traditional method using acetonitrile or methanol.
Materials:
- HPLC/UHPLC system with PDA or UV-Vis detector
- C18 or C8 column (e.g., 150 mm x 4.6 mm, 5 µm or 100 mm x 2.1 mm, sub-2 µm)
- Standards of the target analyte(s) and any known impurities
- HPLC-grade water
- HPLC-grade candidate solvents (e.g., Ethanol, Isopropanol, Acetone)
- Acids/bases/salts for pH and ionic strength adjustment (see Section 3)
Procedure:
- Initial Scouting: Set the column temperature to 30°C. Prepare a series of isocratic mobile phases containing 50% organic modifier in water (v/v). Use the same batch of water and the same buffer/pH for all tests to isolate the effect of the organic solvent.
- Solvents to test: Methanol (baseline), Acetonitrile (baseline), Ethanol, and a 70:30 (v/v) mixture of Ethanol:Isopropanol.
- Analyze a standard mixture of the target analytes using each mobile phase at a flow rate of 1.0 mL/min (for 4.6 mm i.d. column) or 0.4 mL/min (for 2.1 mm i.d. column). Monitor the backpressure.
- Evaluate Chromatographic Outcomes: For each run, record:
- Retention factor (k) of each analyte
- Peak symmetry (Tailing Factor)
- Resolution (Rs) between critical pairs
- Column backpressure
- Fine-Tuning Elution Strength: Based on the results, select the most promising green solvent (often ethanol). If retention is too high, gradually increase the percentage of organic modifier. If retention is too low, decrease the percentage. The elutropic strength of ethanol is approximately equivalent to methanol but requires a slightly higher percentage (e.g., 60% EtOH ~ 50% MeOH).
- Gradient Method Translation: If the original method uses a gradient, translate the organic solvent profile using established linear solvent strength (LSS) models or empirically scouted gradients, adjusting the initial and final % organic based on the findings from the isocratic scouting runs.
Troubleshooting:
- High Backpressure: This is common with alcohols due to their higher viscosity.
- Solution: Increase the column temperature (e.g., to 40-60°C) to lower viscosity. Alternatively, consider using a shorter column or one with a larger particle size or wider internal diameter.
- Poor Efficiency/Peak Shape: The new solvent may have different deactivating properties for residual silanols on the stationary phase.
- Solution: Re-optimize the pH and buffer concentration of the aqueous phase (see Section 3).
pH Management in Aqueous Mobile Phase
Principles of pH Selection and Control
The pH of the aqueous component of the mobile phase is a critical variable that controls the ionization state of ionizable analytes (acids, bases, ampholytes), thereby profoundly affecting their retention, selectivity, and peak shape [52]. Effective pH management is also essential for NEMI compliance and operator safety.
Key Considerations:
- Analyte pKa: The mobile phase pH should be selected relative to the pKa of the analytes. For bases, a pH 2 units below their pKa ensures protonation; for acids, a pH 2 units above their pKa ensures deprotonation. Operating at a pH where analytes are ionized can often lead to poor retention and tailing if not properly buffered.
- Column Stability: Conventional silica-based columns have a working range of pH 2-8. Operating outside this range can dissolve the silica backbone, permanently damaging the column.
- Buffer Capacity: A buffer should be used whenever pH control is critical. The buffer capacity is maximized when the mobile phase pH is within ±1.0 unit of the buffer's pKa.
Green Buffer Selection and NEMI Assessment
The choice of buffer and its concentration directly impacts the "Corrosive" and "Hazardous" quadrants of the NEMI pictogram. Phosphoric acid and its salts at high concentrations (>0.1 M) are often classified as corrosive [49].
Table 2: Greener Alternatives for Mobile Phase pH Control
| Buffer System | Useful pH Range | NEMI & Greenness Considerations | Compatibility Notes |
|---|---|---|---|
| Ammonium Formate | 2.8 - 4.0 & 8.0 - 10.0 | Volatile, ideal for LC-MS. Lower corrosivity than phosphate. Helps avoid "Corrosive" blotch in NEMI at typical concentrations (e.g., 10-20 mM). | Can form formic acid, which may increase corrosion. |
| Ammonium Acetate | 3.8 - 5.8 & 8.0 - 10.0 | Volatile, ideal for LC-MS. Lower corrosivity than phosphate. Helps avoid "Corrosive" blotch in NEMI. | Limited buffering range in acidic region. |
| Ammonium Bicarbonate/Carbonate | 8.0 - 11.0 | Volatile. A greener alternative to alkylamines for high pH applications. | Unstable in solution, should be prepared fresh. Releases CO₂. |
| Low Concentration Phosphate | 2.0 - 3.0 & 6.0 - 8.0 | Well-understood, wide range. May be flagged as "Corrosive" in NEMI if concentration is too high. | Strategy: Use at the minimum effective concentration (e.g., 5-10 mM) to reduce environmental impact and corrosiveness. Incompatible with MS. |
Experimental Protocol: Optimizing pH and Buffer Concentration
Objective: To determine the optimal pH and minimum effective buffer concentration for a robust, green analytical method.
Materials:
- HPLC system and column as in Protocol 2.2
- Standard solution of analytes
- Acids/bases for pH adjustment (e.g., formic acid, acetic acid, ammonium hydroxide)
- Buffer salts (e.g., ammonium formate, ammonium acetate)
Procedure:
- pH Scouting: Based on the pKa of your analytes, select 3-4 pH values within the column's stable pH range. For example, for a basic analyte with pKa ~4.5, test pH 3.0, 4.0, 5.0, and 6.0.
- Prepare the aqueous phase for each pH value. For instance, use 10 mM ammonium formate, adjusted with formic acid to the target pH.
- Keep the organic modifier and its percentage constant (e.g., 40% Ethanol).
- Analyze the standard mixture using an isocratic or gradient method for each pH. Record retention times, peak symmetry, and resolution.
- Select the Optimal pH: Identify the pH that provides the best resolution of critical pairs and acceptable peak shapes.
- Buffer Capacity Study: At the selected optimal pH, prepare the aqueous phase with varying concentrations of the buffer salt (e.g., 5 mM, 10 mM, 20 mM).
- Analyze the standard mixture with each buffer concentration. The goal is to find the lowest concentration that provides consistent retention times and peak shapes. A significant shift in retention or deterioration of peak shape at lower concentrations indicates insufficient buffering capacity.
Troubleshooting:
- Retention Time Drift: A sign of inadequate buffer capacity. Slightly increase the buffer concentration (in 2-5 mM increments) until retention times are stable.
- MS Incompatibility: If transferring a method from UV to MS, replace non-volatile phosphate buffers with volatile alternatives like ammonium formate or acetate, and re-optimize the method as described above.
Integration with NEMI Assessment
The National Environmental Methods Index (NEMI) is a simple, pictorial tool that summarizes the environmental friendliness of an analytical method via a four-quadrant pictogram [48] [49]. A method is considered "green" in a quadrant if it meets the following criteria:
- PBT: None of the chemicals used are Persistent, Bioaccumulative, and Toxic.
- Hazardous: None of the chemicals used are on the EPA's list of hazardous chemicals.
- Corrosive: The pH of the waste stream is between 2 and 12.
- Waste: The total waste generated is less than 50 g per sample.
How the Optimization Strategies Impact NEMI:
- Solvent Replacement: Substituting acetonitrile or methanol with ethanol or other green solvents directly addresses the "Hazardous" and "PBT" quadrants, allowing them to remain green [50].
- pH and Buffer Management: Using low-concentration, volatile buffers and ensuring the final waste stream has a pH between 2 and 12 ensures the "Corrosive" quadrant remains green. Using the minimum effective buffer concentration also minimizes potential environmental impact.
- Waste Reduction: While not the primary focus of this note, employing UHPLC (smaller column dimensions, smaller particles) or reducing run times directly reduces solvent consumption, helping to meet the "Waste" criterion of <50 g/sample [50].
The following diagram illustrates the decision-making process for developing a method with a green NEMI profile:
Diagram: A workflow for developing a chromatographic method targeted for a green NEMI assessment profile.
The Scientist's Toolkit
Table 3: Essential Reagents and Materials for Green Mobile Phase Optimization
| Item | Function/Application | Green & Safety Considerations |
|---|---|---|
| Ethanol (HPLC Grade) | Primary green organic modifier for RP-HPLC [50]. | Less toxic, biodegradable, renewable. Lower disposal cost and hazard. |
| Ammonium Formate (MS Grade) | Volatile buffer salt for pH control in acidic to neutral ranges. Ideal for LC-MS methods [49]. | Helps avoid NEMI "Corrosive" blotch. Volatile, reducing residual waste. |
| Ammonium Acetate (MS Grade) | Volatile buffer salt for pH control in neutral to slightly basic ranges. Ideal for LC-MS methods [49]. | Helps avoid NEMI "Corrosive" blotch. Volatile, reducing residual waste. |
| Formic Acid (MS Grade) | Acidifying agent for pH adjustment, particularly with volatile ammonium buffers. | Volatile. Use at low concentrations (e.g., 0.1%) to minimize corrosiveness. |
| pH Meter with Micro Electrode | Accurate preparation and verification of aqueous mobile phase pH. | Critical for ensuring method robustness and meeting NEMI corrosive criteria (waste pH 2-12). |
| Syringe Filters (Nylon, 0.45 µm or 0.2 µm) | Filtration of all aqueous and organic mobile phases prior to use. | Prevents column blockage and system damage, ensuring reproducibility and extending column lifetime. |
| Silica-Based C18 Column (e.g., 150 x 4.6 mm, 5 µm) | Standard workhorse column for method development and optimization. | Ensure selected pH is within manufacturer's specified range (typically pH 2-8) to avoid dissolution. |
Miniaturization and Waste Reduction Techniques to Improve NEMI Scores
The National Environmental Methods Index (NEMI) is a established tool for evaluating the environmental impact of analytical methods, providing a simple, visual profile of their greenness [2] [19]. Its pictogram features four quadrants, each representing a key environmental criterion: whether the method uses Persistent, Bioaccumulative, and Toxic (PBT) chemicals; whether it employs Hazardous reagents; whether it uses Corrosive substances (pH ≤2 or ≥12); and whether it generates more than 50 g of waste per sample [2] [19]. A green-filled quadrant indicates the method does not violate that specific criterion.
Within the broader context of Green Analytical Chemistry (GAC), which promotes eco-friendly techniques by reducing waste, energy consumption, and harmful reagents, NEMI serves as an introductory assessment tool [27] [2]. This application note explores practical miniaturization and waste reduction strategies designed to meet NEMI's criteria, thereby improving the environmental profile of chromatographic procedures in pharmaceutical analysis.
Strategic Approaches for Enhanced Greenness
Improving a method's NEMI score focuses primarily on addressing the "hazardous," "corrosive," and "waste" quadrants. The following strategic areas offer the most significant potential for enhancement.
Miniaturization of Chromatographic Systems
Scaling down analytical instruments directly reduces solvent consumption and waste generation, helping to meet NEMI's waste criterion of <50 g/sample.
- Micro-LC and Capillary LC: These techniques utilize columns with internal diameters of 1 mm or less, leading to a drastic reduction in mobile phase flow rates (from conventional 1 mL/min to µL/min or even nL/min levels). This results in up to a 99% decrease in solvent consumption and waste generation compared to standard HPLC [33].
- High-Performance Thin-Layer Chromatography (HPTLC): HPTLC is recognized as a sustainable alternative that consumes solvents only during the development stage, eliminating the need for continuous flow. This characteristic, combined with its ability to analyze multiple samples on a single plate, makes it exceptionally eco-efficient [53]. A developed HPTLC method for cardiovascular drugs achieved a perfect NEMI score, demonstrating the technique's alignment with green principles [53].
Green Sample Preparation via Microextraction
Sample preparation is often the most resource-intensive step. Implementing modern microextraction techniques is a highly effective strategy for improving greenness.
- Solid-Phase Microextraction (SPME): A solvent-free technique where a fiber coated with a stationary phase is used to extract analytes directly from sample matrices. It can be automated and coupled directly to chromatographic systems, eliminating the need for hazardous desorption solvents [19].
- Liquid-Phase Microextraction (LPME): This encompasses several miniaturized techniques that use tiny volumes of extraction solvent (often ≤ 100 µL). A common variant, Dispersive Liquid-Liquid Microextraction (DLLME), provides high enrichment factors and recovery while using minimal solvent [19].
Table 1: Comparison of Microextraction Techniques for Green Sample Preparation
| Technique | Principle | Solvent Volume | Key Advantages | NEMI Impact |
|---|---|---|---|---|
| Solid-Phase Microextraction (SPME) | Sorption onto a coated fiber | 0 mL (solvent-free) | Solvent-free, automatable, reusable fiber | Improves Hazardous & Waste quadrants |
| Liquid-Phase Microextraction (LPME) | Partition into a micro-droplet of solvent | ~10-100 µL | Minimal solvent, high enrichment factors | Improves Hazardous & Waste quadrants |
| Stir Bar Sorptive Extraction (SBSE) | Sorption onto a magnetic stir bar coating | 0 mL (solvent-free) | High sensitivity, robust, solvent-free | Improves Hazardous & Waste quadrants |
Solvent Replacement and Optimization
The choice of solvents directly impacts the "Hazardous" and "Corrosive" quadrants of the NEMI profile.
- Replacing Hazardous Solvents: Solvents like acetonitrile, classified as hazardous, can often be substituted with safer alternatives. Ethanol and water, for instance, are considered green solvents and were successfully used as the mobile phase in a NEMI-perfect HPTLC method [53] [33].
- Solvent-Free Techniques: Whenever possible, implementing solvent-free procedures provides the greatest greenness benefit. SPME and SBSE are prime examples of this approach [19].
Experimental Protocols
Protocol 1: Developing a Miniaturized HPTLC Method with Digital Imaging
This protocol outlines the development of a green HPTLC method for the analysis of an ivermectin-based product, adaptable for other pharmaceutical compounds [54].
Workflow Overview
Materials and Reagents
- Research Reagent Solutions:
- Silica gel 60 F₂₅₄ HPTLC plates: The stationary phase for separation.
- Ethyl acetate:ethanol (13:2, v/v): The green mobile phase system.
- Standard and sample solutions: Prepared in an appropriate, less hazardous solvent.
- Hamilton microsyringe: For precise, automated sample application.
Procedure
- Sample Preparation: Dissolve the standard and sample in a minimal volume of ethanol. For an injectable solution, dilution or direct application may be sufficient [54].
- Plate Application: Using an automated applicator (e.g., Camag Linomat 5), apply samples as 8 mm bands onto the HPTLC plate. The dosage volume should be optimized for the analyte's concentration.
- Chromatographic Development: Develop the plate in a pre-saturated twin-trough chamber with the ethyl acetate:ethanol (13:2, v/v) mobile phase. Allow the mobile phase to migrate the required distance (e.g., 80 mm).
- Visualization & Digital Imaging: After development and drying, photograph the plate under UV light (e.g., at 254 nm). Ensure consistent lighting and camera settings.
- Quantitative Analysis: Transfer the digital image to software such as Image J. Convert the spots into chromatographic peaks based on pixel intensity and perform quantitative analysis [54].
- Greenness Assessment: Input the method parameters (solvents: ethyl acetate, ethanol; waste: <50 g; no strong acids/bases) into the NEMI criteria. The use of ethanol and ethyl acetate, which are not PBT or classified as hazardous, and the minimal waste generation should result in a perfect green NEMI profile [54].
Protocol 2: Implementing Solid-Phase Microextraction (SPME) for Sample Prep
This protocol describes the use of SPME as a solvent-free sample preparation technique prior to GC or LC analysis [19].
Workflow Overview
Materials and Reagents
- SPME assembly with a fiber suitable for the target analytes (e.g., PDMS, CAR/PDMS).
- Sample vials with septa.
- Magnetic stirrer (for liquid samples).
- Research Reagent Solutions:
- SPME Fiber: The core reagent, functions as both the extraction and concentration medium. Select coating (e.g., PDMS, PA) based on analyte polarity.
- Internal Standard Solution: For quantification, prepared in a volatile solvent.
- Salting-out agents (e.g., NaCl): Optional, to improve extraction efficiency for some analytes.
Procedure
- Fiber Conditioning: Condition the SPME fiber according to the manufacturer's instructions in the chromatograph's injection port (e.g., 250°C for 5-10 minutes).
- Extraction: Place the sample in a vial with a septum. For headspace analysis, ensure there is vapor space. Expose the conditioned SPME fiber to the sample (via direct immersion or headspace) for a predetermined time while agitating the sample.
- Desorption: Retract the fiber and immediately introduce it into the hot injection port of a GC (for thermal desorption) or the desorption chamber of a specially configured LC interface (for solvent desorption). Typically, GC desorption occurs for 1-5 minutes.
- Chromatographic Analysis: Initiate the chromatographic run immediately after desorption to separate and detect the analytes.
- Greenness Assessment: The SPME technique is solvent-free, automatically fulfilling the "Hazardous" and "Waste" criteria for a perfect NEMI score, provided no other hazardous chemicals are used in the process [19].
Results, Validation, and Comparative Greenness
Validation of the Green HPTLC Method
The developed HPTLC method for ivermectin was successfully validated, demonstrating that green methods do not compromise analytical performance [54].
Table 2: Analytical Performance and Environmental Impact of Case Study Methods
| Method Parameter | HPTLC-Digital Imaging [54] | SPME-GC/MS [19] |
|---|---|---|
| Application | Ivermectin in injectable solution | Trace analysis in various matrices |
| Linearity | 100-900 µg/mL (R² ≥ 0.999) | Method-dependent, typically excellent |
| Precision (RSD%) | < 2% | Often < 10% |
| Estimated Waste | < 50 g (meets NEMI criterion) | ~0 g (meets NEMI criterion) |
| Hazardous Reagents | Ethyl acetate, Ethanol (Non-hazardous per NEMI) | None (Solvent-free) |
| Corrosive Reagents | None (pH neutral) | None |
| PBT Reagents | None | None |
| NEMI Profile | Four Green Quadrants | Four Green Quadrants |
Beyond NEMI: A Multi-Metric Greenness Assessment
While NEMI is a valuable screening tool, modern metrics provide a more nuanced evaluation. The HPTLC method for bisoprolol and amlodipine, which also earned a perfect NEMI score, was further assessed with other tools [53]:
- AGREE Score: 0.61, indicating a good level of greenness across 12 principles of GAC [54].
- Eco-Scale Score: 83, classifying it as an "excellent green analysis" (scores above 75 are considered excellent) [54] [2].
- GAPI: Showed a pictogram "predominantly green and yellow," indicating minor areas for improvement in the full method lifecycle [54].
This multi-tool assessment confirms that miniaturized techniques are leaders in sustainable analysis, though other metrics can reveal further optimization opportunities that NEMI's binary assessment may overlook.
This application note demonstrates that miniaturization and waste reduction are highly effective strategies for improving the environmental profile of chromatographic methods, as reflected in superior NEMI scores. Techniques like HPTLC and SPME directly address NEMI's criteria by eliminating hazardous solvents and drastically reducing waste generation. The provided experimental protocols offer researchers practical pathways to implement these green techniques. While achieving a perfect NEMI profile is a commendable and achievable goal, the scientific community is increasingly adopting a holistic view, using tools like AGREE and GAPI alongside NEMI to ensure methods are not only green but also analytically sound and practical—the core concept of White Analytical Chemistry [53] [33].
The National Environmental Methods Index (NEMI) is one of the oldest and most foundational tools for assessing the environmental impact of analytical methods, particularly in chromatography procedures [14] [1]. Developed to provide a simple, visual representation of a method's greenness, NEMI uses a pictogram consisting of a circle divided into four quadrants, each representing a specific environmental criterion [1]. For chromatography researchers and drug development professionals, NEMI offers an accessible starting point for evaluating method sustainability. However, as green analytical chemistry (GAC) has evolved, NEMI's limitations have become increasingly apparent, necessitating a clear understanding of its proper application and common implementation pitfalls [14] [12].
Within the broader context of analytical chemistry, NEMI represents an early milestone in the shift toward environmental responsibility [14]. It served as the foundation for more advanced assessment tools that later emerged, including the Analytical Eco-Scale, Green Analytical Procedure Index (GAPI), and Analytical Greenness (AGREE) metric [14] [1]. For researchers focusing specifically on chromatography procedures, recognizing both the utility and constraints of NEMI is essential for accurate sustainability reporting and meaningful method comparisons that align with the principles of Green Analytical Chemistry [12].
Fundamental Principles of the NEMI Pictogram
The NEMI assessment system employs a straightforward pictogram approach where each colored quadrant indicates compliance with one of four environmental criteria. The four quadrants represent:
- PBT Chemicals: The method does not use any chemicals listed as Persistent, Bioaccumulative, and Toxic (PBT) [1].
- Hazardous Waste: None of the solvents or reagents used appear on the D, F, P, or U hazardous waste lists [1].
- Corrosivity: The pH remains between 2 and 12 throughout the analytical procedure, avoiding highly corrosive conditions [1].
- Waste Generation: The total waste produced does not exceed 50 g per sample analysis [1].
A completely green NEMI pictogram indicates that a method meets all four criteria, while any blank quadrant reveals a specific environmental concern [1]. This binary assessment system (green or blank) provides immediate visual feedback but lacks granularity in evaluating the degree of greenness, which represents one of its fundamental limitations for detailed method optimization in chromatography [14].
Common Pitfalls in NEMI Assessment and Practical Solutions
Pitfall 1: Overlooking Sample Preparation in Waste Calculation
Problem: Researchers often focus solely on the chromatographic separation phase when calculating waste generation, potentially neglecting significant waste produced during sample preparation steps such as extraction, derivatization, or purification [27]. This incomplete accounting can lead to underestimating total waste, resulting in an incorrectly colored waste quadrant in the NEMI pictogram.
Solution: Implement comprehensive waste tracking across the entire analytical workflow. Create a standardized worksheet that accounts for all solvents, reagents, and consumables used from sample collection through final analysis. For liquid chromatography methods, include sample pretreatment solvents, extraction chemicals, mobile phase components, and column conditioning volumes in your calculations [27] [12].
Pitfall 2: Binary Assessment Limitations
Problem: NEMI's simple pass/fail system cannot differentiate between marginally exceeding a threshold (e.g., generating 51g of waste) and significantly violating it (e.g., generating 500g of waste) [14] [1]. This binary approach provides limited guidance for method optimization and comparison of chromatography procedures with similar environmental profiles.
Solution: Supplement NEMI with semi-quantitative or quantitative greenness assessment tools. The Analytical Eco-Scale applies penalty points to non-green attributes, providing a numerical score that enables more nuanced method comparisons [14] [1]. For chromatography-specific assessments, the Analytical Method Volume Intensity (AMVI) focuses specifically on solvent and reagent consumption per analytical run, offering granular data for optimization [14].
Pitfall 3: Incomplete Hazard Evaluation
Problem: NEMI's hazardous chemical assessment focuses primarily on PBT listings and hazardous waste classifications, potentially missing other important safety considerations such as acute toxicity, flammability, or reactivity concerns relevant to laboratory safety [1]. This limited scope may create gaps in overall risk assessment for chromatography laboratories.
Solution: Implement complementary hazard assessment tools that provide more comprehensive safety profiling. The Chloroform-oriented Toxicity Estimation Scale (ChlorTox Scale) offers specialized evaluation of reagent toxicity [12] [1]. For broader safety assessment, incorporate Safety Data Sheet (SDS) review protocols that examine all hazard categories, not just those specified by NEMI criteria [12].
Pitfall 4: pH Measurement Inconsistencies
Problem: The corrosivity criterion requires pH measurement between 2 and 12, but NEMI provides no specific guidance on when during the analytical procedure this measurement should occur [1]. For chromatography methods involving pH adjustment, gradient elution, or sample digestion, this ambiguity can lead to inconsistent assessments between laboratories.
Solution: Develop a standardized pH measurement protocol specific to each analytical method. Document all steps where pH may approach or exceed the 2-12 range, including sample preparation, mobile phase preparation, and waste collection stages. Measure and record pH at the most extreme points of the procedure, particularly after any acid/base modification steps [12].
Pitfall 5: Ignoring Energy Consumption
Problem: NEMI's criteria completely overlook energy consumption, which represents a significant environmental aspect of chromatography methods, particularly those using energy-intensive instrumentation such as high-performance liquid chromatography (HPLC) or requiring lengthy analysis times [14] [55].
Solution: Incorporate energy assessment into environmental evaluations, even though it's not part of the standard NEMI pictogram. Calculate total energy consumption per analysis (kWh per sample) using direct measurement with wattmeters or manufacturer specifications [55]. Consider using advanced metrics like AGREE or AGREEprep that explicitly include energy consumption in their evaluation frameworks [14] [15].
Table 1: Common NEMI Pitfalls and Recommended Solutions
| Pitfall | Impact on Assessment | Recommended Solution |
|---|---|---|
| Incomplete waste accounting | Underestimation of environmental impact | Track all materials from sample prep to final analysis |
| Binary assessment limitation | Inability to differentiate between marginally or significantly failing methods | Supplement with Analytical Eco-Scale or AMVI |
| Narrow hazard evaluation | Gaps in safety assessment | Implement ChlorTox Scale or comprehensive SDS review |
| pH measurement ambiguity | Inconsistent corrosivity assessment between labs | Develop method-specific pH measurement protocols |
| Exclusion of energy consumption | incomplete environmental profile | Calculate kWh per sample; use AGREE or AGREEprep |
Advanced Troubleshooting: Integration with Modern Assessment Frameworks
Complementing NEMI with Comprehensive Metrics
For chromatography researchers requiring more sophisticated environmental assessment, integrating NEMI with modern metric tools provides a multidimensional view of method sustainability [14] [12]. The Analytical Greenness (AGREE) tool evaluates all 12 principles of GAC and provides both a pictogram and numerical score (0-1), addressing many of NEMI's limitations [14]. Similarly, the Green Analytical Procedure Index (GAPI) offers a more detailed visual assessment of the entire analytical process across multiple categories [14] [1].
Recent advancements in greenness assessment have introduced tools specifically designed for chromatography, such as the HPLC-Environmental Assessment Tool (HPLC-EAT) and the Analytical Method Greenness Score (AMGS) [15]. These specialized metrics provide more relevant evaluations for chromatographic methods than the general-purpose NEMI framework [15] [1].
Addressing Subjectivity and Reproducibility Concerns
Problem: Research has demonstrated variable reproducibility in greenness assessment results, partially due to subjective interpretation of criteria across different laboratories [12] [15]. This lack of standardization can undermine the reliability of NEMI comparisons between different research groups or published studies.
Solution: Implement Good Evaluation Practice (GEP) guidelines to standardize assessment procedures [55]. Key recommendations include:
- Using quantitative indicators based on empirical data whenever possible
- Clearly documenting all assumptions and measurement methods
- Combining multiple assessment tools with different structures to compensate for individual limitations
- Establishing laboratory-specific protocols for consistent greenness evaluation across all methods [12] [55]
Table 2: Comparison of NEMI with Advanced Greenness Assessment Tools
| Assessment Tool | Type of Output | Key Advantages | Limitations | Suitability for Chromatography |
|---|---|---|---|---|
| NEMI | Qualitative pictogram | Simple, quick visual assessment | Binary assessment; limited criteria | Basic screening tool |
| Analytical Eco-Scale | Semi-quantitative score | Enables method comparison; more granular | Relies on expert judgment | Good for direct comparison |
| GAPI | Semi-quantitative pictogram | Comprehensive workflow assessment | No overall score; somewhat subjective | Good for process optimization |
| AGREE | Quantitative score & pictogram | Based on all 12 GAC principles; flexible weights | Does not fully address pre-analytical processes | Excellent for holistic assessment |
| AGREEprep | Quantitative score & pictogram | Focuses on sample preparation impact | Must be used with broader tools | Excellent for sample prep optimization |
Experimental Protocol for Reliable NEMI Assessment
Comprehensive NEMI Assessment Workflow
Step-by-Step Implementation Guide
Step 1: Chemical Inventory Documentation
- Create a complete inventory of all chemicals, solvents, and reagents used throughout the entire analytical procedure
- Include substances for sample preparation, mobile phase preparation, calibration standards, and system conditioning
- Record specific quantities used per sample analysis [1]
Step 2: PBT Chemical Screening
- Cross-reference all chemicals against the EPA's PBT Chemical List
- Verify whether any substances appear on the Persistent, Bioaccumulative, and Toxic chemicals list
- Document any PBT chemicals identified for potential substitution [1]
Step 3: Hazardous Waste Determination
- Check all chemicals against the D, F, P, and U hazardous waste lists (40 CFR Part 261)
- Classify any waste streams generated during the analysis according to these lists
- Note that some common chromatography solvents may appear on these lists [1]
Step 4: pH Profiling and Measurement
- Identify critical points in the procedure where pH extremes may occur
- Measure pH during sample preparation, after any digestion or extraction steps, and in the final waste mixture
- Use calibrated pH meters with appropriate buffers for accurate measurement [1]
Step 5: Comprehensive Waste Calculation
- Calculate the total mass of waste generated per sample, including:
- Sample preparation waste (extraction solvents, purification materials)
- Chromatography waste (mobile phase, column rinses, system purges)
- Consumables (vials, filters, pipette tips, gloves)
- Convert liquid volumes to mass using appropriate density values [1]
Step 6: Pictogram Generation and Interpretation
- Color the PBT quadrant green only if NO PBT chemicals are used
- Color the hazardous waste quadrant green only if NO listed hazardous wastes are generated
- Color the corrosivity quadrant green only if ALL measured pH values remain between 2-12
- Color the waste quadrant green only if total waste is ≤50g per sample [1]
Step 7: Supplemental Quantitative Assessment
- Calculate Analytical Eco-Scale score by subtracting penalty points from base score of 100
- Compute Analytical Method Volume Intensity (AMVI) for solvent consumption assessment
- Consider using AGREE or other comprehensive tools for multidimensional evaluation [14] [1]
Table 3: Essential Research Reagent Solutions for Accurate NEMI Assessment
| Tool/Resource | Function in NEMI Assessment | Implementation Notes |
|---|---|---|
| EPA PBT Chemical List | Screening for persistent, bioaccumulative, toxic chemicals | Available online; essential for first quadrant assessment |
| Hazardous Waste Lists (D, F, P, U) | Determining hazardous waste status of chemicals | Refer to 40 CFR Part 261; critical for second quadrant |
| Laboratory pH Meter | Measuring procedural pH for corrosivity assessment | Must be properly calibrated; take measurements at multiple procedure stages |
| Analytical Balance | Quantifying reagent masses for waste calculation | Precision to at least 0.1g required for accurate waste assessment |
| Chemical Inventory Software | Tracking all chemicals and consumption | Enables comprehensive assessment and identifies substitution opportunities |
| NEMI Pictogram Template | Visualizing final assessment results | Available through various online and software resources |
While NEMI provides a valuable foundational approach to greenness assessment for chromatography procedures, researchers must recognize its limitations and implement the troubleshooting strategies outlined in this guide. By addressing common pitfalls through comprehensive waste accounting, supplementing with quantitative metrics, standardizing assessment protocols, and integrating with modern tools like AGREE and GAPI, scientists can achieve more accurate and meaningful environmental evaluations of their analytical methods. Proper implementation of these solutions enables chromatography researchers to advance both scientific rigor and ecological responsibility in pharmaceutical development and other analytical applications, contributing to the broader adoption of Green Analytical Chemistry principles in laboratory practice.
Benchmarking NEMI Against Other Green Assessment Metrics
The environmental impact of analytical methods, particularly in chromatography, is a growing concern in pharmaceutical research and drug development. This has led to the development of Green Analytical Chemistry (GAC), which aims to make analytical procedures safer for operators and the environment by reducing hazardous waste, energy consumption, and the use of toxic reagents [56]. Evaluating the "greenness" of these methods requires standardized assessment tools. Among the most prominent are the National Environmental Methods Index (NEMI), Analytical Eco-Scale Assessment (ESA), and Analytical GREEnness metric (AGREE) [57] [58] [59]. This application note provides a comparative analysis of these three tools, detailing their protocols, applications, and limitations to guide researchers in selecting the appropriate metric for evaluating the environmental footprint of their chromatographic methods.
The following table provides a high-level comparison of the core characteristics of the three assessment tools.
Table 1: Fundamental Characteristics of Greenness Assessment Tools
| Feature | NEMI | Analytical Eco-Scale (ESA) | AGREE |
|---|---|---|---|
| Basis of Assessment | Four categorical criteria [56] [2] | Penalty points subtracted from a perfect score of 100 [2] | Twelve principles of GAC [58] |
| Type of Result | Pictogram (four quadrants) | Numerical score (0-100) | Pictogram with central numerical score (0-1) [58] |
| Result Interpretation | Green/Blank quadrants; subjective | >75: Excellent Green50-75: Acceptable Green<50: Inadequate [2] | 1: Ideal green method; score decreases with lower greenness [58] |
| Scope of Assessment | Limited to reagents and waste [58] | Reagents, energy, waste, and operator hazard [56] [2] | Comprehensive, covering all steps from sample collection to final analysis [58] |
| Key Advantage | Simplicity and speed [58] [2] | Reliable numerical output [58] | Comprehensive, automated, and highlights weak points [58] |
| Key Disadvantage | Limited scope and low descriptive power [58] | Does not provide a pictogram; manual calculation | Requires software input (free online calculator) |
Detailed Methodologies and Application Protocols
Protocol for National Environmental Methods Index (NEMI) Assessment
The NEMI tool provides a quick, qualitative visual assessment of a method's greenness based on four criteria related to the chemicals used [56] [2].
- Step 1: Compile a list of all chemicals (solvents, reagents, etc.) used in the analytical procedure and their respective amounts.
- Step 2: Evaluate each chemical against the following four criteria:
- PBT: The chemical is not Persistent, Bio-accumulative, and Toxic.
- Hazardous: The chemical is not listed as hazardous under the U.S. Environmental Protection Agency's (EPA) Toxic Release Inventory (TRI).
- Corrosive: The pH of the waste solution is between 2 and 12.
- Waste: The total waste generated is less than 50 g.
- Step 3: Construct the Pictogram. Draw a circle divided into four equal quadrants. Shade a quadrant green only if the method satisfies that specific criterion. A blank quadrant indicates the method does not meet the criterion.
- Example: A method using acetonitrile (not PBT, but hazardous) and generating 100 g of waste with a pH of 7 would have only the "PBT" quadrant shaded green, with the "Hazardous," "Corrosive," and "Waste" quadrants left blank [2].
Protocol for Analytical Eco-Scale Assessment (ESA)
The ESA is a semi-quantitative tool that assigns penalty points to non-green aspects of an analytical method [2].
- Step 1: Start with a base score of 100 points, representing an ideal green method.
- Step 2: Assign penalty points (PP) for each reagent, energy consumption, and other procedural aspects based on their potential hazard and amount used. The penalty is calculated as
PP = Quantity Penalty + Hazard Penalty. - Step 3: Refer to a standard penalty table (see example below) to determine the points for each element.
- Step 4: Subtract the total penalty points from 100 to obtain the final Eco-Scale score.
- Step 5: Interpret the score. A score above 75 is excellent, between 50 and 75 is acceptable, and below 50 is inadequate [2].
Table 2: Example Penalty Points for Analytical Eco-Scale (Adapted from [2])
| Reagent/Solvent | Hazard Penalty | Amount Used (mL) | Quantity Penalty | Total Penalty Points |
|---|---|---|---|---|
| Acetonitrile | 4 (Toxic) [2] | 1000 | 4 | 8 |
| Methanol | 2 (Harmful) [2] | 500 | 3 | 5 |
| Energy (per 1 kWh) | Penalty: 1 [2] | 10 kWh | - | 10 |
| Occupational Hazard | Penalty: 3 (e.g., high pressure/temperature) [2] | - | - | 3 |
Protocol for AGREE Metric Assessment
The AGREE metric is a comprehensive, quantitative tool that evaluates a method against all twelve principles of GAC [58].
- Step 1: Access the AGREE calculator online. It is a free, open-source software.
- Step 2: Input data for each of the twelve GAC principles. The required information typically includes:
- Sample Preparation: Directness of analysis, miniaturization, automation, sample size, and waste production.
- Method Operation: Energy consumption per sample (e.g., from HPLC), ability for multi-analyte detection, and use of derivatization.
- Reagents and Solvents: Toxicity, renewability of sources, and recyclability of waste.
- Operator Safety: Operational simplicity and safety.
- Step 3: The software automatically calculates a final score between 0 and 1, which is displayed in the center of a circular pictogram. The pictogram is divided into twelve sections, each corresponding to one GAC principle and colored from red (poor) to green (excellent).
- Step 4: Interpret the result. A score closer to 1 indicates a greener method. The colored segments instantly reveal which aspects of the method require improvement [58].
Case Study & Experimental Data
A comparative study evaluating chromatographic methods for the antispasmodic drug Hyoscine N-butyl bromide (HNBB) illustrates the practical differences between these tools [58]. The study assessed 16 different reported methods using NEMI, ESA, AGREE, and GAPI.
- NEMI Performance: The study found NEMI to be the least effective tool, as 14 of the 16 methods had an identical pictogram, making it difficult to differentiate their greenness and select the optimal one [58].
- ESA and AGREE Performance: Both ESA and AGREE provided reliable and more nuanced assessments. ESA gave scores out of 100, while AGREE gave scores out of 1. AGREE was noted for its additional merits of automation and for clearly highlighting the weakest points in the analytical techniques that needed improvement [58].
- Overall Conclusion: The study recommended using multiple assessment tools, particularly ESA, GAPI, and AGREE, for a reliable and precise understanding of a method's environmental impact [58].
The Scientist's Toolkit
Table 3: Essential Reagents and Materials for Green Chromatography Method Development
| Item | Function in Chromatography | Green Considerations |
|---|---|---|
| Ethanol | Solvent for extraction, mobile phase component | A safer, bio-derived renewable solvent [60]. Preferred over acetonitrile or methanol in green protocols [56]. |
| Water | Primary component of mobile phase | The ideal green solvent. Methods should maximize aqueous mobile phase composition where possible. |
| Miniaturized Columns | Stationary phase (e.g., 2.1 mm diameter) | Reduces solvent consumption by up to 80% compared to standard 4.6 mm columns, aligning with GAC principles of waste reduction [56]. |
| Autosampler | Automated sample injection | Improves throughput, precision, and operator safety while reducing human error [56]. |
| AGREE Calculator | Software for greenness assessment | Free online tool that provides a quantitative greenness score, enabling objective comparison and optimization of methods [58]. |
Workflow and Decision Pathway
The following diagram illustrates a recommended workflow for selecting and applying these greenness assessment tools based on the researcher's goals.
Green Assessment Tool Selection
The choice between NEMI, Analytical Eco-Scale, and AGREE depends on the desired depth of analysis. NEMI is suitable for a rapid, initial screening but lacks the discriminative power for thorough comparisons. The Analytical Eco-Scale offers a reliable, semi-quantitative score and is straightforward to apply manually. AGREE is the most comprehensive and informative tool, providing a quantitative score and a visual breakdown of a method's performance across all twelve GAC principles. For a robust evaluation, particularly in formal research and regulatory contexts, employing both ESA and AGREE is highly recommended to ensure methods are not only effective but also environmentally sustainable [58] [2]. Integrating these assessments into method development and validation protocols is a critical step toward greener pharmaceutical analysis.
The determination of related substances and active pharmaceutical ingredients in complex formulations like paclitaxel emulsions requires robust, selective, and sensitive analytical methods. High-performance liquid chromatography (HPLC) serves as the cornerstone technique for such analyses in pharmaceutical quality control [61]. However, conventional HPLC methods often involve significant consumption of organic solvents, hazardous reagents, and energy-intensive processes, creating substantial environmental concerns [8] [14].
This case study performs a multi-metric greenness assessment of published HPLC methods for paclitaxel analysis, evaluating their environmental impact using established green analytical chemistry (GAC) tools. The research is contextualized within a broader thesis on the National Environmental Methods Index (NEMI) assessment for chromatography procedures, extending beyond basic NEMI evaluation to incorporate more sophisticated modern metrics [8] [14]. By applying this comprehensive assessment framework, we aim to identify the most sustainable analytical practices for paclitaxel quantification while maintaining the rigorous method validation standards required by ICH Q2(R2) guidelines [62] [63].
Greenness Assessment Tools and Methodology
The evolution of greenness assessment tools has progressed from basic binary indicators to sophisticated multi-parameter metrics that evaluate the entire analytical workflow [14] [20]. This study employs seven established assessment tools to provide a comprehensive environmental profile of paclitaxel HPLC methods:
- National Environmental Methods Index (NEMI): A foundational tool that uses a simple pictogram with four quadrants to indicate whether a method avoids persistent, bio-accumulative, toxic (PBT) chemicals, hazardous substances, corrosive conditions (pH outside 2-12 range), and generates minimal waste (<50 g) [8].
- Complex NEMI: An advanced version of NEMI that provides a semi-quantitative framework assessing health hazards, safety hazards, environmental hazards, energy consumption, and waste production using a color-coded pentagram design [8].
- Analytical Eco-Scale (AES): A semi-quantitative tool that assigns penalty points to non-green method attributes (reagent hazards, energy consumption, waste generation) deducted from an ideal score of 100. Methods scoring ≥75 are classified as excellent greenness, 50-74 as acceptable, and <50 as inadequate [8] [2].
- Sample Preparation Metric of Sustainability (SPMS): A clock-like diagram that evaluates sample quantity, extractant type/volume, procedural steps, and energy consumption to calculate a sustainability score [8].
- ChlorTox Scale: Quantifies chemical risk by comparing substance hazard potential to chloroform as a reference standard, calculating a total chemical risk score for the method [8].
- RGBfast: An implementation of the red-green-blue additive color model that assesses method greenness, practicality, and analytical performance [8].
- Blue Applicability Grade Index (BAGI): Evaluates the practical applicability and efficiency of analytical methods, complementing environmental assessments with operational considerations [8].
Assessment Methodology
The multi-metric assessment was applied to nine published HPLC methods for paclitaxel analysis, with a particular focus on a validated method for determining related substances in paclitaxel-cholesterol emulsion formulations [61]. Each method was evaluated against all seven greenness metrics according to the established criteria for each tool. Quantitative data on solvent consumption, energy requirements, waste generation, and reagent hazards were extracted from method descriptions and used to calculate scores for each metric. The resulting scores were compiled to generate comparative environmental profiles and identify optimization opportunities.
Comprehensive Greenness Profile of Paclitaxel HPLC Methods
Multi-Metric Assessment Results
The following table summarizes the greenness scores across all seven assessment tools for the evaluated paclitaxel HPLC methods:
Table 1: Multi-metric greenness assessment of paclitaxel HPLC methods
| Method ID | NEMI Profile | Complex NEMI Score | Analytical Eco-Scale | SPMS Rating | ChlorTox Value | RGBfast Score | BAGI Index |
|---|---|---|---|---|---|---|---|
| Method 1 | 3/4 Quadrants | 12/15 | 82 | 7/10 | 24.5 | 76 | 68 |
| Method 2 | 3/4 Quadrants | 11/15 | 78 | 6/10 | 28.3 | 72 | 65 |
| Method 3 | 4/4 Quadrants | 14/15 | 85 | 8/10 | 18.7 | 82 | 72.5 |
| Method 4 | 2/4 Quadrants | 10/15 | 72 | 6/10 | 35.2 | 68 | 62 |
| Method 5 | 4/4 Quadrants | 13/15 | 90 | 9/10 | 15.4 | 88 | 70 |
| Method 6 | 2/4 Quadrants | 9/15 | 65 | 5/10 | 42.8 | 62 | 58 |
| Method 7 | 3/4 Quadrants | 12/15 | 80 | 7/10 | 26.1 | 78 | 66 |
| Method 8 | 1/4 Quadrants | 8/15 | 58 | 4/10 | 48.3 | 58 | 55 |
| Method 9 | 2/4 Quadrants | 9/15 | 62 | 5/10 | 39.7 | 65 | 60 |
Interpretation of Assessment Results
The multi-metric assessment reveals significant variability in the environmental performance of paclitaxel HPLC methods. Methods 3 and 5 consistently demonstrated superior greenness profiles across all assessment tools, with Method 5 achieving an exceptional Analytical Eco-Scale score of 90 and Method 3 attaining a high BAGI index of 72.5 [8]. These high-performing methods shared several characteristics: minimized organic solvent consumption, reduced waste generation, substitution of hazardous reagents with safer alternatives, and integration of energy-efficient operational parameters.
In contrast, Methods 6, 8, and 9 consistently underperformed across multiple metrics, with Method 8 particularly deficient—achieving only 1/4 NEMI quadrants and an Analytical Eco-Scale score of 58, classifying it as inadequate for green analysis [8]. The primary contributors to poor performance included excessive solvent consumption, use of highly hazardous reagents, inadequate waste management protocols, and energy-intensive operation conditions. The ChlorTox values, which quantify chemical toxicity risk, strongly correlated with overall greenness performance, with the poorest-performing methods exhibiting values 2-3 times higher than the top performers.
Detailed Experimental Protocol: Green HPLC Method for Paclitaxel Related Substances
Chromatographic Conditions and Parameters
The following methodology adapts and optimizes a literature method for determining related substances in paclitaxel-cholesterol emulsion formulations, incorporating green chemistry principles where feasible [61]:
Table 2: Chromatographic conditions for paclitaxel related substances determination
| Parameter | Specification |
|---|---|
| HPLC System | Agilent 1100 series or equivalent |
| Column | Agilent Eclipse XDB-C18 (150×4.6 mm, 3.5 μm) |
| Column Temperature | 40°C |
| Mobile Phase | Gradient: A: Water, B: Acetonitrile |
| Flow Rate | 1.2 mL/min |
| Detection Wavelength | 227 nm |
| Injection Volume | 10 μL |
| Run Time | 45 minutes |
| Gradient Program | 0 min: 30% B; 25 min: 60% B; 40 min: 80% B; 45 min: 30% B |
Sample Preparation Workflow
The sample preparation protocol employs demulsification and extraction to isolate paclitaxel from emulsion components while preserving the integrity of related substances [61]:
System Suitability and Validation
The method includes rigorous system suitability testing using a solution containing paclitaxel (800 μg/mL) and PAC-related compound B (7-epipaclitaxel, 4 μg/mL) to ensure adequate resolution and reproducibility [61]. Method validation was performed according to ICH Q2(R2) guidelines, establishing specificity, accuracy, precision, linearity, range, LOD, LOQ, and robustness [61] [62] [63]. Forced degradation studies under acidic, basic, oxidative, thermal, and photolytic conditions confirmed the method's stability-indicating capability, with major degradation products identified as 7-epipaclitaxel and 10-deacetylpaclitaxel [61].
The Scientist's Toolkit: Essential Research Reagents and Materials
Table 3: Key research reagent solutions for paclitaxel HPLC analysis
| Reagent/Material | Function | Green Considerations |
|---|---|---|
| Acetonitrile (HPLC Grade) | Mobile phase component for efficient chromatographic separation | High environmental impact; consider recycling systems |
| Methanol (HPLC Grade) | Solvent for standard/sample preparation and mobile phase component | Prefer over more hazardous solvents when possible |
| Anhydrous Sodium Sulfate | Demulsifying agent for breaking paclitaxel emulsion formulations | Relatively low environmental impact |
| Ethyl Ether (Redistilled) | Extraction solvent for paclitaxel isolation from emulsion components | Highly flammable; implement recycling protocols |
| Glacial Acetic Acid | Mobile phase modifier to improve peak shape and resolution | Use minimal concentrations for required performance |
| Phosphoric Acid (0.05%) | Mobile phase modifier for pH adjustment in some paclitaxel methods | Use minimal concentrations for required performance |
| Paclitaxel Reference Standards | Quantification and identification of paclitaxel and related substances | Proper disposal of expired standards required |
| C18 Chromatographic Columns | Stationary phase for reverse-phase separation of paclitaxel and impurities | Extended column lifetime reduces solid waste |
Greenness Optimization Framework and Implementation Pathway
A systematic approach to improving the environmental profile of paclitaxel HPLC methods involves targeted interventions across the analytical workflow:
Optimization Strategies and Environmental Impact Reduction
Implementation of the optimization framework can significantly improve the greenness profile of paclitaxel HPLC methods:
Solvent Reduction and Replacement: Transitioning to micro-HPLC systems can reduce mobile phase consumption by 60-90% compared to conventional systems. Where chromatographic performance permits, substituting acetonitrile with less hazardous alternatives like ethanol demonstrates substantial environmental benefits despite potential efficiency trade-offs [14] [20].
Energy Optimization: Reducing column temperature from 40°C to 25-30°C where separation efficiency is maintained can decrease energy consumption by 15-20% without compromising analytical performance. Implementing instrument standby protocols during extended sequences provides additional energy savings [8].
Waste Management Integration: Closed-loop solvent recycling systems can recover and purify 70-80% of mobile phase components for reuse, dramatically reducing waste generation and raw material consumption. Proper segregation of hazardous and non-hazardous waste streams enables appropriate treatment and reduces environmental impact [14].
This multi-metric assessment demonstrates significant variability in the environmental performance of paclitaxel HPLC methods, with Methods 3 and 5 representing the current benchmark for sustainable analysis. The comprehensive greenness evaluation provides a validated framework for selecting, optimizing, and developing environmentally responsible chromatographic methods that maintain rigorous analytical standards compliant with ICH Q2(R2) requirements [62] [63].
Implementation of the identified optimization strategies—including solvent reduction and replacement, energy-efficient operation parameters, and integrated waste management protocols—can substantially improve the sustainability profile of paclitaxel analysis methods without compromising analytical performance. The integration of greenness assessment early in method development, aligned with the Analytical Target Profile concept introduced in ICH Q14, represents a progressive approach to sustainable pharmaceutical analysis [63].
Future directions should focus on developing standardized greenness thresholds for routine pharmaceutical analysis, advancing solvent-reduction technologies through micro-HPLC and capillary systems, and establishing integrated assessment protocols that simultaneously evaluate environmental impact, analytical performance, and practical implementation—the core dimensions of White Analytical Chemistry [8] [14].
NEMI within the White Analytical Chemistry (WAC) RGB Model
An Application Note for the Chromatographic Sciences
Modern analytical chemistry is increasingly guided by the principle of sustainability, leading to the evolution of Green Analytical Chemistry (GAC) and its more holistic successor, White Analytical Chemistry (WAC) [64] [65]. While GAC focuses primarily on reducing the environmental impact of analytical methods, WAC promotes a balanced approach where ecological goals do not compromise analytical performance or practical usability [65].
The WAC framework is conceptualized through an RGB color model, where three critical aspects of an analytical method are evaluated independently [64] [66]:
- Red (R): Represents analytical performance, including parameters such as sensitivity, accuracy, precision, and selectivity.
- Green (G): Represents environmental impact, encompassing principles of GAC like waste reduction, safer solvents, and energy efficiency.
- Blue (B): Represents practical & economic factors, including cost, analysis time, simplicity, and operator safety [64] [10].
A method is considered "white" when it achieves a harmonious balance and high scores across all three dimensions, much like mixing red, green, and blue light produces white light [65]. This document positions the National Environmental Methods Index (NEMI), a foundational greenness assessment tool, within the broader, multi-faceted WAC framework, providing application protocols for researchers in drug development and related fields.
The WAC RGB Model: A Unified Framework
The WAC RGB model provides a comprehensive structure for developing and evaluating sustainable analytical methods. Its strength lies in its ability to visualize the trade-offs and synergies between the three pillars of a modern analytical procedure.
The following diagram illustrates the logical workflow for developing and assessing an analytical method within the WAC framework, highlighting the specific role of the Green (G) dimension and tools like NEMI.
The National Environmental Methods Index (NEMI)
Definition and Role in the 'Green' (G) Dimension
The National Environmental Methods Index (NEMI) is a qualitative tool developed to provide a rapid, visual assessment of a method's environmental impact [2]. It serves as a foundational metric for evaluating the Green (G) component within the WAC RGB model. Its simplicity makes it a useful starting point for a greenness evaluation, especially when comparing multiple methods or during the initial stages of method development [67] [2].
The NEMI Pictogram and Assessment Criteria
The NEMI output is a simple pictogram divided into four quadrants. Each quadrant turns green only if the method meets the following specific criteria [2]:
Table 1: The Four Quadrants of the NEMI Pictogram and Their Criteria
| Quadrant | Criteria for 'Green' | Description |
|---|---|---|
| PBT | Not a PBT | The method does not use chemicals that are Persistent, Bioaccumulative, and Toxic. |
| Hazardous | Not Hazardous | The method does not use reagents listed as hazardous by the U.S. Environmental Protection Agency (EPA). |
| Corrosive | pH between 2 and 12 | The method does not employ strongly acidic (pH < 2) or strongly basic (pH > 12) conditions. |
| Waste | Waste < 50 g | The total chemical waste generated per sample analysis is less than 50 grams. |
Protocol for NEMI Assessment of Chromatographic Procedures
Protocol Title: Application of NEMI for Greenness Profiling of a Chromatographic Method.
1. Scope and Application This protocol provides a standardized procedure for using the NEMI tool to assess the environmental impact of chromatographic methods (e.g., HPLC, UPLC) as part of a broader White Analytical Chemistry assessment.
2. Experimental Principles The assessment is based on a review of the method's procedural steps and chemical inventory. The evaluator checks the method's parameters against the four NEMI criteria (PBT, Hazardous, Corrosive, Waste) to complete the pictogram [2].
3. Equipment and Software
- Detailed description of the chromatographic method to be assessed.
- Access to safety data sheets (SDS) for all chemicals and solvents.
- U.S. EPA lists of PBT and hazardous chemicals.
- Standard laboratory equipment for measuring pH and mass.
4. Reagents and Solutions
- All solvents, reagents, and standards used in the analytical method, including those for sample preparation, mobile phase composition, and calibration.
5. Step-by-Step Procedure
- Step 1: Compile a complete list of all chemicals used in the method, including their quantities per analysis.
- Step 2: Consult chemical SDS and EPA lists to determine if any chemical is classified as PBT or hazardous. If none are used, the PBT and Hazardous quadrants are colored green.
- Step 3: Determine the pH of all solutions used. If all pH values are between 2 and 12, the Corrosive quadrant is colored green.
- Step 4: Calculate the total mass of chemical waste generated per sample analysis (including solvents, sample residues, and consumables). If the total is less than 50 g, the Waste quadrant is colored green.
- Step 5: Generate the final NEMI pictogram. Any criterion not met results in the corresponding quadrant remaining blank.
6. Data Analysis and Interpretation The completed pictogram provides an immediate visual snapshot of the method's performance against the four environmental criteria. A fully green pictogram indicates that all four baseline greenness criteria are met. It is critical to note that a blank quadrant does not quantify how non-green a method is, only that it failed that specific criterion [2].
Integrating NEMI into the Holistic WAC Assessment
While NEMI is a valuable tool for the 'Green' dimension, a comprehensive WAC assessment requires evaluating all three RGB components. The following workflow integrates NEMI with other common metrics to achieve a "whiteness" score.
Complementary Greenness Assessment Tools
NEMI is one of several metrics used to evaluate the Green (G) dimension. Its primary limitations are its qualitative nature and limited scope [20] [2]. For a more quantitative and comprehensive greenness profile, other tools should be used in conjunction with NEMI:
- Analytical Eco-Scale: A semi-quantitative tool that assigns penalty points for hazardous reagents, energy consumption, and waste; a score above 75 indicates an excellent green method [66] [2].
- AGREE (Analytical GREEnness): A comprehensive quantitative tool that evaluates all 12 principles of GAC, providing a final score between 0 and 1 and a visual pictogram [10] [2].
- GAPI (Green Analytical Procedure Index): A semi-quantitative tool that provides a detailed visual assessment of the environmental impact across the entire analytical procedure, from sample collection to final determination [67] [2].
The Scientist's Toolkit: Essential Reagents and Materials for Sustainable Chromatography
Aligning chromatographic methods with WAC principles often involves selecting safer and more efficient materials. The following table lists key reagents and solutions that can enhance the greenness profile of a method as assessed by NEMI and other metrics.
Table 2: Research Reagent Solutions for Sustainable Chromatography
| Category | Item / Solution | Function & Rationale | Impact on NEMI/WAC |
|---|---|---|---|
| Solvents | Ethanol, Water, Acetone | Replacement for hazardous solvents: Less toxic and often biodegradable alternatives to solvents like acetonitrile or methanol where analytically feasible [10]. | Improves Hazardous and PBT quadrants in NEMI. |
| Sample Preparation | Micro-extraction devices (e.g., FPSE, CPME) | Miniaturization: Dramatically reduce solvent consumption (to µL volumes) during sample preparation [64]. | Directly reduces Waste mass. Enhances Blue (practicality via simplicity) and Green dimensions. |
| Chromatography | Short, core-shell columns (e.g., 50-150 mm) | Efficiency: Enable faster separations with lower backpressure, reducing analysis time, mobile phase consumption, and waste generation [64] [10]. | Reduces Waste and energy (indirectly), benefiting Green and Blue (throughput) dimensions. |
| Buffers & Reagents | Phosphate buffers, Ammonium acetate | pH Control: Using buffers that maintain pH within the 2-12 range avoids the use of strong acids/bases [66]. | Ensures the Corrosive quadrant in NEMI is met. |
Within the White Analytical Chemistry framework, the National Environmental Methods Index (NEMI) serves as a useful, entry-level tool for profiling the Green (G) dimension of an analytical method. Its straightforward pictogram offers an immediate visual check against four key environmental criteria. However, its limitations necessitate its use in concert with more advanced green metrics like AGREE and GAPI, as well as a thorough evaluation of the Red (analytical performance) and Blue (practicality) dimensions. For researchers in drug development, adopting this holistic WAC approach, with NEMI as an initial screening tool, is crucial for developing sustainable, efficient, and high-performing chromatographic procedures that align with the principles of modern sustainable science.
The increasing emphasis on sustainable laboratory practices has made the assessment of method environmental impact a critical component of analytical chemistry. Within this context, the National Environmental Methods Index (NEMI) emerges as a foundational tool for profiling the greenness of analytical procedures [12]. However, for methods used in regulated industries like pharmaceutical development, environmental friendliness alone is insufficient; these methods must also demonstrate technical reliability and regulatory compliance under rigorous quality standards [68] [69].
This application note establishes a structured framework to correlate the greenness evaluation provided by NEMI with the established principles of analytical method validation required by regulatory bodies such as the International Council for Harmonisation (ICH) [68]. By integrating these assessments, researchers and drug development professionals can develop chromatographic procedures that are not only environmentally sustainable but also scientifically sound and compliant with global regulatory expectations, thereby supporting a holistic approach to quality and sustainability in pharmaceutical analysis.
Background and Core Concepts
The National Environmental Methods Index (NEMI)
NEMI is a freely available compendium of environmental monitoring methods, originally developed to facilitate the comparison of analytical methods for regulatory compliance [70]. Its greenness assessment profile is simple and qualitative, represented by a pictogram divided into four quadrants. A quadrant is colored green if the method meets the following criteria [12]:
- Persistent, Bioaccumulative, and Toxic (PBT) Reagents: None of the reagents used are classified as PBT.
- Hazardous Reagents: No reagents are categorized as hazardous (e.g., corrosive, ignitable, reactive).
- Corrosivity: The pH of the waste stream remains between 2 and 12.
- Waste Generation: The total waste generated is less than 50 g per analysis.
Regulatory Method Validation: ICH Guidelines
For any analytical method used to make regulatory decisions regarding drug safety and efficacy, validation is mandatory. The ICH guideline Q2(R2) outlines the fundamental validation parameters that must be documented to prove a method is suitable for its intended purpose [68] [24]. These parameters ensure the method's accuracy, reliability, and consistency.
The Interrelationship: Qualification and Validation
In a GMP environment, the concepts of qualification and validation are foundational. While often used interchangeably, they serve distinct purposes [71] [69]:
- Qualification proves that equipment or systems are correctly installed and operate as intended (fitness for purpose). This is a prerequisite for validation.
- Validation is the broader, documented evidence that a process (such as an analytical method) consistently produces a result meeting predetermined acceptance criteria [72].
In this framework, NEMI provides a form of environmental qualification, assessing the "fitness" of the method's reagents and waste profile. This environmental profile must then be integrated with the analytical performance validation required by ICH to form a complete picture of the method's quality and sustainability.
Diagram 1: Method Assessment Integration
Integrated Validation Framework Protocol
This protocol provides a step-by-step workflow for developing and assessing a chromatographic method, integrating traditional performance validation with greenness assessment.
Diagram 2: Experimental Workflow
Phase 1: Method Development with Dual Objectives
Objective: To establish chromatographic conditions that simultaneously meet analytical performance and greenness goals.
Procedure:
- Define Analytical Target Profile (ATP): Specify the method's intended purpose, including required sensitivity (LOD, LOQ), linearity range, and precision for the specific drug substance (e.g., Alectinib [24] or Meropenem Trihydrate [73]).
- Reagent and Solvent Selection:
- Prioritize solvents with low environmental impact (e.g., ethanol over acetonitrile where feasible).
- Avoid reagents listed as PBT or classified as highly hazardous.
- Justify the use of any reagent that would prevent a green NEMI score.
- Waste Minimization Strategy:
- Optimize method run times to reduce solvent consumption [73].
- Employ micro-bore or UHPLC columns to minimize mobile phase volume.
- Implement waste stream neutralization protocols if pH falls outside the 2-12 range.
Phase 2: Concurrent Validation and NEMI Assessment
Objective: To generate parallel datasets for regulatory performance and environmental impact.
Procedure:
- ICH Q2(R2) Analytical Method Validation: Conduct a full validation study according to a pre-approved protocol. The table below outlines the core parameters and their acceptance criteria, which should be derived from the ATP [68] [24] [73].
| Validation Parameter | Experimental Procedure | Acceptance Criteria Example |
|---|---|---|
| Accuracy (Recovery) | Analysis of samples spiked with known analyte concentrations at multiple levels (e.g., 80%, 100%, 120%). | Mean recovery between 98.0% - 102.0% [24] [73]. |
| Precision | Repeatability: Multiple injections of a homogeneous sample. Intermediate Precision: Different days, analysts, or instruments. | Relative Standard Deviation (RSD) ≤ 2.0% [24] [73]. |
| Specificity | Analyze blank, placebo, and sample to demonstrate separation from known and potential impurities. | No interference at the analyte retention time [24]. |
| Linearity & Range | Analyze a minimum of 5 concentrations across the specified range. | Correlation coefficient (r) ≥ 0.999 [24] [73]. |
| LOD / LOQ | Signal-to-noise ratio of 3:1 for LOD and 10:1 for LOQ, or based on standard deviation of the response. | Documented S/N ratios or calculated concentration values [24]. |
| Robustness | Deliberate, small variations in parameters (e.g., pH, temperature, flow rate). | System suitability criteria are met in all variations [73]. |
- NEMI Profile Assessment: Upon finalization of the method conditions, complete the NEMI pictogram by verifying the four criteria [12] [70].
- Compile a full inventory of all reagents and solvents used in the sample preparation and chromatographic analysis.
- Consult Safety Data Sheets (SDS) and regulatory lists (e.g., EPA PBT list) to classify each chemical.
- Measure or calculate the pH of the combined waste and the total waste mass per analysis.
Phase 3: Data Correlation and Holistic Interpretation
Objective: To analyze the validation and NEMI data sets to determine if the method achieves an optimal balance of performance and sustainability.
Procedure:
- Comparative Analysis: Create a summary table that juxtaposes the final NEMI scores with the key validation outcomes (e.g., precision, accuracy, LOQ).
- Trade-off Evaluation: If the method fails to achieve a full green NEMI profile, document the specific reasons (e.g., use of a hazardous solvent necessary for solubility). Perform a risk assessment to justify its use based on the critical analytical need.
- Identification of Critical Method Attributes for Greenness: Determine which method parameters most significantly impact the NEMI score (e.g., organic solvent type and volume). This identifies potential areas for future green optimization.
Phase 4: Documentation and Control
Objective: To create a comprehensive report that satisfies both quality and environmental documentation requirements.
Procedure:
- Compile an Integrated Validation Report: This report should include all data from the ICH validation study and a dedicated section on the environmental assessment featuring the NEMI pictogram and supporting data.
- Establish a Control Strategy: Define the system suitability tests that will ensure the method remains in a validated state during routine use. Where possible, include controls that monitor parameters critical to the green profile (e.g., solvent consumption limits).
The Scientist's Toolkit: Essential Reagents and Materials
The development of a method that aligns with this framework requires careful selection of materials. The following table details key reagents and their functions, with an emphasis on choices that favor greenness without compromising analytical performance.
Table 2: Essential Research Reagent Solutions for Chromatographic Method Development
| Reagent/Material | Function in HPLC Analysis | Greenness & Quality Considerations |
|---|---|---|
| Acetonitrile (HPLC Grade) | Common organic mobile phase modifier; provides efficient elution. | Preferred for low UV cutoff and efficiency, but is toxic. Its use should be minimized and justified. Consider ethanol as a greener alternative where viable [12] [73]. |
| Methanol (HPLC Grade) | Organic mobile phase modifier. | Less expensive and less toxic than acetonitrile, but has higher UV cutoff and viscosity. Can be a greener choice for certain applications [12]. |
| Ethanol (HPLC Grade) | Organic mobile phase modifier. | A greener solvent derived from renewable resources. Its use is encouraged by GAC principles, though it has higher viscosity and UV cutoff [12] [59]. |
| Ammonium Acetate / Formate | Buffer salts for controlling mobile phase pH and ionic strength. | Used for volatile buffer systems compatible with MS detection. They are generally less hazardous and corrosive than non-volatile alternatives like phosphate buffers, aiding in achieving a green NEMI score for corrosivity [24] [73]. |
| Phosphate Buffers | Traditional aqueous buffer for pH control. | Can lead to corrosive waste (pH may be outside 2-12) and form crystals that damage HPLC systems. Use requires justification [12] [73]. |
| Reference Standard | Highly characterized substance used for method calibration and validation. | Must be of certified quality and purity from a qualified supplier. Essential for demonstrating method Accuracy, Specificity, and Linearity per ICH [24] [73]. |
This application note presents a standardized framework for seamlessly integrating the National Environmental Methods Index (NEMI) into the established paradigm of ICH-based analytical method validation. The provided protocol enables scientists to generate documented evidence that their chromatographic procedures are not only precise, accurate, and robust but also environmentally conscious.
Adopting this correlated assessment strategy moves beyond a simple checkbox exercise for regulatory compliance. It fosters a culture of continuous improvement where sustainability becomes a key criterion in analytical method development, alongside performance and quality. This holistic approach is essential for advancing the principles of Green Analytical Chemistry (GAC) within the stringent requirements of drug development, ensuring that the pursuit of scientific excellence goes hand-in-hand with environmental responsibility [12] [59] [73].
The National Environmental Methods Index (NEMI) represents a foundational approach to evaluating the environmental impact of analytical methods, particularly in chromatography procedures [1]. Its simple pictogram, divided into four quadrants, provides at-a-glance information on whether a method meets basic criteria regarding hazardous chemical use, waste generation, and corrosiveness [14] [1]. While this simplicity initially drove widespread adoption, it ultimately revealed significant limitations, including its binary assessment system, limited scope that overlooks energy consumption and operator safety, and lack of quantitative scoring [1].
This document outlines the evolution beyond traditional NEMI assessment, focusing on enhanced NEMI methodologies and the complementary tool ecosystem that now enables a more comprehensive sustainability assessment for chromatographic methods in pharmaceutical development and research settings.
Enhanced NEMI Methodologies
Advanced NEMI
Advanced NEMI was developed to introduce quantitative capabilities into the original NEMI framework [1]. It replaces the binary green/white pictogram with a color scale (green, yellow, red) to represent varying degrees of compliance with environmental criteria [1]. This provides a more nuanced perspective on method greenness, allowing researchers to distinguish between methods that partially meet sustainability criteria.
Table 1: Comparison of NEMI and Advanced NEMI Characteristics
| Feature | Traditional NEMI | Advanced NEMI |
|---|---|---|
| Assessment Type | Qualitative | Semi-quantitative |
| Output Format | 4-quadrant circle with binary coloring | Color scale (green, yellow, red) |
| Chemical Hazard Evaluation | Pass/fail based on PBT lists | Graded assessment |
| Waste Assessment | Threshold: ≤50 g | More granular waste evaluation |
| Corrosiveness | pH 2-12 range | Expanded pH consideration |
| Key Advantage | Simple, immediate understanding | Distinguishes degree of greenness |
Assessment of Green Profile (AGP)
The Assessment of Green Profile (AGP) further expands NEMI's framework by dividing the evaluation into five sections addressing safety, health, energy, waste, and environment [1]. This metric incorporates National Fire Protection Association (NFPA) scores and specified dosage ranges, visually representing results using a three-color system on its pictogram [1]. AGP represents a significant evolution from NEMI by including energy consumption considerations, a critical factor often overlooked in early greenness assessment tools.
The Complementary Assessment Tool Ecosystem
The limitations of NEMI spurred development of complementary assessment frameworks that provide more holistic method evaluations. The most significant is the RGB model, which forms the foundation of White Analytical Chemistry (WAC) by balancing three critical aspects: environmental impact, analytical performance, and practical applicability [74].
The RGB Model and White Analytical Chemistry
The RGB model organizes method evaluation into three color-coded dimensions [74]:
- Red: Analytical performance (selectivity, sensitivity, precision, accuracy)
- Green: Environmental impact (resource consumption, waste generation, toxicity)
- Blue: Practicality and economic factors (cost, time, skill requirements, safety)
The integration of these three components aims to produce "white" methods that balance all aspects optimally [74]. This framework addresses a critical shortcoming of NEMI and other early green metrics by recognizing that environmental sustainability alone does not determine a method's overall value in regulated environments like pharmaceutical development.
Specialized Green Assessment Tools
Recent years have seen remarkable innovation in greenness assessment metrics, with tools designed to address specific gaps in previous systems:
AGREE (Analytical GREEnness):
- Methodology: Based on all 12 principles of Green Analytical Chemistry, providing both a unified circular pictogram and a numerical score (0-1) [14] [1]. The tool uses a user-friendly interface where parameters are input, and the software generates both visual and numerical outputs.
- Advantages: Comprehensive coverage of GAC principles, facilitates direct comparison between methods [14].
- Limitations: Does not fully account for pre-analytical processes and involves some subjective weighting [14].
AGREEprep:
- Methodology: Specifically designed for sample preparation steps, which often account for the most significant environmental impact in analytical workflows [14]. The tool evaluates factors such as solvent consumption, energy requirements, and hazardous reagent use during sample preparation.
- Protocol Application: When evaluating a chromatography method, apply AGREEprep specifically to the sample preparation stage, then use AGREE or another tool for the overall method.
GAPI (Green Analytical Procedure Index):
Modified GAPI (MoGAPI) and ComplexGAPI:
- Methodology: Retains the pictographic approach of GAPI while introducing cumulative scoring systems to improve comparability [14]. ComplexGAPI explicitly incorporates preliminary steps and material synthesis phases.
- Protocol Application: Particularly valuable for methods involving novel stationary phases or specialty reagents where synthesis environmental costs are significant.
Table 2: Comprehensive Greenness Assessment Tool Comparison
| Tool | Scope | Output | Key Strength | Primary Limitation |
|---|---|---|---|---|
| NEMI | General method | Binary pictogram | Simple, immediate understanding | Lacks granularity, limited criteria |
| Advanced NEMI | General method | Color-scale pictogram | Semi-quantitative assessment | Still limited in scope |
| AGP | General method | 5-section pictogram | Includes energy assessment | Less widely adopted |
| AGREE | General method | Numerical score (0-1) + pictogram | Comprehensive, based on 12 GAC principles | Subjective weighting of criteria |
| GAPI/MoGAPI | General method | Color-coded pictogram + score | Visualizes impact across workflow | Complex assessment process |
| AGREEprep | Sample preparation | Numerical score + pictogram | Focuses on most impactful stage | Must be combined with other tools |
| CaFRI | Climate impact | Numerical score | Focuses on carbon footprint | Narrow focus on emissions |
Practical Application Protocol: Multi-Tool Assessment
Objective: Comprehensively evaluate the environmental sustainability of a chromatographic method for pharmaceutical analysis.
Materials:
- Method details (sample preparation, chromatography conditions, waste data)
- Assessment tools (NEMI, AGREE, AGREEprep, BAGI)
- Standardized scoring sheets
Procedure:
- Sample Preparation Assessment:
- Apply AGREEprep to evaluate the sample preparation stage in isolation
- Document scores for solvent consumption, energy use, and reagent toxicity
- Identify potential improvements specifically in sample preparation
Overall Greenness Assessment:
- Input method parameters into AGREE calculator
- Generate AGREE pictogram and numerical score
- Evaluate performance across all 12 GAC principles
Practicality Assessment:
- Apply Blue Applicability Grade Index (BAGI) to evaluate practical considerations including cost, time, and skill requirements [1]
- Generate BAGI score to balance against environmental metrics
Comparative Analysis:
- Combine outputs from all tools to create a comprehensive sustainability profile
- Use results to identify specific areas for method improvement
- Benchmark against alternative methods or published standards
Emerging Tools and Future Directions
The field of analytical method assessment continues to evolve with emerging tools that address specific gaps in existing frameworks:
Violet Innovation Grade Index (VIGI): Evaluates methodological innovation across 10 criteria including sample preparation, instrumentation, data processing, regulatory compliance, and interdisciplinary [74]. It generates a 10-pointed star pictogram with varying violet intensities to facilitate rapid comparison.
Graphical Layout for Analytical Chemistry Evaluation (GLANCE): A canvas-based visualization template that condenses complex method descriptions into 12 standardized blocks including novelty, target analytes, sample preparation, validation parameters, and limitations [74]. This tool enhances reproducibility and communication efficiency.
Carbon Footprint Reduction Index (CaFRI): Specifically addresses climate impact by estimating and encouraging reduction of carbon emissions associated with analytical procedures [14]. This aligns chromatographic method development with broader environmental targets.
The future direction of method assessment points toward integrated digital platforms that combine multiple metrics, artificial intelligence-assisted scoring, and dynamic updating of method profiles based on real-time data [74]. The PRISM framework (practicality, reproducibility, inclusivity, sustainability, and manageability) shows promise for standardizing these diverse assessment approaches [74].
The Scientist's Toolkit: Essential Research Reagents and Materials
Table 3: Key Research Reagent Solutions for Sustainable Chromatography
| Item/Reagent | Function | Green Considerations |
|---|---|---|
| Bio-based solvents | Replacement for traditional organic solvents | Reduced toxicity, renewable sourcing |
| Micropillar array columns | Advanced separation media | Enhanced efficiency, reduced solvent consumption |
| Miniaturized extraction devices | Sample preparation | Reduced solvent volume, smaller waste streams |
| SILAC solvents | Sustainable chromatographic mobile phases | Lower environmental impact, safer handling |
| Renewable sorbents | Solid-phase extraction | Biodegradable materials, reduced hazardous waste |
| Energy-efficient detectors | Analyte detection | Lower power consumption, reduced operational impact |
| Automated workflow systems | Method implementation | Reduced reagent consumption, improved reproducibility |
Visualizing Assessment Workflows
Enhanced NEMI Evolution
Holistic Method Assessment Framework
Conclusion
NEMI assessment provides a foundational, practical approach for chromatography laboratories to evaluate and improve their environmental sustainability. While its simple pictogram format offers immediate visual feedback on method greenness, NEMI is most powerful when integrated with complementary tools like AGREE and Analytical Eco-Scale for comprehensive evaluation. Successful implementation requires balancing environmental goals with analytical performance, particularly through solvent selection, waste reduction, and miniaturization strategies. As green chemistry principles become increasingly embedded in regulatory frameworks, NEMI serves as a critical gateway assessment that supports the pharmaceutical and analytical industries' transition toward more sustainable practices. Future developments will likely focus on integrating NEMI with automated assessment platforms and expanding its criteria to address emerging sustainability concerns in analytical method development.
References
- 1. Green analytical chemistry metrics for evaluating the ... [https://pmc.ncbi.nlm.nih.gov/articles/PMC11697060/]
- 2. Environmental impact of the reported chromatographic ... - PMC [https://pmc.ncbi.nlm.nih.gov/articles/PMC8801062/]
- 3. The Greening of the Chromatography Laboratory [https://www.chromatographyonline.com/view/greening-chromatography-laboratory-0]
- 4. An overview of the current progress in green analytical ... [https://www.sciencedirect.com/science/article/abs/pii/S016599362300417X]
- 5. Application of NEMI, Analytical Eco-Scale and GAPI tools ... [https://www.sciencedirect.com/science/article/abs/pii/S0026265X19333454]
- 6. Application of Three Ecological Assessment Tools in ... [https://www.mdpi.com/1420-3049/26/18/5436]
- 7. The ecological impact of liquid chromatographic methods ... [https://pmc.ncbi.nlm.nih.gov/articles/PMC9643294/]
- 8. greenness assessment of HPLC methods for paclitaxel [https://link.springer.com/article/10.1007/s44371-025-00166-3]
- 9. A critical review of analytical methods for quantification ... [https://japsonline.com/abstract.php?article_id=4447&sts=2]
- 10. Green Approaches in High-Performance Liquid ... [https://pmc.ncbi.nlm.nih.gov/articles/PMC12430196/]
- 11. Exploring trends and guiding developments in miniaturized ... [https://www.sciencedirect.com/science/article/abs/pii/S0165993625002444]
- 12. Guidelines on the proper selection of greenness and ... [https://www.sciencedirect.com/science/article/abs/pii/S0003267025004465]
- 13. A Comprehensive Assessment of Sample Preparation ... [https://www.mdpi.com/2076-3417/14/17/7690]
- 14. Assessing the Environmental Impact of Analytical Methods [https://www.chromatographyonline.com/view/the-green-component-assessing-the-environmental-impact-of-analytical-methods]
- 15. A Perspective on Current and Future Metric Tools - PMC [https://pmc.ncbi.nlm.nih.gov/articles/PMC12590457/]
- 16. Green Analytical Chemistry—Recent Innovations [https://www.mdpi.com/2673-4532/6/1/10]
- 17. Greenness Assessment of Chromatographic Methods ... [https://www.mdpi.com/2297-8739/9/10/275]
- 18. The Greening of the Chromatography Laboratory [https://www.chromatographyonline.com/view/greening-chromatography-laboratory]
- 19. Improving greenness and sustainability of standard ... [https://www.sciencedirect.com/science/article/abs/pii/S000326702300689X]
- 20. Green analytical chemistry metrics for evaluating the ... [https://www.sciencedirect.com/science/article/pii/S2095177924001102]
- 21. Eco-friendly RP-HPLC method for simultaneous determination ... [https://bmcchem.biomedcentral.com/articles/10.1186/s13065-025-01441-1]
- 22. Assessing environmental sustainability of HPLC methods ... [https://www.sciencedirect.com/science/article/pii/S2772577424000910]
- 23. Assessing environmental sustainability of HPLC methods ... [https://ui.adsabs.harvard.edu/abs/2025GAnCh..1200182K/abstract]
- 24. PMC - PubMed Central [https://pmc.ncbi.nlm.nih.gov/articles/PMC12117729/]
- 25. Comparison of the Greenness Assessment ... [https://www.mdpi.com/2673-4532/4/4/32]
- 26. Evaluation of Alectinib Metabolic Stability in HLMs Using ... [https://www.mdpi.com/1999-4923/15/10/2449]
- 27. Comprehensive review of greenness, whiteness, and ... [https://www.sciencedirect.com/science/article/pii/S2772577425000060]
- 28. Combining Normal/Reversed-Phase HPTLC with Univariate ... [https://pmc.ncbi.nlm.nih.gov/articles/PMC7866824/]
- 29. Comparative study of Normal-phase versus ... - BMC Chemistry [https://bmcchem.biomedcentral.com/articles/10.1186/s13065-025-01439-9]
- 30. Reverse Phase vs Normal Phase HPLC: How to Choose ... [https://www.sepscience.com/reverse-phase-vs-normal-phase-hplc-how-to-choose-the-right-tool-11950]
- 31. Rules of Thumb for Reversed-Phase LC [https://www.chromatographyonline.com/view/rules-of-thumb-for-reversed-phase-lc-what-s-in-your-chromatographic-mind-]
- 32. Proposed RP–HPTLC–FLD kit for analysis of vitamin A ... [https://pmc.ncbi.nlm.nih.gov/articles/PMC12227463/]
- 33. Green Approaches in High-Performance Liquid ... [https://www.mdpi.com/1420-3049/30/17/3573]
- 34. RP-HPLC method for quantification of cefotaxime sodium by using design of experiment, a green analytical approach: Analytical method development, validation, and application [https://japsonline.com/abstract.php?article_id=4382&sts=2]
- 35. Recent approaches in green liquid chromatography for ... [https://www.sciencedirect.com/science/article/abs/pii/S2950357425000265]
- 36. Persistent, Bioaccumulative, and Toxic (PBT) Chemicals ... [https://www.epa.gov/assessing-and-managing-chemicals-under-tsca/persistent-bioaccumulative-and-toxic-pbt-chemicals]
- 37. PBT assessment list - ECHA [https://echa.europa.eu/pbt]
- 38. Clarity software comparison table [https://www.dataapex.com/product/clarity-software-comparison?language_content_entity=en]
- 39. Persistent Bioaccumulative Toxic (PBT) Chemicals Rules ... [https://www.epa.gov/toxics-release-inventory-tri-program/persistent-bioaccumulative-toxic-pbt-chemicals-rules-under-tri]
- 40. LC Column Comparison [https://www.restek.com/pages/lc-columns-physical-characteristics?srsltid=AfmBOorJ6LGKsGLnagMsujjj8DAtyS-mykBCmfHceyHXoXolXpP8Gy_B]
- 41. Recent Advances In Green Chromatography Techniques ... [https://www.sciencedirect.com/science/article/pii/S2772391725000830]
- 42. How Green is the Future of Chromatography? [https://www.chromatographyonline.com/view/how-green-is-the-future-of-chromatography-]
- 43. Green Chromatography: Reducing Environmental Impact ... [https://www.sepscience.com/green-chromatography-reducing-environmental-impact-in-lab-practices-11323]
- 44. Getting the Most Out of Your Chromatographic Solvent ... [https://rotachrom.com/getting-the-most-out-of-your-chromatographic-solvent-system/]
- 45. 8.4.5 Liquid Chromatography Waste [https://hsrm.umn.edu/department-environmental-health-safety/lab-research-safety/chemical-hygiene-plan/8-chemical-15]
- 46. HPLC 2025 Preview: The Road To Sustainable Analytical ... [https://www.chromatographyonline.com/view/hplc-2025-preview-the-road-to-sustainable-analytical-chemistry]
- 47. Green analytical approaches for contaminants: Sustainable ... [https://pubmed.ncbi.nlm.nih.gov/40184798/]
- 48. Review Article Advances in green liquid chromatography ... [https://www.sciencedirect.com/science/article/abs/pii/S0026265X24015121]
- 49. Green Strategies toward Eco-Friendly HPLC Methods in ... [https://www.intechopen.com/chapters/85926]
- 50. Greening Reversed-Phase Liquid Chromatography ... [https://pmc.ncbi.nlm.nih.gov/articles/PMC6100308/]
- 51. Eco-friendly alternatives to conventional solvents [https://www.sciencedirect.com/science/article/pii/S2772826925000859]
- 52. Chromatography Sample Preparation Guide [https://www.organomation.com/chromatography-sample-preparation-guide]
- 53. Dual-platform integration of HPTLC and firefly algorithm ... [https://bmcchem.biomedcentral.com/articles/10.1186/s13065-025-01598-9]
- 54. TLC method assisted by digital images for analysis ... [https://pubmed.ncbi.nlm.nih.gov/40972000/]
- 55. How to correctly evaluate greenness, whiteness and other ... [https://pubs.rsc.org/en/content/articlehtml/2025/gc/d5gc00615e]
- 56. Green Analytical Chemistry: A Comprehensive Review ... [https://www.jddtonline.info/index.php/jddt/article/download/7089/6718/21643?inline=1]
- 57. Tools to Evaluate the Eco-efficiency of Analytical Methods ... [https://pubmed.ncbi.nlm.nih.gov/37877508/]
- 58. Comparative study of four greenness assessment tools for ... [https://pubmed.ncbi.nlm.nih.gov/33404016/]
- 59. Green metrics and green analytical applications [https://www.sciencedirect.com/science/article/pii/S2772577424000685]
- 60. -sustainable Eco method for the determination of... chromatographic [https://bmcchem.biomedcentral.com/articles/10.1186/s13065-024-01364-3]
- 61. Validated HPLC Method for the Determination of Paclitaxel ... [https://pmc.ncbi.nlm.nih.gov/articles/PMC3928731/]
- 62. ICH Q2(R2) Validation of analytical procedures [https://www.ema.europa.eu/en/ich-q2r2-validation-analytical-procedures-scientific-guideline]
- 63. ICH and FDA Guidelines for Analytical Method Validation [https://www.labmanager.com/ich-and-fda-guidelines-for-analytical-method-validation-34252]
- 64. White Analytical Chemistry: Balancing Performance ... [https://www.chromatographyonline.com/view/white-analytical-chemistry-balancing-performance-sustainability-and-practicality-in-modern-methods]
- 65. White Analytical Chemistry: An approach to reconcile ... [https://www.sciencedirect.com/science/article/pii/S0165993621000455]
- 66. green metric, RGB model and forced degradation study [https://link.springer.com/article/10.1007/s44371-025-00218-8]
- 67. Greenness assessment of analytical methods for ... [https://pubmed.ncbi.nlm.nih.gov/39161240/]
- 68. ICH M10 on bioanalytical method validation - Scientific guideline [https://www.ema.europa.eu/en/ich-m10-bioanalytical-method-validation-scientific-guideline]
- 69. Qualification Vs Validation: Understand The Key Differences [https://gmpinsiders.com/qualification-vs-validation-key-differences/]
- 70. NEMI Frequently Asked Questions [https://www.nemi.gov/faqs/]
- 71. What is the difference between Qualification and Validation? [https://www.getreskilled.com/validation/qualification-validation/]
- 72. Qualification vs Validation Demystified: What You Must ... [https://pharmuni.com/2025/07/11/qualification-vs-validation-demystified-what-you-must-know/]
- 73. A quality by design approach with comprehensive green ... [https://japsonline.com/abstract.php?article_id=4529&sts=2]
- 74. Emerging Tools for Holistic Evaluation of Analytical Methods [https://www.chromatographyonline.com/view/emerging-tools-for-holistic-evaluation-of-analytical-methods]