Green HPTLC-Densitometry for Beta-Carotene Analysis: A Sustainable Approach for Plant Extract Standardization
This article provides a comprehensive overview of the application of green High-Performance Thin-Layer Chromatography (HPTLC)-densitometry for the analysis of β-carotene in plant extracts.
Green HPTLC-Densitometry for Beta-Carotene Analysis: A Sustainable Approach for Plant Extract Standardization
Abstract
This article provides a comprehensive overview of the application of green High-Performance Thin-Layer Chromatography (HPTLC)-densitometry for the analysis of β-carotene in plant extracts. Tailored for researchers, scientists, and drug development professionals, it covers foundational principles, sustainable method development, and practical applications. The content explores optimized extraction techniques, mobile phase selection aligned with Green Analytical Chemistry (GAC) principles, and systematic troubleshooting. It further details rigorous validation as per International Council for Harmonisation (ICH) guidelines and presents comparative analyses with other techniques like HPLC, highlighting the environmental and economic advantages of HPTLC. The integration of modern tools like smartphone-assisted quantification and greenness metric assessments (AGREE, GAPI) is also discussed, offering a holistic guide for implementing this eco-friendly methodology in quality control and phytopharmaceutical research.
Principles and Green Chemistry Foundations of HPTLC for Carotenoid Analysis
Evolution of Planar Chromatography: From TLC to Advanced HPTLC Platforms
Thin-Layer Chromatography (TLC) has long been a cornerstone of analytical chemistry, appreciated for its affordability, simplicity, and rapid qualitative screening capabilities [1]. However, traditional TLC suffered from several inherent limitations, including low resolution, poor reproducibility, and limited quantification accuracy, making it increasingly inadequate for modern regulatory or high-throughput workflows [2]. These shortcomings prompted the development of High-Performance Thin-Layer Chromatography (HPTLC), which represents a significant technological evolution in planar chromatography [2] [3].
The transformation from TLC to HPTLC has been driven by key technological improvements. HPTLC utilizes plates with a finer stationary phase particle size (5-10 µm for HPTLC versus 10-25 µm for TLC), enabling better resolution and higher detection sensitivity [3]. The process has become increasingly automated, with sophisticated instruments for sample application, chromatogram development, and detection, which reduces human error and enhances reproducibility [2] [4]. Modern HPTLC systems can analyze over 30 samples simultaneously in a shorter time (3-20 minutes) with minimal solvent consumption (often <10 mL), making it both efficient and environmentally friendly [2] [3].
Table 1: Key Technical Differences Between TLC and HPTLC
| Parameter | Traditional TLC | Modern HPTLC |
|---|---|---|
| Layer Thickness | 250 micrometer | 100 micrometer [3] |
| Particle Size | 10-25 µm | 5-10 µm [3] |
| Analysis Time | 20-200 minutes | 3-20 minutes [3] |
| Sample Throughput | <10 samples/plate | >30 samples/plate [3] |
| Sample Application | Manual spotting | Automated, precise application [3] |
| Detection Sensitivity | 50-100 pg | 5-10 pg [3] |
| Solvent Consumption | Higher | <10 mL per analysis [2] |
The paradigm has now shifted to view HPTLC not merely as a separation technique but as a versatile, multimodal analytical platform [2]. Contemporary "HPTLC+" systems integrate with sophisticated detection methods including mass spectrometry (MS), surface-enhanced Raman spectroscopy (SERS), near-infrared spectroscopy (NIR), and bioautography, transforming it into a comprehensive analytical tool [2]. This evolution has positioned HPTLC as a powerful technique for ensuring the quality, authenticity, and safety of global food and natural product systems [2].
HPTLC as a Green Analytical Tool for Carotenoid Analysis
High-Performance Thin-Layer Chromatography aligns strongly with the principles of Green Analytical Chemistry (GAC), offering significant environmental advantages over many traditional chromatographic methods [2]. The technique's inherent green characteristics include minimal solvent consumption, reduced energy requirements, and minimal sample preparation, making it particularly suitable for sustainable analytical programs [2].
In the specific context of carotenoid analysis, such as quantifying β-carotene in plant extracts, HPTLC methodologies have been developed that utilize safer solvent systems [5] [6]. For example, a validated method for determining β-carotene in carrots, sweet potatoes, and commercial formulations employs a ternary mixture of ethanol, cyclohexane, and ammonia (95:2.5:2.5, v/v/v) as the mobile phase, which is considerably greener than traditional toxic solvent systems [5]. When evaluated using the Analytical GREEnness (AGREE) metric, which assesses all twelve principles of GAC, this method achieved an excellent score of 0.81 on a 0-1 scale, confirming its environmental safety [5].
Table 2: Green HPTLC Methods for β-Carotene Quantification in Plant Extracts
| Plant Material | Mobile Phase Composition | Detection Wavelength | Linear Range | Greenness Score (AGREE) | Reference |
|---|---|---|---|---|---|
| Daucus carota (Carrot), Ipomea batatas (Sweet potato) | Ethanol:Cyclohexane:Ammonia (95:2.5:2.5, v/v/v) | 459 nm | 25–1000 ng/band | 0.81 | [5] |
| Prunus armeniaca (Apricot) | Toluene:Acetone (7:3, v/v) | 448 nm | 100–500 ng/band | Not specified | [7] |
| Gymnosporia senegalensis | n-Hexane:Ethyl Acetate (6:4, v/v) | 254 nm | 100–500 ng/band | Reported as "green and sustainable" | [6] |
The green credentials of HPTLC are further enhanced when compared to High-Performance Liquid Chromatography (HPLC). Studies have demonstrated that HPTLC requires fewer reagents, less time, and produces less waste liquid than HPLC, while delivering statistically comparable quantitative results [8]. When evaluated using green assessment tools like the Analytical Eco-Scale (AES), Green Analysis Program Index (GAPI), and Green Assessment Profile (GAP), HPTLC consistently qualifies as an outstanding green analytical method [8].
Application Note: Quantitative Analysis of β-Carotene in Plant Extracts
Background and Principle
Carotenoids such as β-carotene are important phytochemicals with antioxidant properties and provitamin A activity [5] [7]. Accurate quantification of β-carotene in plant extracts is essential for nutritional assessment, quality control, and research investigations [8]. This application note describes a validated green HPTLC-densitometry method for the quantification of β-carotene in various plant matrices, including carrot, sweet potato, and apricot extracts [5] [7].
The principle involves chromatographic separation of β-carotene from other plant constituents using a green mobile phase system, followed by densitometric measurement at the appropriate wavelength (typically 448-459 nm) where β-carotene exhibits maximum absorption [5] [7]. The method enables rapid, cost-efficient analysis of multiple samples simultaneously with minimal solvent consumption and sample preparation [8].
Experimental Protocol
Materials and Reagents
- Standard: β-Carotene (purity ≥98.7%) [5]
- Stationary Phase: HPTLC plates pre-coated with silica gel 60 F254 (normal phase) or RP-18 F254s (reversed-phase) [5] [7]
- Mobile Phase: Multiple green systems can be used:
- Sample Solvent: Hexane:acetone (50:50, v/v) for extraction [5]
- Plant Material: Fresh roots of Daucus carota L. (carrot), Ipomea batatas L. (sweet potato), or apricots (Prunus armeniaca) [5] [7]
Instrumentation
- Sample Applicator: Automated TLC sampler (e.g., CAMAG ATS4) [5]
- Development Chamber: Automated developing chamber (e.g., CAMAG ADC 2) [3]
- Scanner: Densitometer with UV/Vis detector (e.g., CAMAG TLC Scanner) [8]
- Software: VisionCats or similar for data processing [8]
Sample Preparation Procedure
- Extraction: Homogenize plant material and extract with hexane:acetone (50:50, v/v) using traditional or ultrasound-assisted extraction [5]
- Filtration: Filter the extract through anhydrous sodium sulfate [5]
- Concentration: Evaporate under nitrogen stream and reconstitute in an appropriate solvent [7]
- Ultrasound-Assisted Extraction Alternative: For improved efficiency, use ultrasound-based extraction which typically yields higher β-carotene content [5]
Chromatographic Procedure
- Plate Pre-washing: Pre-wash HPTLC plates with methanol and activate at 110°C for 20 minutes [3]
- Sample Application: Apply samples and standards as 6-8 mm bands using automated sample applicator [5]
- Chromatographic Development: Develop plate in automated developing chamber saturated with mobile phase vapor to a distance of 80 mm [5] [7]
- Drying: Air-dry developed plate in dark [7]
- Detection: Scan at 448-459 nm using densitometer [5] [7]
Method Validation Parameters
- Linearity: Evaluate over 25-1000 ng/band range with correlation coefficient (R²) ≥0.993 [5] [7]
- Detection Limits: Determine LOD (22-30 ng/band) and LOQ (66-100 ng/band) [7] [6]
- Precision: Assess intra-day and inter-day precision with RSD <3% [7]
- Accuracy: Perform recovery studies at 80%, 100%, 120% levels [5]
- Robustness: Evaluate small changes in mobile phase composition and development conditions [7]
The Scientist's Toolkit: Essential Research Reagents and Materials
Table 3: Essential Research Reagent Solutions for HPTLC Analysis of β-Carotene
| Item | Specification | Function/Purpose |
|---|---|---|
| HPTLC Plates | Silica gel 60 F254 or RP-18 F254s, 10x20 cm | Stationary phase for chromatographic separation [5] [7] |
| Mobile Phase | Ethanol:Cyclohexane:Ammonia (95:2.5:2.5, v/v/v) | Green solvent system for development [5] |
| β-Carotene Standard | ≥98.7% purity, Sigma-Aldrich or equivalent | Reference standard for calibration curve [5] [7] |
| Extraction Solvent | Hexane:Acetone (50:50, v/v) | Extraction of β-carotene from plant matrix [5] |
| Sample Applicator | CAMAG ATS4 or equivalent | Precise application of samples as bands [5] |
| Development Chamber | CAMAG ADC 2 or equivalent | Controlled environment for chromatographic development [3] |
| Densitometer | CAMAG TLC Scanner 4 with visionCATS software | Quantification of separated bands [8] |
Advanced HPTLC Platforms and Future Perspectives
The evolution of HPTLC continues with the development of multimodal "HPTLC+" platforms that integrate complementary analytical techniques to enhance capability and information output [2]. These advanced systems represent the future of planar chromatography and significantly expand application possibilities for complex analytical challenges.
Hyphenated HPTLC Techniques
Modern HPTLC platforms can be coupled with various spectroscopic and spectrometric techniques to provide comprehensive analytical information:
- HPTLC-MS (Mass Spectrometry): Combines separation capability of HPTLC with structural identification power of MS, enabling confident compound identification and trace quantification [2]
- HPTLC-SERS (Surface-Enhanced Raman Spectroscopy): Provides molecular fingerprinting capability with high specificity through enhanced Raman scattering signals on nanostructured metallic surfaces [2]
- HPTLC-NIR (Near-Infrared Spectroscopy): Enables non-destructive monitoring of samples, particularly useful for food freshness and quality assessment across supply chains [2]
- HPTLC-Bioautography: Allows function-directed screening of biological activity directly on the chromatogram, linking compound presence to biological effect [2]
Intelligent Analysis Systems
The integration of convolutional neural networks (CNNs) with HPTLC is developing intelligent analysis systems capable of automated spot recognition and data processing [2]. This advancement helps reduce human errors and enhances reproducibility and automation levels, although challenges remain including potential overfitting with limited data and model interpretability for regulatory acceptance [2].
Material-Enabled Enhancements
Innovative materials such as Metal-Organic Frameworks (MOFs) are being incorporated into HPTLC systems to enhance analytical performance [2]. MOF-modified plates facilitate selective analyte enrichment and improved detection of trace-level contaminants in complex food matrices, addressing significant analytical challenges in food safety and quality control [2].
The future of HPTLC lies in its continued evolution as a versatile, sustainable, and intelligent analytical platform that bridges analytical chemistry, machine learning, and green science [2]. These advanced systems hold promising potential for application in quality assurance of food and herbal products, enabling rapid, intelligent, and eco-efficient analysis suitable for both laboratory research and industrial quality control tasks [2]. As the technology continues to develop, HPTLC is poised to address increasingly complex analytical challenges while maintaining its fundamental advantages of simplicity, cost-effectiveness, and minimal environmental impact.
The Role of β-Carotene as a Key Biomarker in Plants and Nutraceuticals
β-Carotene (C₄₀H₅₆) is a prominent orange-red coloured carotenoid pigment, functioning as a primary provitamin A carotenoid in the human diet [9] [10]. Its role extends beyond pigmentation; it is a critical biomarker for assessing the nutritional quality of plant materials and nutraceutical formulations, indicative of antioxidant capacity and provitamin A activity [11] [7]. The analysis of β-carotene is essential for standardizing herbal drugs, validating health claims, and ensuring product efficacy [6]. This application note establishes a robust, greener HPTLC-densitometry protocol for its estimation, aligning with the principles of green analytical chemistry and providing a reliable tool for scientists and drug development professionals.
β-Carotene as a Biomarker: Significance and Biological Pathways
2.1. Dual Biological Functions β-Carotene serves two primary biological roles, which are illustrated in the metabolic pathway diagram below.
Diagram: Dual Metabolic Fates of β-Carotene. The pathway shows β-carotene's conversion to Vitamin A via BCO1 enzyme and its direct antioxidant activity.
2.2. Quantitative Biomarker in Research As a biomarker, β-carotene levels are used to assess the bioavailability of carotenoids from foods and supplements [12]. Serum concentrations of β-carotene are a direct indicator of recent intake and absorption efficiency, while tissue levels reflect long-term status [9] [12]. In nutraceutical studies, increases in serum β-carotene correlate with reduced oxidative stress markers, such as malondialdehyde (MDA), demonstrating its bioactivity [13].
Green HPTLC-Densitometry Protocol for β-Carotene Quantification
This protocol is optimized for the analysis of β-carotene in plant extracts (e.g., carrot, sweet potato, apricot) and commercial nutraceutical formulations.
3.1. Principle The method involves the separation of β-carotene from other plant constituents on a reversed-phase HPTLC plate using a greener ternary mobile phase, followed by densitometric quantification at 459 nm [5].
3.2. Reagents and Materials Table: Essential Research Reagent Solutions
| Item | Function/Description | Example/Specification |
|---|---|---|
| β-Carotene Standard | Reference compound for calibration curve | Purity ≥ 98.7% (e.g., Sigma-Aldrich) [5] |
| HPTLC Plates | Stationary phase for compound separation | RP-18 F₂₅₄S silica gel plates (e.g., E-Merck) [5] |
| Greener Mobile Phase | Solvent system for developing the TLC plate | Ethanol:Cyclohexane:Ammonia (95:2.5:2.5, v/v/v) [5] |
| Extraction Solvents | To isolate β-carotene from solid samples | Hexane, Acetone, or Hexane:Acetone (50:50 v/v) [5] |
| Sample Applicator | Precise application of samples to the HPLTC plate | CAMAG Automatic TLC Sampler 4 (ATS4) [5] |
| Densitometer | Quantification of separated β-carotene bands | CAMAG TLC Scanner with visionCATS software [8] |
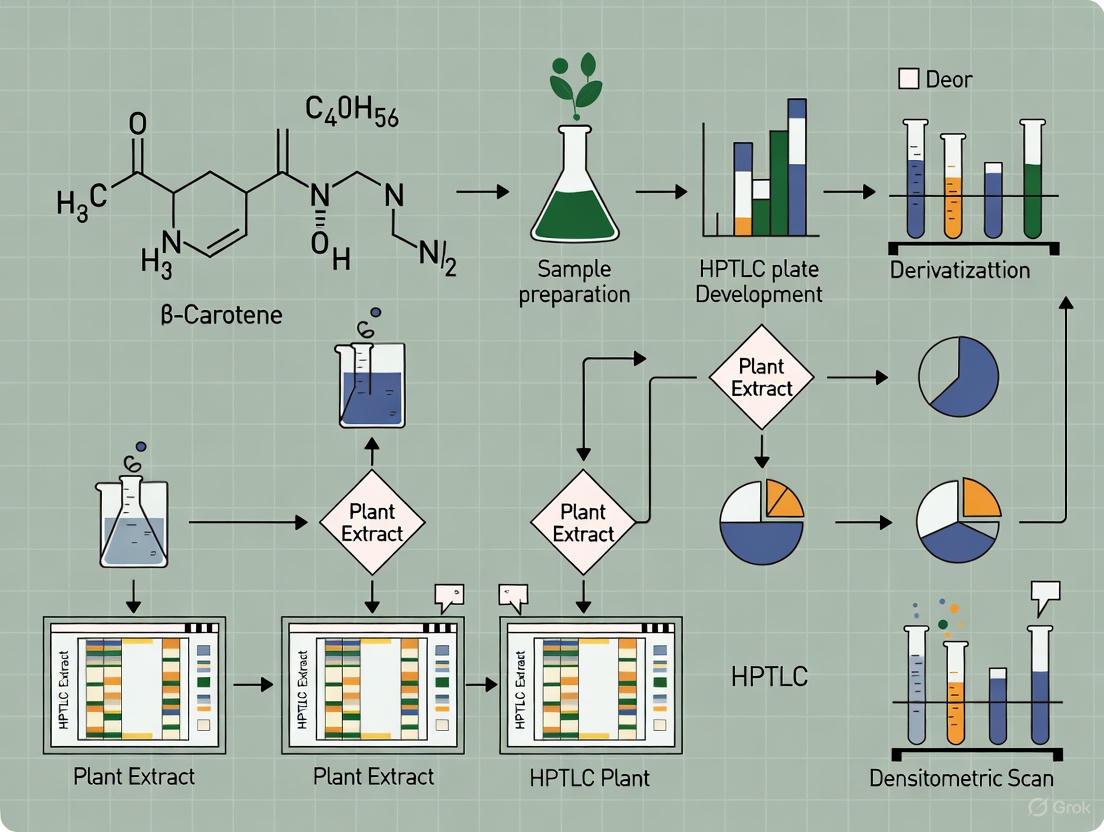
3.3. Experimental Workflow The following diagram outlines the complete analytical procedure.
Diagram: HPTLC Workflow for β-Carotene Analysis.
3.4. Detailed Step-by-Step Procedure
Step 1: Sample Preparation (Plant Material)
- Traditional Extraction (TE): Homogenize 1 g of fresh plant material (e.g., carrot root). Extract with 10 mL of a hexane:acetone (50:50, v/v) mixture via shaking or maceration for 15 minutes. Filter the organic layer and concentrate under a gentle nitrogen stream. Reconstitute the residue in 1 mL of cyclohexane for application [5].
- Ultrasound-Based Extraction (UBE): For higher yield, place the homogenized sample and solvent in an ultrasonic bath for 10 minutes. Filter and concentrate as in TE [5].
Step 2: Standard Solution Preparation
- Accurately weigh 5 mg of standard β-carotene and dissolve in 50 mL of cyclohexane to obtain a primary stock solution of 100 µg/mL.
- Prepare working standard solutions by serial dilution in the range of 25–1000 ng/band for constructing the calibration curve [5] [6].
Step 3: Plate Application and Spotting
- Use a CAMAG ATS4 sample applicator or a semi-automatic applicator.
- Pre-wash the RP-18 F₂₅₄S HPTLC plates with methanol and dry thoroughly.
- Apply the standard and sample solutions as 6 mm bands, 10 mm from the bottom edge, with an application rate of 150 nL/s [5].
Step 4: Plate Development
- Develop the applied plate in a twin-trough glass chamber pre-saturated with the mobile phase (Ethanol:Cyclohexane:Ammonia, 95:2.5:2.5, v/v/v) for 20 minutes at room temperature.
- The development distance is 80 mm from the point of application.
- Dry the developed plate in air, protected from light [5].
Step 5: Densitometric Analysis
- Scan the dried plate using a TLC scanner equipped with visionCATS software or a CAMAG Visualizer.
- Set the detection wavelength to 459 nm.
- The Rf value for β-carotene is typically ~0.27 [6]. Identify the band by comparing its Rf and spectrum with the standard.
Step 6: Data Analysis and Quantification
- Generate a calibration curve by plotting the peak area of the standard bands against the applied concentration (ng/band).
- Use linear regression to fit the curve. The method is linear in the 25–1000 ng/band range [5].
- Calculate the concentration of β-carotene in unknown samples by interpolating their peak areas from the calibration curve.
3.5. Method Validation and Quantitative Data The developed method should be validated as per ICH Q2(R1) guidelines. The table below summarizes typical validation parameters and comparative data from recent studies. Table: HPTLC Method Validation Parameters for β-Carotene Quantification
| Validation Parameter | Reported Results from Literature | Acceptance Criteria |
|---|---|---|
| Linearity Range | 25–1000 ng/band [5], 100–500 ng/band [6] [7] | Correlation coefficient (R²) > 0.990 |
| Limit of Detection (LOD) | 10.15 ng/band [6], 22.05 ng/band [7] | Signal-to-Noise ratio ~3:1 |
| Limit of Quantification (LOQ) | 30.76 ng/band [6], 66.82 ng/band [7] | Signal-to-Noise ratio ~10:1 |
| Precision (% RSD) | Intra-day: <2.03% [6], Inter-day: <2.14% [6] | RSD ≤ 2% |
| Recovery | 78.6% Entrapment Efficiency in nano-formulation [7] | Consistent and high yield |
| Application Example (Content) | Carrot (UBE): 11.03% w/w [5], Sweet Potato (UBE): 4.43% w/w [5], Apricot Nano-gel: Quantified [7] | Consistent with labeled claim |
3.6. Greenness of the Method The AGREE (Analytical GREEnness) metric score for the proposed mobile phase is 0.81, confirming its status as an excellent green analytical method compared to traditional methods that use large volumes of toxic solvents like hexane or petroleum ether [5].
This application note details a validated, greener HPTLC-densitometry protocol for the precise quantification of β-carotene, a critical biomarker in plant and nutraceutical research. The method emphasizes sustainability without compromising analytical performance, offering researchers a reliable tool for quality control, standardization, and bioavailability studies. Its cost-effectiveness and simplicity make it particularly suitable for routine analysis in resource-limited settings.
Core Principles of Green Analytical Chemistry (GAC) in Method Development
Green Analytical Chemistry (GAC) represents a transformative paradigm in chemical analysis, dedicated to minimising the environmental footprint and health risks associated with traditional laboratory practices [14]. This discipline integrates the principles of green chemistry directly into analytical methodologies, aiming to reduce the environmental and human health impacts traditionally associated with chemical analysis [15]. The core philosophy of GAC is to align analytical processes with the overarching goals of sustainability by minimizing the use of toxic reagents, reducing energy consumption, and preventing the generation of hazardous waste [15] [16]. The 12 Principles of Green Chemistry provide a comprehensive framework for designing and implementing these environmentally benign analytical techniques [15] [17].
The adoption of GAC is driven by both ethical responsibility and practical benefits. For the modern laboratory professional, embracing sustainable practices is a pathway to greater efficiency, improved safety, and significant cost-effectiveness [16]. This is particularly relevant in fields like phytopharmaceutical analysis, where traditional methods often rely on large volumes of toxic solvents, generate hazardous waste, and consume vast amounts of energy [16]. This article delineates the application of GAC principles to the development of analytical methods, with a specific focus on High-Performance Thin-Layer Chromatography-densitometry for the quantification of β-carotene in plant extracts, providing a structured framework for researchers and drug development professionals.
The Twelve Principles of Green Analytical Chemistry
The 12 principles of green chemistry provide a foundational framework for designing chemical processes and products that prioritize environmental and human health [15] [17]. When applied to analytical techniques, these principles drive the development of methodologies that are safer, more efficient, and environmentally benign. The table below summarizes these principles and their specific implications for analytical method development, particularly in the context of HPTLC for carotenoid analysis.
Table 1: The 12 Principles of Green Chemistry and Their Application to Analytical Method Development
| Principle Number | Principle Name | Core Concept | Application in Analytical Chemistry (e.g., HPTLC for β-carotene) |
|---|---|---|---|
| 1 | Prevention | It is better to prevent waste than to treat or clean up waste after it has been created. [17] | Design methods that use minimal sample/reagent volumes; prefer direct analysis to avoid derivatization waste. [15] |
| 2 | Atom Economy | Synthetic methods should maximize the incorporation of all materials into the final product. [17] | In analysis, this translates to maximizing information gained per unit of reagent consumed. [15] |
| 3 | Less Hazardous Chemical Syntheses | Wherever practicable, methods should use and generate substances with low toxicity. [17] | Replace toxic reagents/solvents in sample prep and mobile phases (e.g., use ethanol over benzene). [15] [5] |
| 4 | Designing Safer Chemicals | Chemical products should be designed to preserve efficacy while reducing toxicity. [17] | (Primarily for product design) In analysis, it implies choosing safer chemicals and materials. [17] |
| 5 | Safer Solvents and Auxiliaries | The use of auxiliary substances should be made unnecessary wherever possible and innocuous when used. [17] | Use of green solvents like water, ethanol, supercritical CO₂, or ionic liquids instead of VOCs. [15] [16] |
| 6 | Design for Energy Efficiency | Energy requirements should be recognized for their environmental and economic impacts and should be minimized. [17] | Use room-temperature procedures; employ energy-efficient techniques like ultrasound-assisted extraction. [15] [5] |
| 7 | Use of Renewable Feedstocks | A raw material or feedstock should be renewable rather than depleting whenever technically and economically practicable. [15] | Use bio-based solvents (e.g., ethanol) derived from renewable plant materials instead of petroleum-based solvents. [15] [16] |
| 8 | Reduce Derivatives | Unnecessary derivatization should be minimized or avoided because it requires additional reagents and can generate waste. [15] | Develop methods that analyze the native analyte (e.g., β-carotene) directly without chemical modification. [15] |
| 9 | Catalysis | Catalytic reagents (as selective as possible) are superior to stoichiometric reagents. [15] | Use catalytic systems in sample preparation over stoichiometric reagents to minimize waste. [15] |
| 10 | Design for Degradation | Chemical products should be designed so that at the end of their function they break down into innocuous degradation products. [15] | Choose chemicals and solvents that are readily biodegradable after disposal. [15] |
| 11 | Real-time Analysis for Pollution Prevention | Analytical methodologies need to be further developed to allow for real-time, in-process monitoring and control prior to the formation of hazardous substances. [15] | Develop in-process controls and on-site monitoring to prevent pollution. [15] [16] |
| 12 | Inherently Safer Chemistry for Accident Prevention | Substances and the form of a substance used in a chemical process should be chosen to minimize the potential for chemical accidents. [15] | Select solvents with higher flash points and lower toxicity to enhance laboratory safety. [15] |
The practical application of these principles transforms analytical workflows. For instance, the first principle, Prevention, is considered the most important, with the other principles serving as the "how to's" to achieve it [17]. A key metric derived from this principle is Process Mass Intensity (PMI), which expresses the ratio of the weights of all materials used to the weight of the desired product, driving dramatic reductions in waste [17]. Furthermore, the principle of Safer Solvents and Auxiliaries is particularly relevant to analytical chemistry, as it encourages the use of non-toxic, biodegradable alternatives, reducing reliance on hazardous organic solvents [15]. By embedding these principles into the development of analytical techniques, the discipline not only aligns with green chemistry’s ethos but also actively contributes to reducing the ecological footprint of scientific research [15].
Green Methodologies in HPTLC-Densitometry for β-Carotene Analysis
The determination of β-carotene in plant extracts serves as an excellent case study for implementing GAC principles in HPTLC-densitometry. Recent research demonstrates a conscious shift towards greener methodologies, focusing on solvent replacement, waste reduction, and energy efficiency.
Green Solvent Innovations in Mobile Phase Design
A critical advancement in green HPTLC is the systematic replacement of traditional, toxic solvents in the mobile phase with safer, bio-based alternatives. A notable study developed a reversed-phase HPTLC method for β-carotene in Daucus carota and Ipomea batatas using a ternary mixture of ethanol, cyclohexane, and ammonia (95:2.5:2.5, v/v/v) [5]. This mobile phase was a deliberate green alternative, resulting in an Analytical GREEnness (AGREE) score of 0.81, indicating "good greenness" [5]. The AGREE metric is significant because it applies all twelve principles of GAC for a comprehensive greenness evaluation [5].
Another study on Gymnosporia senegalensis estimated β-carotene using a mobile phase of n-hexane: ethyl acetate (6:4, v/v), which the authors described as a "safer and more environmentally friendly mobile phase" compared to the toxic alternatives found in the literature [6]. In contrast, a method developed for apricot nano-formulation used toluene: acetone (7:3 v/v) [7], while other literature methods for carotenoids have employed even more complex and hazardous multi-solvent systems, such as petroleum ether: hexane: acetone (2:3:1 v/v/v) or five-component mixtures [7]. The move towards simpler, greener solvent systems like ethanol-water or ethanol-cyclohexane directly addresses the GAC principles of Safer Solvents and Auxiliaries (Principle #5) and Waste Prevention (Principle #1).
Table 2: Comparison of Mobile Phases for β-Carotene Analysis via HPTLC
| Plant Material / Application | Mobile Phase Composition (v/v) | Greenness Features & Assessment | Citation |
|---|---|---|---|
| Daucus carota, Ipomea batatas, Commercial Formulation | Ethanol : Cyclohexane : Ammonia (95:2.5:2.5) | Utilizes ethanol as a major, less toxic component; AGREE score = 0.81. [5] | |
| Gymnosporia senegalensis | n-Hexane : Ethyl Acetate (6:4) | Described as a safer and more environmentally friendly mobile phase. [6] | |
| Nano-formulated Apricot Extract | Toluene : Acetone (7:3) | Toluene is more hazardous than ethanol or ethyl acetate. [7] | |
| Dietary Supplements (Chlorella, Spirulina) | Petroleum ether : Cyclohexane : Ethyl acetate : Acetone : Ethanol (60:16:10:10:6) | Complex, multi-solvent system; less green due to complexity and solvent hazards. [7] |
Energy-Efficient and Miniaturized Sample Preparation
Sample preparation is another area where GAC principles are being applied. The same study on carrots and sweet potatoes compared Traditional Extraction (TE) with Ultrasound-Based Extraction (UBE) [5]. Ultrasound-assisted extraction is an energy-efficient technique (Principle #6) that can enhance extraction yields and reduce processing time and energy consumption compared to conventional methods like Soxhlet extraction [15] [5]. The results confirmed that the UBE approach for extracting β-carotene outperformed the TE procedure, yielding higher amounts of β-carotene (11.03% w/w in UBE of D. carota vs. 10.32% in TE) [5]. This demonstrates how alternative energy sources can contribute to greener and more efficient analytical workflows.
Furthermore, HPTLC as a technique inherently supports miniaturization and source reduction (Principle #1). The ability to analyze multiple samples on a single HPTLC plate using very small volumes of samples and reagents (e.g., application of 100-500 ng/band) drastically reduces solvent consumption and waste generation compared to other chromatographic techniques like HPLC [8] [7]. One study highlights that HPTLC allows for the simultaneous running of up to 30 samples, significantly minimizing time and solvent usage [8].
Experimental Protocols for Green HPTLC-Densitometry of β-Carotene
Protocol 1: Greener HPTLC Method for β-Carotene in Vegetable Crops
This protocol is adapted from the method that achieved an AGREE score of 0.81, utilizing a green mobile phase and ultrasound-assisted extraction [5].
1.0 Principle To develop and validate a rapid, sensitive, and greener reversed-phase HPTLC method for the quantification of β-carotene in traditional and ultrasound-based extracts of plant materials like carrot and sweet potato.
2.0 Research Reagent Solutions & Materials Table 3: Essential Materials and Reagents for Green HPTLC of β-Carotene
| Item | Specification / Function | Green Alternative / Justification |
|---|---|---|
| HPTLC Plates | RP-18 F254S plates (e.g., 10 x 20 cm), pre-coated. | Stationary phase for reversed-phase separation. |
| β-Carotene Standard | High-purity (>98%) for calibration. | Reference standard for quantification. |
| Extraction Solvents | Hexane, Acetone, or Hexane:Acetone (50:50). | For extracting β-carotene from plant matrices. |
| Green Mobile Phase | Ethanol : Cyclohexane : Ammonia (95:2.5:2.5, v/v/v). [5] | Ethanol is a safer, bio-based solvent replacing more toxic options like chloroform or benzene. |
| Sample Applicator | Automatic TLC Sampler (e.g., CAMAG ATS4). | Ensures precise, miniaturized band application (e.g., 6 mm bands). |
| HPTLC Instrumentation | Densitometer with scanning capability, set to 459 nm. [5] | For quantification of the separated β-carotene bands. |
| Ultrasonication Bath | For Ultrasound-Based Extraction (UBE). | Reduces extraction time and energy consumption (Principle #6). |
3.0 Equipment and Instrumentation
- HPTLC system (e.g., CAMAG) including an Automatic TLC Sampler, development chamber, and TLC Scanner.
- Ultrasonication bath.
- Analytical balance.
- Micropipettes.
4.0 Procedure
4.1 Sample Preparation (Ultrasound-Based Extraction - UBE)
- Homogenization: Wash and dry fresh plant material (e.g., carrot roots). Grind into a fine powder.
- Extraction: Accurately weigh ~1 g of powdered plant material. Add 10 mL of a hexane:acetone (50:50) solvent mixture.
- Sonication: Place the mixture in an ultrasonication bath and extract for 15-20 minutes at ambient temperature.
- Filtration: Filter the extract through a 0.45 μm membrane filter. Evaporate the filtrate under a gentle stream of nitrogen.
- Reconstitution: Reconstitute the residue in 1 mL of ethanol for HPTLC analysis.
4.2 HPTLC Analysis
- Plate Pre-washing: Pre-wash the RP-18 HPTLC plates with ethanol and dry thoroughly.
- Application: Using the automatic sampler, apply the standard and sample solutions as 6 mm bands on the plate. The application rate should be kept constant (e.g., 150 nL/s). A linearity range of 25–1000 ng/band is recommended.
- Chromatogram Development: Develop the plate in a twin-trough chamber pre-saturated for 20 minutes with the mobile phase (Ethanol:Cyclohexane:Ammonia, 95:2.5:2.5 v/v/v). Develop until the solvent front travels 80 mm from the point of application.
- Drying: Air-dry the developed plate in a fume hood.
- Detection & Quantification: Scan the plate at 459 nm using a densitometer. Identify β-carotene by comparing the Rf value and spectrum with those of the authentic standard.
5.0 Method Validation Validate the method according to ICH Q2(R1) guidelines for:
- Linearity: Over the range of 25-1000 ng/band.
- Accuracy: Via standard addition/recovery studies (should be 98-102%).
- Precision: Both intra-day and inter-day (RSD < 2%).
- Specificity: No interfering peaks from the sample matrix at the Rf of β-carotene.
- Robustness: Assess by deliberate, small variations in mobile phase composition.
- LOD and LOQ: Typically in the low ng/band range.
Protocol 2: Semi-Quantitative Assessment Using Image-Based Analysis
This protocol leverages digital imaging for a cost-effective and rapid screening method, reducing reliance on specialized densitometers, which is advantageous in resource-limited settings [8].
1.0 Principle To use an HPTLC visualizer system for the semi-quantitative assessment of β-carotene (and lycopene) in plant extracts like tomato and carrot, generating a Peak Profile from the Image (PPI).
2.0 Materials
- The materials are similar to Protocol 1, excluding the densitometer.
- A CAMAG Visualizer or similar imaging system equipped with VisionCats software or equivalent.
3.0 Procedure
- Sample Prep & Application: Follow steps 4.1 and 4.2 from Protocol 1.
- Development & Drying: Develop and dry the plate as described.
- Image Capture: Place the dried plate in the visualizer and capture a high-dynamic-range image (HDRI) under visible light.
- Data Analysis (Semi-Quantification):
- Use the software to define tracks and lanes for the applied bands.
- The software calculates luminance from the detected RGB values for each pixel line, plotting it as a function of the Rf to generate a PPI.
- The area under the curve (AUC) of the PPI for the sample bands is compared to the AUC of standard bands of known concentration to estimate the content in the samples.
Visualization of GAC Workflow in HPTLC Method Development
The following diagram illustrates the logical workflow for developing a green HPTLC method, integrating the core GAC principles at each stage to achieve a sustainable and effective analytical procedure.
GAC-Driven HPTLC Development Workflow
Advanced Framework: White Analytical Chemistry (WAC)
An emerging evolution of GAC is White Analytical Chemistry (WAC), which strengthens traditional GAC by adding criteria that assess the analytical performance and practical usability of methods [18]. WAC follows a holistic framework modeled after the Red-Green-Blue (RGB) color model:
- Red Component: Represents analytical performance (accuracy, sensitivity, selectivity).
- Green Component: Incorporates traditional GAC metrics (environmental impact).
- Blue Component: Considers economic and practical aspects (cost, time, usability) [18].
A method is considered "white" only if it simultaneously scores high in all three dimensions. This framework addresses the criticism that a method can be green but analytically or practically inadequate. For instance, the development of a green RP-HPLC method for pharmaceuticals using a WAC-assisted Analytical Quality by Design (AQbD) strategy led to a validated, sustainable, and cost-effective procedure with an excellent white WAC score [18]. Applying this RGB model to HPTLC method development for β-carotene ensures a balanced outcome that is not only environmentally sound but also robust, sensitive, and practical for routine use in quality control labs.
The integration of Green Analytical Chemistry principles into HPTLC-densitometry method development is both a scientific and an ethical imperative. As demonstrated in the quantification of β-carotene in plant extracts, this involves a conscious shift towards safer solvents like ethanol, energy-efficient techniques like ultrasound-assisted extraction, and miniaturized analytical procedures inherent to HPTLC. The use of comprehensive greenness assessment tools like the AGREE metric provides a quantitative measure of a method's environmental performance. Furthermore, the emerging framework of White Analytical Chemistry ensures that the greenness of a method is balanced with its analytical validity and practical utility. By adopting these structured protocols and principles, researchers and drug development professionals can significantly advance the sustainability of their analytical practices, contributing to the broader goals of environmental stewardship and workplace safety without compromising the quality of scientific data.
The application of Green High-Performance Thin-Layer Chromatography (HPTLC) has emerged as a transformative methodology in the analysis of plant extracts, particularly for bioactive compounds such as β-carotene. This technique aligns with the twelve principles of Green Analytical Chemistry (GAC) by significantly reducing hazardous chemical consumption, minimizing waste generation, and improving operational efficiency [19]. Within the specific context of quantifying β-carotene in complex plant matrices—including Daucus carota (carrot), Ipomea batatas (sweet potato), and Prunus armeniaca (apricot)—green HPTLC-densitometry offers a compelling alternative to traditional chromatographic methods like HPLC [5] [8] [7]. The core advantages of this approach, namely low solvent consumption, cost-effectiveness, and high-throughput capability, make it exceptionally suitable for routine quality control, phytopharmaceutical development, and nutritional assessment. By integrating environmentally sustainable practices without compromising analytical performance, green HPTLC establishes a new paradigm for responsible and efficient analytical science in plant research [19].
Key Advantages of Green HPTLC
Low Solvent Consumption and Environmental Impact
A primary ecological benefit of green HPTLC is its minimal requirement for organic solvents. Unlike conventional HPLC, which can generate 1–1.5 liters of solvent waste daily, HPTLC utilizes a fraction of this volume due to its minimal solvent usage per sample [19]. This substantial reduction is achieved because the chromatographic development occurs in a closed chamber, and solvent usage remains constant regardless of the number of samples applied to the plate (up to its capacity) [20].
For β-carotene analysis, researchers have developed several eco-friendly mobile phase systems that replace hazardous solvents with safer alternatives. A notable example is the ternary mixture of ethanol, cyclohexane, and ammonia (95:2.5:2.5, v/v/v), which demonstrated excellent separation for β-carotene in traditional and ultrasound-based extracts of D. carota and I. batatas [5]. The greenness of this methodology was quantitatively evaluated using the Analytical GREEnness (AGREE) metric, achieving an impressive score of 0.81 on a 0-1 scale, confirming its excellent environmental profile [5].
Table 1: Green Mobile Phase Systems for β-Carotene Quantification via HPTLC
| Plant Material | Mobile Phase Composition | Volume Ratio | Greenness Features | AGREE Score | Citation |
|---|---|---|---|---|---|
| D. carota, I. batatas | Ethanol: Cyclohexane: Ammonia | 95:2.5:2.5 v/v/v | Replaced toxic solvents like acetonitrile | 0.81 | [5] |
| P. armeniaca (Apricot) | Toluene: Acetone | 7:3 v/v | Simplified binary system | - | [7] |
| G. senegalensis | n-Hexane: Ethyl Acetate | 6:4 v/v | Safer and more environmentally friendly | - | [6] |
Cost-Effectiveness and Economic Benefits
The economic advantages of green HPTLC make it particularly accessible for laboratories with limited budgets or those conducting high-volume screening. The technique eliminates several major cost centers associated with HPLC, including expensive analytical columns, high-purity solvent consumption, and specialized instrumentation [8] [21]. Furthermore, HPTLC plates are single-use, which eliminates cross-contamination and the costs associated with column cleaning and regeneration [20].
A comparative analysis highlighted that HPTLC provides a "cost-efficient carotenoid analysis" that "needs minimal reagents and no pre-treatment" compared to HPLC [8]. This cost efficiency extends to sample preparation, which is often minimal, and to energy consumption during operation [21]. The ability to analyze multiple samples simultaneously on a single plate significantly reduces the cost per analysis, making green HPTLC particularly suitable for resource-limited settings without compromising data quality or regulatory compliance [5] [6].
High-Throughput Capabilities
The parallel processing capability of HPTLC represents one of its most significant practical advantages over sequential chromatographic techniques. A single HPTLC plate can accommodate the simultaneous analysis of up to 15-30 samples under identical conditions, dramatically increasing analytical throughput and reducing overall analysis time [8] [20]. This high-throughput capability is especially valuable in plant extract analysis, where researchers often need to screen numerous samples, fractions, or cultivars for β-carotene content.
This parallel analysis system eliminates the cross-contamination risk between samples, a common concern in column-based techniques where all samples pass through the same hardware components [20]. For β-carotene quantification in plant extracts, this means that researchers can directly compare traditional extracts with ultrasound-based extracts, different solvent fractions, and commercial formulations side-by-side on the same plate, ensuring optimal comparability of results [5]. The method's short run times and minimal sample preparation further enhance its throughput advantages, enabling rapid screening and quality control of plant-based materials [7] [20].
Application Notes: Green HPTLC for β-Carotene in Plant Extracts
Experimental Protocols for β-Carotene Analysis
Sample Preparation Protocol
- Plant Material Processing: Fresh roots of D. carota or I. batatas should be washed, dried, and homogenized. For apricots (P. armeniaca), use fresh or dried fruit pulp [5] [7].
- Extraction Procedures:
- Extract Concentration: Filter the extracts and evaporate under reduced temperature and pressure. Reconstitute the residue in an appropriate solvent for HPTLC analysis [5] [7].
- Standard Solution Preparation: Prepare β-carotene stock solution in a suitable solvent (e.g., methanol) at 1 mg/mL concentration. Serially dilute to obtain working standards in the range of 25-1000 ng/band [5].
HPTLC Instrumentation and Conditions
Table 2: Instrumentation Parameters for Green HPTLC of β-Carotene
| Parameter | Specification | Application Notes |
|---|---|---|
| HPTLC Plates | RP silica gel 60 F254 plates (10 × 20 cm) [5] or silica gel aluminum TLC plates [7] | Pre-wash plates with methanol if necessary |
| Sample Applicator | CAMAG Automatic TLC Sampler 4 (ATS4) or Linomat 5 | Application rate: 150 nL/s [5] |
| Application Volume | 10 μL as 6-8 mm bands | Distance between tracks: 10 mm [5] |
| Mobile Phase | Ethanol:cyclohexane:ammonia (95:2.5:2.5, v/v/v) [5] or toluene:acetone (7:3, v/v) [7] | Chamber saturation: 15-30 minutes at room temperature |
| Development | Linear ascending mode in twin-trough chamber | Development distance: 80 mm [5] |
| Detection | Densitometric scanning at 448-459 nm [5] [7] | Use deuterium or tungsten lamp |
The following workflow diagram illustrates the complete green HPTLC process for β-carotene analysis:
Method Validation Parameters
For reliable quantification of β-carotene, the following validation parameters should be established according to ICH Q2(R1) guidelines [5] [7]:
- Linearity: 25-1000 ng/band for β-carotene with R² ≥ 0.9935 [5] [7]
- Limit of Detection (LOD): 10.15-22.05 ng/band [7] [6]
- Limit of Quantification (LOQ): 30.76-66.82 ng/band [7] [6]
- Precision: Relative Standard Deviation (RSD) ≤ 2% for intra-day and inter-day measurements [5]
- Accuracy: Recovery rates of 98.3-101.2% for spiked samples [5]
- Robustness: Consistent Rf values under deliberate variations in development conditions [5]
The Scientist's Toolkit: Essential Research Reagents and Materials
Table 3: Essential Research Reagents and Materials for Green HPTLC of β-Carotene
| Item | Specification | Function/Application Notes |
|---|---|---|
| HPTLC Plates | RP silica gel 60 F254 or silica gel aluminum plates (10 × 20 cm, 0.25 mm thickness) [5] [7] | Stationary phase for separation |
| Green Solvents | Ethanol, ethyl acetate, cyclohexane, acetone [5] [7] | Mobile phase components; replace hazardous solvents |
| Standard | β-carotene (purity ≥ 98.7%) [5] | Reference standard for quantification |
| Application Syringe | 100 μL Hamilton syringe [5] | Precise sample application |
| Development Chamber | CAMAG automated development chamber or twin-trough glass chamber [5] | Controlled mobile phase development |
| Densitometer | CAMAG TLC Scanner 3 with WinCATS software [5] [7] | Quantification of separated bands |
| Detection System | Deuterium and tungsten lamps [5] | Detection at 448-459 nm for β-carotene |
Comparative Analysis with Conventional Methods
When compared to established HPLC methods for β-carotene quantification, green HPTLC demonstrates significant advantages across multiple parameters that are particularly relevant for plant extract analysis:
Table 4: Green HPTLC vs. HPLC for β-Carotene Analysis in Plant Extracts
| Parameter | Green HPTLC | Conventional HPLC |
|---|---|---|
| Solvent Consumption | ~15 mL per run (multiple samples) [5] [8] | ~100-1000 mL per run (sequential analysis) [8] |
| Sample Throughput | 15-30 samples simultaneously [8] [20] | 1 sample at a time (sequential) |
| Analysis Time | ~20 min for 15+ samples [20] | ~15-30 min per sample |
| Cost per Analysis | Low (no expensive columns, less solvent) [8] [21] | High (column costs, high solvent consumption) |
| Cross-Contamination Risk | None (single-use plates) [20] | Possible (shared column) |
| Sample Preparation | Minimal, often direct application [8] | Extensive, often requiring purification |
| Flexibility in Detection | Multiple detection methods on same plate [20] | Limited to connected detectors |
The parallel analysis capability of HPTLC is particularly advantageous when comparing different extraction techniques (e.g., traditional vs. ultrasound-assisted) or when analyzing multiple plant fractions for β-carotene content [5]. Research has demonstrated that ultrasound-based extraction (UBE) typically yields higher β-carotene content compared to traditional extraction methods, with reported increases from 10.32% to 11.03% w/w in D. carota and from 3.73% to 4.43% w/w in I. batatas [5].
The following diagram illustrates the operational workflow differences between HPTLC and HPLC, highlighting the parallel versus sequential processing:
Green HPTLC-densitometry represents a significant advancement in the quantification of β-carotene in plant extracts, successfully balancing analytical performance with environmental responsibility. The technique's core advantages of minimal solvent consumption, exceptional cost-effectiveness, and high-throughput capabilities address critical needs in modern phytochemical analysis and drug development research. By implementing the protocols and application notes outlined in this document, researchers can achieve reliable, reproducible quantification of β-carotene while adhering to the principles of green analytical chemistry. The continued development and validation of green HPTLC methodologies will further establish this technique as an indispensable tool for sustainable scientific progress in the analysis of plant-based bioactive compounds.
Systematic Greenness Assessment Using AGREE and Other Metric Tools
The transition towards sustainable laboratory practices has made the environmental assessment of analytical methods a critical step in method development and selection. Green Analytical Chemistry (GAC) provides a framework for evaluating and minimizing the environmental impact of analytical procedures, guided by the 12 principles of GAC [22]. The concept of greenness specifically refers to impacts within environmental, health, and safety criteria, focusing on factors such as solvent selection, reagent minimization, waste reduction, and energy efficiency [22]. In recent years, multiple metric tools have been developed to quantify and compare the greenness of analytical methods, enabling researchers to make informed decisions that align with sustainability goals while maintaining analytical integrity.
The need for standardized assessment has become increasingly important as these tools gain popularity. Recent studies highlight that "greenness and related tools are used recklessly in analytical chemistry," leading to unintentional abuses and difficulties in comparing results across studies [22]. This application note addresses this challenge by providing a structured framework for systematic greenness assessment, with particular emphasis on the AGREE (Analytical GREEnness) metric and its complementary tools, contextualized within research on HPTLC-densitometry for β-carotene analysis in plant extracts.
Evolution and Classification of Metric Tools
The development of greenness assessment tools has evolved from simple binary evaluations to comprehensive multi-criteria systems. Early tools like the National Environmental Methods Index (NEMI) provided basic pictograms indicating whether methods met specific environmental criteria [22] [23]. The Analytical Eco-Scale introduced a semi-quantitative approach based on penalty points subtracted from a base score of 100 [22] [23]. Subsequent tools like the Green Analytical Procedure Index (GAPI) offered more detailed pictograms with a three-color traffic light system across multiple parameters [22].
A significant advancement came with the AGREE metric, which comprehensively addresses all 12 principles of GAC through a unified scoring system [23]. The tool calculates an overall score between 0-1, with higher scores indicating superior greenness, and presents results in an intuitive clock-shaped pictogram that visualizes performance across each principle [23]. The recently introduced White Analytical Chemistry (WAC) concept expands this perspective by integrating three assessment dimensions: red for analytical performance, green for environmental impact, and blue for practical and economic aspects [24] [25]. This holistic framework has spurred the development of complementary tools including the Red Analytical Performance Index (RAPI) for analytical criteria and the Blue Applicability Grade Index (BAGI) for practical considerations [24].
Comparison of Major Assessment Tools
Table 1: Key Metric Tools for Greenness and Holistic Method Assessment
| Tool Name | Assessment Focus | Scoring System | Visual Output | Key Principles |
|---|---|---|---|---|
| AGREE | Environmental impact | 0-1 scale | Clock-like pictogram | 12 principles of GAC |
| AGREEprep | Sample preparation | 0-1 scale | Clock-like pictogram | 10 principles of GSP |
| NEMI | Environmental impact | Binary (green/blank) | Quadrant pictogram | 4 criteria (PBT, hazardous, corrosive, waste) |
| Analytical Eco-Scale | Environmental impact | Penalty points (0-100) | Numerical score | Reagent toxicity, waste, energy |
| GAPI | Comprehensive method | 3-level traffic light | Pentagram pictogram | Multiple criteria across procedure steps |
| BAGI | Practicality & economics | 25-100 points | Blue-toned star | 10 practical criteria |
| RAPI | Analytical performance | 0-100 points | Red-toned star | 10 validation parameters |
The AGREE Metric Tool: Protocol and Application
Theoretical Foundation and Calculation Method
The AGREE metric stands out for its comprehensive approach based on all 12 principles of Green Analytical Chemistry [23]. Each principle is transformed into a score on a unified 0-1 scale, with the final assessment result calculated as the product of the individual scores for each principle. The tool incorporates weighting factors that can be adjusted by the user based on the relative importance of each criterion in specific analytical scenarios, enhancing flexibility and context-appropriateness [23].
The input criteria cover the complete analytical procedure: directness of analysis, sample size and number, reagent toxicity and quantity, waste generation, energy consumption, operator safety, number of pretreatment steps, miniaturization/automation, and analysis throughput [23]. Performance for each principle is color-coded (red-yellow-green) in the output pictogram, while user-assigned weights determine the width of each corresponding segment, providing immediate visual interpretation of both performance and priority alignment [23].
Step-by-Step Protocol for AGREE Assessment
Software Installation: Download the open-source AGREE software from https://mostwiedzy.pl/AGREE [23].
Data Collection: Compile all relevant method parameters including:
- Sample preparation steps and techniques
- Reagents and solvents used (types, quantities, hazards)
- Energy consumption of instruments
- Waste generated (volume, toxicity)
- Throughput and analysis time
- Operator safety considerations
Input Entry: Enter collected data into the corresponding 12 principle fields in the software interface.
Weight Assignment: Adjust importance weights for each principle based on application context (default: equal weighting).
Calculation Execution: Run the assessment to generate the overall score and pictogram.
Result Interpretation: Analyze the output considering:
- Overall score (0 = not green, 1 = ideal greenness)
- Color distribution across principles
- Segment widths reflecting user priorities
Comparative Analysis: Repeat for alternative methods to enable comparative greenness assessment.
AGREE Assessment of HPTLC for β-Carotene Analysis
In a practical application for β-carotene analysis, a greener HPTLC method utilizing ethanol, cyclohexane, and ammonia (95:2.5:2.5, v v v⁻¹) as mobile phase achieved an AGREE score of 0.81, indicating excellent greenness characteristics [5]. This high score reflects advantages of the HPTLC technique including minimal solvent consumption, reduced sample preparation, and low energy requirements compared to conventional HPLC methods [5] [8].
The visual output for this assessment would show strong performance across principles related to waste minimization, energy efficiency, and reagent toxicity, potentially with lower scores for principles where trade-offs exist between greenness and analytical performance. This case demonstrates how AGREE provides a balanced, multi-factorial assessment that recognizes methodologies making substantive improvements in environmental impact, even if not perfect across all criteria.
Complementary Assessment Tools
Blue Applicability Grade Index (BAGI)
The Blue Applicability Grade Index (BAGI) assesses the practicality of analytical methods, focusing on the "blue" dimension of White Analytical Chemistry [24]. The tool evaluates ten key practical attributes including analysis type, sample throughput, reagent use, instrumentation availability, and automation potential [22]. Using open-source software (mostwiedzy.pl/bagi), BAGI generates a score from 25-100 points, visualized through a blue-toned pictogram where darker shades indicate better practicality [22] [24].
For HPTLC methods analyzing β-carotene in plant extracts, BAGI would typically yield high scores for attributes such as cost-effectiveness, instrument availability, and operational simplicity, though potentially lower scores for throughput compared to fully automated systems. This assessment complements greenness evaluation by ensuring that environmentally friendly methods remain practically viable for routine application.
Red Analytical Performance Index (RAPI)
The Red Analytical Performance Index (RAPI) completes the WAC triad by evaluating analytical performance criteria [24]. This recently introduced tool assesses ten fundamental validation parameters including precision, accuracy, sensitivity, linearity, and robustness [24]. The open-source software (mostwiedzy.pl/rapi) generates a red-toned star pictogram with scores from 0-100, providing immediate visual feedback on methodological robustness [24].
For β-carotene HPTLC analysis, RAPI assessment would highlight the technique's strengths in specificity and detection capability while potentially identifying limitations in quantitative precision compared to HPLC approaches. The tool is particularly valuable for contextualizing greenness achievements within the framework of analytical method validity, ensuring that environmental improvements do not compromise essential performance characteristics.
Integrated Workflow for Comprehensive Method Assessment
Holistic Method Assessment Workflow
Sequential Application of Assessment Tools
A systematic approach to method evaluation applies the metric tools in sequence, beginning with AGREE for environmental impact, followed by BAGI for practical considerations, and concluding with RAPI for analytical performance [24] [25]. This workflow ensures balanced consideration of all sustainability dimensions, preventing overemphasis on any single aspect at the expense of others.
For β-carotene analysis, this might reveal that while a particular HPTLC method demonstrates moderate greenness (AGREE score: 0.70), it excels in practicality (BAGI score: 85/100) and performance (RAPI score: 82/100), making it highly suitable for quality control applications where throughput and cost are significant factors.
Interpretation and Decision-Making
The integration of results from multiple metrics enables informed decision-making based on application requirements. Methods with strong performance across all three dimensions represent ideal candidates for implementation, while those with significant disparities require careful consideration of trade-offs aligned with application priorities.
Recent research emphasizes that "although useful for identifying methods that seem more environmentally friendly and safe, these tools do not allow for a holistic comparison of methods because they omit the criteria that determine their effectiveness and usefulness" [24], highlighting the necessity of the integrated RGB approach for comprehensive assessment.
Experimental Protocols for Green HPTLC-Densitometry of β-Carotene
Materials and Reagents
Table 2: Research Reagent Solutions for Green HPTLC of β-Carotene
| Reagent/Material | Function/Role | Green Characteristics | Alternative Considerations |
|---|---|---|---|
| Ethanol | Greener solvent for extraction and mobile phase | Renewable origin, low toxicity | Can be derived from agricultural waste |
| Cyclohexane | Mobile phase component | Lower toxicity than hexane or chloroform | Potential for further replacement |
| Ammonia solution | Mobile phase modifier | Volatile, minimal residue | Concentration optimization to minimize use |
| Dichloromethane | Extraction solvent (conventional) | Hazardous, to be replaced | Substitute with ethanol-based systems |
| HPTLC RP-18 F254S plates | Stationary phase | Reusable with appropriate cleaning | Standard silica plates for normal phase |
| β-Carotene standard | Reference standard | Natural origin | Source from sustainable suppliers |
Green HPTLC Method Protocol
Sample Preparation (Ultrasound-Assisted Extraction):
- Weigh 1.0 g of dried plant material (carrot or sweet potato)
- Add 10 mL of ethanol/cyclohexane (9:1) mixture
- Sonicate for 15 minutes at 40°C
- Filter through 0.45 μm PTFE membrane
- Concentrate under nitrogen stream to 1 mL
HPTLC Analysis:
- Application: 6 mm bands using automatic applicator
- Application rate: 150 nL/s
- Mobile phase: Ethanol-cyclohexane-ammonia (95:2.5:2.5, v/v/v)
- Development: Linear ascending mode in twin-trough chamber
- Migration distance: 80 mm
- Detection: Densitometry at 459 nm
Validation Parameters:
- Linearity: 25-1000 ng/band
- Precision: Intra-day and inter-day RSD < 5%
- Accuracy: Recovery 95-105%
- LOD: 8 ng/band
- LOQ: 25 ng/band
This protocol exemplifies green principles through minimal solvent consumption, reduced waste generation, and use of less hazardous chemicals compared to conventional methods utilizing hexane, acetone, or dichloromethane [5] [8].
Systematic greenness assessment using AGREE and complementary metric tools provides an essential framework for developing sustainable analytical methods in carotenoid analysis. The integrated approach evaluating environmental impact (green), practical applicability (blue), and analytical performance (red) ensures balanced method selection that aligns with both sustainability goals and analytical requirements. The HPTLC-densitometry method for β-carotene quantification demonstrates how thoughtful method design coupled with comprehensive assessment can achieve AGREE scores exceeding 0.80 while maintaining robust analytical performance and practical utility. As green metrics continue to evolve toward standardized frameworks, their systematic application will play an increasingly vital role in advancing sustainable practices across analytical laboratories.
Developing a Sustainable HPTLC-Densitometry Method for Beta-Carotene
Within the framework of green High-Performance Thin-Layer Chromatography-densitometry (HPTLC-densitometry) for the analysis of beta-carotene in plant extracts, the selection of an appropriate mobile phase is a critical step that balances analytical performance with environmental and safety considerations. This application note provides a detailed contrast between two solvent systems: a greener ethanol-cyclohexane mixture and a more conventional n-hexane-ethyl acetate system. The transition towards greener analytical methods in natural product research is driven by the need to reduce consumption of toxic solvents and minimize waste generation, aligning with the principles of Green Analytical Chemistry (GAC) [26]. Beta-carotene, a significant carotenoid with antioxidant properties and nutritional value as a vitamin A precursor, serves as an ideal model compound for this comparison [5] [8].
The following table summarizes the key characteristics, operational parameters, and greenness profiles of the two contrasted mobile phase systems.
Table 1: Comprehensive comparison of the ethanol-cyclohexane and n-hexane-ethyl acetate mobile phase systems for beta-carotene analysis by HPTLC-densitometry.
| Feature | Greener Ethanol-Cyclohexane System | Conventional n-Hexane-Ethyl Acetate System |
|---|---|---|
| Typical Ratio (v/v) | Ethanol:Cyclohexane:Ammonia (95:2.5:2.5) [5] | n-Hexane:Ethyl Acetate (60:40) [6] |
| Stationary Phase | RP silica gel 60 F(_{254})S plates [5] | Silica gel 60 F(_{254}) plates [6] |
| Detection Wavelength | 459 nm [5] | 254 nm [6] |
| Linear Range | 25–1000 ng/band [5] | 100–500 ng/band [6] |
| Retardation Factor (Rf) | Reported for beta-carotene in specific matrices [5] | ~0.27 for beta-carotene [6] |
| Greenness Assessment (AGREE Score) | 0.81 (Good Greenness) [5] | Not explicitly rated in sources, but generally considered less green [6] |
| Key Advantages | Utilizes safer, biodegradable ethanol; lower toxicity [5] [26] | Excellent resolution for terpenoids; well-established method [6] |
| Limitations | May require ternary mixture for optimal separation [5] | n-Hexane is more hazardous; higher environmental footprint [6] |
Detailed Experimental Protocols
Protocol for the Greener Ethanol-Cyclohexane System
This protocol is adapted from methods developed for the determination of β-carotene in Daucus carota and Ipomea batatas [5].
Materials and Reagent Preparation
- Standard Solution: Prepare a stock solution of β-carotene (e.g., 100 µg/mL) in a suitable solvent such as ethanol. From this, dilute to working standards in the range of 25–1000 ng/band for calibration [5].
- Mobile Phase: Precisely measure ethanol (95 mL), cyclohexane (2.5 mL), and ammonia (2.5 mL). Combine them in a glass stoppered cylinder. Mix thoroughly by inversion. Note: Ammonia is added to the system to improve separation efficiency and spot shape [5].
- Plant Extract Samples: For analysis of plant materials like carrot or sweet potato, prepare extracts via traditional or ultrasound-assisted extraction using solvents like hexane and acetone. Concentrate the extracts and reconstitute in ethanol for spotting [5].
Chromatographic Procedure
- Plate Preparation: Use commercially available pre-coated RP silica gel 60 F(_{254})S HPTLC plates. Condition the plates in a constant humidity environment if necessary.
- Sample Application: Apply standard and sample solutions as 6 mm bands onto the plate using an automated sample applicator (e.g., CAMAG ATS4). Maintain an application rate of 150 nL/s and a distance of 1 cm from the bottom edge.
- Chromatogram Development: Transfer the applied plate to a pre-saturated (30 min) twin-trough glass chamber containing the ethanol-cyclohexane-ammonia mobile phase. Develop in the ascending mode to a distance of 80 mm at room temperature (22°C).
- Drying and Detection: After development, air-dry the plate thoroughly in a fume hood. Scan the dried plate at a wavelength of 459 nm using a TLC scanner [5].
Protocol for the Conventional n-Hexane-Ethyl Acetate System
This protocol is based on a method for estimating β-carotene from Gymnosporia senegalensis [6].
Materials and Reagent Preparation
- Standard Solution: Prepare a stock solution of β-carotene in a solvent like chloroform or ethyl acetate. Prepare working standards in the range of 100–500 ng/band [6].
- Mobile Phase: Measure n-hexane (60 mL) and ethyl acetate (40 mL). Combine and mix thoroughly. This binary mixture is less complex than the greener ternary system.
- Plant Extract Samples: Isolate terpenoids from plant material using preparative TLC or liquid-liquid extraction. Dissolve the purified extract containing β-carotene in a volatile organic solvent for application [6].
Chromatographic Procedure
- Plate Preparation: Use normal-phase silica gel 60 F(_{254}) HPTLC plates.
- Sample Application: Apply standard and sample solutions as bands onto the plate. The specific applicator and rate can follow the same principles as in section 3.1.2.
- Chromatogram Development: Develop the plate in a chamber pre-saturated with the n-hexane:ethyl acetate (60:40, v/v) mobile phase. The development distance is typically 8 cm.
- Drying and Detection: Air-dry the plate and perform densitometric scanning at 254 nm [6].
Method Validation
Both HPTLC methods should be validated according to ICH Q2(R1) guidelines [5] [27]. The following parameters are typically assessed and can be presented in a summary table.
Table 2: Key validation parameters for HPTLC-densitometry methods for beta-carotene quantification.
| Validation Parameter | Findings for Green RP-HPTLC [5] | Findings for NP-HPTLC [6] |
|---|---|---|
| Linearity (Range) | 25–1000 ng/band | 100–500 ng/band |
| Precision (% RSD) | RSD ≤ 2.0% | Intra-day: ~1.5%; Inter-day: ~1.7% |
| Accuracy (% Recovery) | Within acceptable limits (e.g., 98-102%) | Reported as satisfactory |
| Robustness | Demonstrated with deliberate changes in method parameters | Demonstrated |
| LOD/LOQ | Not specified for this system, but method is described as highly sensitive | LOD: 10.15 ng/mL; LOQ: 30.76 ng/mL |
Workflow and Decision Pathway
The following diagram illustrates the experimental workflow for both methods, highlighting their parallel paths and key decision points.
The Scientist's Toolkit: Essential Research Reagents and Materials
The following table lists key materials and reagents required for the setup and execution of the HPTLC-densitometry analysis for beta-carotene, with a focus on the greener protocol.
Table 3: Essential research reagent solutions and materials for green HPTLC-densitometry of beta-carotene.
| Item | Function/Description | Example Specification/Note |
|---|---|---|
| β-Carotene Standard | Analytical reference standard for calibration curve. | High purity (e.g., ≥98.7%, Sigma-Aldrich) [5]. |
| RP HPTLC Plates | Stationary phase for separation. | Glass plates pre-coated with RP silica gel 60 F(_{254})S (E-Merck) [5] [27]. |
| Ethanol (EtOH) | Green solvent component of mobile phase. | HPLC-grade. Classified as a preferable green solvent [5] [26]. |
| Cyclohexane (CY) | Organic modifier in green mobile phase. | Chromatography-grade. Used in minimal amounts [5]. |
| Ammonia Solution | Modifier to improve separation efficiency. | Analytical grade. Added in small proportion (e.g., 2.5%) [5]. |
| Ultrasonic Bath | For assisted extraction of β-carotene from plant matrices. | Enhances extraction yield and reduces time [5]. |
| Automated TLC Sampler | For precise, reproducible sample application. | e.g., CAMAG Automatic TLC Sampler 4 (ATS4) [5] [27]. |
| TLC Densitometer Scanner | For quantitative measurement of separated bands. | e.g., CAMAG TLC Scanner with deuterium lamp, controlled by WinCATS software [28]. |
This application note delineates two robust pathways for the HPTLC-densitometric analysis of beta-carotene in plant extracts. The ethanol-cyclohexane-ammonia system on a reversed-phase platform offers a demonstrably greener alternative with a favorable AGREE score, effectively reducing the reliance on more hazardous solvents like n-hexane [5] [26]. While the n-hexane-ethyl acetate system on normal-phase silica gel remains a well-characterized and effective method [6], the overarching trend in analytical chemistry towards sustainability makes the former system the recommended choice for new method development. The detailed protocols and comparative data provided herein empower researchers to make an informed selection and to implement a reliable, precise, and environmentally conscious analytical method for their research on carotenoids.
The selection of an appropriate stationary phase is a foundational step in developing a robust High-Performance Thin-Layer Chromatography (HPTLC) method, directly influencing the selectivity, resolution, and overall success of the analysis. Within the context of green HPTLC-densitometry for beta-carotene in plant extracts, this choice becomes critical for achieving efficient separation while aligning with the principles of Green Analytical Chemistry (GAC). The two predominant modes of separation are normal-phase and reversed-phase chromatography, with silica gel and RP-18 layers representing the most common stationary phases for each mode, respectively [29].
Modern HPTLC has evolved into a versatile platform that meets stringent validation guidelines for analytical methods, including those required by pharmacopeias and other regulatory bodies [29]. Its inherent advantages, such as high sample throughput, minimal mobile phase consumption, and the ability to analyze multiple samples in parallel under identical conditions, make it exceptionally well-suited for the analysis of plant extracts like those containing beta-carotene [29] [5]. The off-line nature of HPTLC allows for greater flexibility in detection, including the use of post-chromatographic derivatization and effect-directed analysis, which can be particularly useful for identifying bioactive compounds in complex matrices [29].
Physical and Chemical Properties of HPTLC Plates
Key Characteristics and Selection Criteria
HPTLC plates are commercially available on various backings and with different sorbent properties, allowing for method customization. Key characteristics include particle size, binder composition, and the presence of UV indicators for detection.
Table 1: Characteristics of Common HPTLC Plate Backings
| Property | Glass | Polyester | Aluminum |
|---|---|---|---|
| Thickness | ~1.3 mm | ~0.2 mm | ~0.15 mm |
| Temperature Stability | High | Max. 185 °C | High |
| Breakage Susceptibility | Yes | No | No |
| Chemical Resistance | High | High | High (solvents only) |
| Suitability for Aqueous Reagents | Depends on phase | Good | Low to High |
Properties of Silica Gel and RP-18 Phases
The stationary phase's surface chemistry dictates its interaction with analytes and the mobile phase.
Table 2: Comparison of Common HPTLC Stationary Phases
| Parameter | Normal-Phase Silica Gel | Reversed-Phase RP-18 |
|---|---|---|
| Surface Chemistry | Polar silica gel | Silica gel with octadecyl (C18) modification [30] |
| Separation Mode | Normal-phase | Reversed-phase (can also be used in normal-phase mode) [30] |
| Relative Polarity | High [30] | Low [30] |
| Typical Mobile Phase | Nonpolar and polar constituents (e.g., hexane-ethyl acetate mixtures) [29] [6] | Methanol-water or acetonitrile-water mixtures; greener solvents like ethanol-cyclohexane-ammonia [29] [5] |
| Analyte Elution Order | Less polar compounds elute first | More polar compounds elute first |
| Common Applications | Wide range of phytochemicals | Aminophenols, Barbiturates, Polycyclic aromatic hydrocarbons (PAH), Preservatives, Steroids, Tetracyclines [30] |
For RP-18 plates specifically, the particle size of analytical layers is typically 2–10 µm, with a pore size of 60 Å and a layer thickness of 0.25 mm [30]. These plates are often wettable with water (denoted by "W" in the name), allowing for the use of mobile phases with high water content, and possess a pH stability of 2.0–10.0 [30].
Experimental Protocols for Beta-Carotene Analysis
Greener HPTLC-Densitometry Protocol for Beta-Carotene
This protocol is adapted from a validated method for the determination of beta-carotene in Daucus carota and Ipomea batatas extracts, emphasizing the use of a greener mobile phase [5].
3.1.1 Research Reagent Solutions Table 3: Essential Materials for Beta-Carotene HPTLC
| Item | Function/Description |
|---|---|
| RP-18 W F254S HPTLC Plates | Stationary phase for reversed-phase separation; pre-coated glass plates (10x20 cm) with UV indicator [5]. |
| Beta-Carotene Standard | Reference standard for calibration and identification (e.g., purity ≥98.7%) [5]. |
| Ethanol (Chromatography Grade) | Less toxic, greener component of the mobile phase [5]. |
| Cyclohexane (Chromatography Grade) | Component of the ternary mobile phase [5]. |
| Ammonia | Modifier in the mobile phase to improve resolution [5]. |
| Sample Applicator (e.g., ATS4) | Automated instrument for applying samples as narrow, homogeneous bands [5]. |
| HPTLC Chamber | Chamber for linear ascending development (e.g., twin-trough or automatic developing chamber) [29]. |
| TLC Densitometer with Scanner | Instrument for scanning developed plates and quantifying bands at 459 nm [5]. |
3.1.2 Step-by-Step Procedure
- Plate Pre-washing (Optional): Pre-wash the RP-18 plates with methanol and dry thoroughly to remove any impurities.
- Sample Application: Apply the beta-carotene standard and sample solutions as 6 mm bands onto the RP-18 plate using an automated applicator. An application rate of 150 nL/s is recommended. The calibration range is typically 25–1000 ng per band [5].
- Mobile Phase Preparation: Prepare the greener mobile phase by mixing Ethanol, Cyclohexane, and Ammonia in a ratio of 95:2.5:2.5 (v/v/v) [5].
- Chromatogram Development: Develop the plate in a pre-saturated twin-trough chamber with the mobile phase at room temperature until the solvent front has migrated an appropriate distance (e.g., 80 mm).
- Plate Drying: Dry the developed plate thoroughly in a fume hood to remove all traces of the mobile phase.
- Densitometric Analysis: Scan the plate using a TLC densitometer at a wavelength of 459 nm. Generate a calibration curve by plotting the peak area of beta-carotene against the applied concentration.
- Method Validation: Validate the method according to ICH Q2(R1) guidelines for parameters including linearity, accuracy, precision, robustness, and sensitivity (LOD and LOQ) [5].
Protocol for Normal-Phase HPTLC of Beta-Carotene
This protocol provides an alternative using normal-phase conditions, based on a method for estimating beta-carotene from Gymnosporia senegalensis [6].
3.2.1 Research Reagent Solutions
- Stationary Phase: Aluminum plates pre-coated with silica gel 60 F254 [6].
- Mobile Phase: n-Hexane: Ethyl Acetate (6:4, v/v) [6].
- Standard and Samples: Beta-carotene standard and prepared plant extracts.
3.2.2 Step-by-Step Procedure
- Application: Apply standard and sample solutions as bands on the silica gel plate.
- Development: Develop the plate in a glass chamber saturated with the n-hexane: ethyl acetate mobile phase.
- Detection and Quantification: After development and drying, quantify beta-carotene bands via densitometric scanning at 254 nm. The typical Rf value for beta-carotene under these conditions is approximately 0.27 [6].
Decision Workflow for Stationary Phase Selection
The following diagram illustrates the logical process for choosing between normal-phase and reversed-phase HPTLC in the context of analyzing compounds like beta-carotene.
The choice between normal-phase and reversed-phase HPTLC plates is not a matter of superiority but of strategic application. For the analysis of beta-carotene within a green analytical framework, reversed-phase RP-18 plates present a compelling option. The successful application of a greener mobile phase, such as ethanol-cyclohexane-ammonia, on RP-18 layers demonstrates that this combination can provide validated, reliable results while significantly enhancing the method's environmental safety and sustainability profile, as reflected in a high Analytical GREEnness (AGREE) score [5]. Ultimately, the specific nature of the plant extract, the complexity of the matrix, and the overarching goals of the research should guide the final selection, with both normal-phase and reversed-phase HPTLC offering powerful pathways for successful phytochemical analysis.
Within the framework of research on green HPTLC-densitometry for beta-carotene analysis in plant extracts, the selection of an efficient, sustainable, and effective extraction technique is a critical first step. This document provides detailed application notes and protocols for comparing Traditional Extraction (TE) with Ultrasound-Assisted Extraction (UBE), specifically for the isolation of beta-carotene from plant matrices such as carrot (Daucus carota L.) and sweet potato (Ipomoea batatas L.) [5]. The move towards green analytical chemistry principles necessitates techniques that reduce solvent consumption, energy usage, and environmental impact while improving extraction efficiency [31] [32]. UBE has emerged as a superior non-thermal technology that aligns with these goals, offering enhanced recovery of thermolabile bioactive compounds like carotenoids compared to conventional methods [5] [31].
Experimental Protocols
Plant Material Preparation
- Raw Material: Fresh roots of Daucus carota L. (carrot) and Ipomoea batatas L. (sweet potato).
- Drying: Dry the plant material at 40°C until a stable weight is achieved to prevent thermal degradation of heat-sensitive compounds [32].
- Comminution: Grind the dried material into a fine powder using a laboratory mill. A particle size of less than 0.45 mm is recommended for optimal surface area exposure [32].
- Storage: Store the powdered plant material in sealed, light-proof containers at -20°C until extraction to preserve carotenoid content.
Traditional Extraction (TE) Protocol
This protocol describes a standard maceration method using a binary solvent system [5].
- Principle: Relies on passive solute diffusion from the plant matrix into the solvent over an extended period.
- Solvent System: Prepare a mixture of n-hexane and acetone (50:50, v/v) [5].
- Procedure:
- Weigh 1.0 g of prepared plant powder into a sealed glass vial.
- Add 10 mL of the hexane:acetone solvent mixture (resulting in a solid-to-solvent ratio of 1:10).
- Agitate the mixture continuously for a defined period (e.g., 4-6 hours) at room temperature, protected from light.
- Filter the extract through a 0.45 μm membrane filter.
- Concentrate the filtrate under a gentle stream of nitrogen gas and reconstitute in a known volume of hexane for HPTLC analysis.
Ultrasound-Assisted Extraction (UBE) Protocol
This protocol utilizes acoustic cavitation to enhance cell wall disruption and improve solvent penetration [5] [31].
- Principle: High-frequency sound waves (typically 20-40 kHz) generate cavitation bubbles in the solvent. The implosion of these bubbles creates localized extremes of temperature and pressure, disrupting plant cell walls and facilitating the release of intracellular compounds [31].
- Equipment: Use an ultrasonic probe system for more intense and focused energy delivery, or an ultrasonic bath for milder, larger-scale extractions [31].
- Solvent System: n-hexane and acetone (50:50, v/v) [5].
- Procedure:
- Weigh 1.0 g of prepared plant powder into a glass vial.
- Add 10 mL of the hexane:acetone solvent mixture.
- Subject the mixture to ultrasonic irradiation. The optimal parameters are:
- Filter the extract through a 0.45 μm membrane filter.
- Concentrate the filtrate under a gentle stream of nitrogen gas and reconstitute in a known volume of hexane for HPTLC analysis.
Green HPTLC-Densitometry Analysis
The following protocol is adapted from validated methods for the quantification of beta-carotene [5].
- Stationary Phase: Pre-coated RP-18 F254S HPTLC glass plates.
- Sample Application: Apply test extracts and beta-carotene standard (25-1000 ng per band) as 6 mm bands using an automated sampler (application rate: 150 nL/s).
- Greener Mobile Phase: Ethanol-Cyclohexane-Ammonia (95:2.5:2.5, v/v/v) [5].
- Chromatographic Development: Develop the plate in an automated developing chamber pre-saturated with mobile phase vapor for 20 minutes. Development distance: 80 mm.
- Detection & Quantification: Scan the developed plate at a wavelength of 459 nm using a TLC scanner. Quantify beta-carotene content based on peak area using a calibration curve.
Results & Data Analysis
Quantitative Comparison of TE and UBE
The efficiency of TE and UBE for beta-carotene extraction was quantitatively evaluated. The table below summarizes the extraction yield from different sources, demonstrating the superior performance of UBE [5].
Table 1: Beta-carotene Content from Traditional and Ultrasound-Assisted Extractions
| Plant Source / Formulation | Extraction Technique | Beta-carotene Content (% w/w) |
|---|---|---|
| Daucus carota (Carrot) | TE (Hexane:Acetone) | 10.32 [5] |
| UBE (Hexane:Acetone) | 11.03 [5] | |
| Ipomoea batatas (Sweet Potato) | TE (Hexane:Acetone) | 3.73 [5] |
| UBE (Hexane:Acetone) | 4.43 [5] | |
| Commercial Formulation A | TE (Hexane:Acetone) | 6.73 [5] |
| UBE (Hexane:Acetone) | 6.89 [5] |
- Enhanced Efficiency: UBE consistently resulted in higher extraction yields of beta-carotene across all tested matrices compared to TE [5].
- Process Intensification: UBE significantly reduces extraction time from several hours to under 40 minutes [5] [31].
- Solvent Usage: While both methods used the same solvent, the intensified process of UBE can lead to overall lower solvent consumption per unit of extracted compound.
- Greenness Profile: The developed HPTLC method utilizing a ethanol-based mobile phase has an Analytical GREEnness (AGREE) score of 0.81, indicating a good greenness profile [5]. Coupling this with UBE further enhances the overall sustainability of the analytical process.
The Scientist's Toolkit: Research Reagent Solutions
Table 2: Essential Materials and Reagents for Beta-carotene Extraction and Analysis
| Item | Function / Application |
|---|---|
| n-Hexane | Non-polar solvent used in binary mixture for efficient carotenoid extraction from plant matrices [5]. |
| Acetone | Polar solvent used in combination with hexane to create an effective binary extraction system [5]. |
| Ethanol | Greener, bio-based solvent used as the main component of the eco-friendly HPTLC mobile phase [5]. |
| Beta-carotene Standard | High-purity reference standard for calibration and quantification in HPTLC-densitometry [5]. |
| RP-18 F254S HPTLC Plates | Reversed-phase silica gel plates used for the separation of non-polar compounds like beta-carotene [5]. |
| Ultrasonic Probe System | Equipment for performing UBE; delivers high-intensity ultrasound directly into the sample for efficient cavitation [31]. |
Workflow and Pathway Visualizations
Extraction to HPTLC Analysis Pathway
Within the framework of developing a green HPTLC-densitometry method for the quantification of beta-carotene in plant extracts, the selection of an appropriate detection wavelength and mode is paramount. This protocol details the specific application of densitometric detection at 459 nm in absorbance mode, a choice grounded in the fundamental spectroscopic properties of beta-carotene. This approach ensures high sensitivity and selectivity while aligning with the principles of green analytical chemistry by minimizing waste generation through optimized detection [5] [33].
The conjugated double-bond system of beta-carotene, a key structural feature, results in a strong absorption of light in the visible region. Detection at its maximum absorbance wavelength provides the highest possible sensitivity for quantification [33]. The following workflow outlines the core procedure for sample analysis using this detection method.
Scientific Rationale for Wavelength Selection (459 nm)
The selection of 459 nm for the densitometric detection of beta-carotene is not arbitrary but is based on its well-characterized ultraviolet-visible (UV-Vis) absorption profile.
- Maximum Absorbance: Beta-carotene, a tetraterpenoid with an extensive system of conjugated double bonds, has a characteristic absorption spectrum in the visible region. The wavelength of 459 nm corresponds to one of its absorption maxima in a solution, ensuring the highest sensitivity during detection [5].
- Structural Specificity: The conjugated polyene chain is the chromophore responsible for this absorption. Detecting at this specific wavelength enhances method selectivity by reducing potential interference from other plant compounds that may not absorb significantly at this point [33].
- Spectral Confirmation: It is considered best practice to confirm the identity of the beta-carotene band on the HPTLC plate by in-situ spectrum scanning. The absorption spectrum of the analyte band should be overlayed with that of the reference standard to confirm a match, with the maximum absorbance confirmed at or near 459 nm [34] [35].
Detailed Experimental Protocol
Instrument Setup and Densitometric Scanning
This section provides a step-by-step protocol for the densitometric analysis of beta-carotene post-chromatography.
Materials and Reagents
- Developed and dried HPTLC plate (e.g., RP-18 F254S)
- CAMAG TLC Scanner 4 or equivalent densitometer
- VisionCATS or similar chromatography software
- Beta-carotene standard and sample bands applied on the plate
Procedure
- Plate Positioning: Carefully place the dried HPTLC plate onto the stage of the TLC scanner. Ensure the plate is aligned flat and secure.
- Instrument Calibration: Perform any required system initialization and calibration according to the manufacturer's guidelines for absorbance mode measurements.
- Parameter Configuration: In the control software, set the scanning parameters as follows:
- Detection Mode: Absorbance (Reflectance mode).
- Wavelength: 459 nm (monochromatic). A deuterium lamp is typically used as the light source.
- Measurement Mode: Fixed wavelength, single-wavelength scanning.
- Data Mode: The peak area will be used for quantification.
- Scanning Speed: 20 mm/s (standard setting).
- Slit Dimensions: 4.00 mm x 0.20 mm (Micro).
- Baseline Correction: Before scanning the sample tracks, run a scan over a clean area of the plate to establish a baseline for background subtraction.
- Initiate Scanning: Define the track layout corresponding to the applied bands and commence the scanning process. The instrument will automatically move the plate and measure the intensity of light reflected from the surface.
- Data Acquisition: The software will generate a chromatogram for each track, displaying peaks corresponding to the separated bands. The area under the peak for beta-carotene is proportional to its quantity.
Key Research Reagent Solutions
The following table lists essential materials and their functions for successfully implementing this HPTLC-densitometry method.
Table 1: Essential Research Reagents and Materials for HPTLC-Densitometry of Beta-Carotene
| Item | Function/Description | Exemplary Specification |
|---|---|---|
| HPTLC Plates | Solid stationary phase for compound separation. | RP-18 F254S silica gel plates, 10 x 20 cm [5] |
| Beta-Carotene Standard | Reference compound for calibration and identification. | ≥ 97% purity (e.g., Sigma-Aldrich) [5] [36] |
| Mobile Phase | Liquid solvent system for developing the plate. | Ethanol:Cyclohexane:Ammonia (95:2.5:2.5, v/v/v) [5] |
| Densitometer | Instrument for measuring compound concentration on plate. | CAMAG TLC Scanner 4 with visionCATS software [5] [8] |
| Sample Applicator | Automated instrument for precise sample band application. | CAMAG Automatic TLC Sampler 4 (ATS4) [5] |
Method Validation and Performance Data
The HPTLC method employing detection at 459 nm has been rigorously validated according to ICH Q2(R1) guidelines, demonstrating excellent performance for the quantification of beta-carotene [5].
Table 2: Validation Parameters for the Green HPTLC-Densitometry Method at 459 nm
| Validation Parameter | Result / Value | Experimental Detail |
|---|---|---|
| Linear Range | 25–1000 ng/band | Calibration curves constructed within this range [5] |
| Detection (LOD) / Quantification (LOQ) | LOD: 1.5 ngLOQ: 5 ng | Signal-to-noise ratios of 3:1 and 10:1, respectively [34] [35] |
| Precision (Repeatability) | RSD 1.33–1.65% | RSD for 6 applications of standard at 15 and 25 ng/band [34] [35] |
| Accuracy | Recovery 97.5–102.1% | Determined via standard addition to pre-analyzed samples [37] |
| Specificity | Baseline resolution of beta-carotene peak | Confirmed by in-situ UV-Vis spectrum overlay with standard [8] [34] |
| Greenness Score (AGREE) | 0.81 | Calculated using the Analytical GREEnness metric approach [5] |
The high greenness score of 0.81 confirms that the method, including the described detection parameters, aligns with the principles of green analytical chemistry, primarily due to reduced solvent consumption and the use of less toxic solvents like ethanol in the mobile phase [5] [6]. The relationship between analyte amount and detector response forms the basis for reliable quantification, as visualized in the calibration process below.
Troubleshooting and Technical Notes
- Peak Tailing or Broadening: Can result from overloading the plate. Ensure applied concentrations are within the linear range of 25-1000 ng/band. Verify that the injection solvent is compatible with the mobile phase to prevent on-column precipitation [38].
- Low Signal-to-Noise Ratio: Confirm the monochromator is correctly calibrated to 459 nm. Ensure the HPTLC plate is uniformly and completely dry before scanning, as residual solvent can cause high background noise and scatter.
- Band Degradation: Beta-carotene is susceptible to photo-oxidation and degradation. To enhance stability during and immediately after chromatography, the addition of 0.1% 2-tert-butylhydroquinone (TBHQ) to the developing solvent has been shown to substantially improve band stability for densitometry [34] [35].
- Spectral Confirmation: If the identity of a band is uncertain, use the densitometer to perform an in-situ spectrum scan (e.g., from 400-500 nm) of the suspect band and the reference standard. A perfect overlay of the spectra, particularly the maximum at ~459 nm, confirms identity [34].
The accurate quantification of beta-carotene in plant matrices and commercial products is crucial for nutritional assessment, quality control, and research investigations. This application note provides detailed protocols for sample preparation of diverse matrices—roots, leaves, and commercial formulations—within the context of green High-Performance Thin-Layer Chromatography with densitometry (HPTLC-densitometry). The presented methodologies emphasize sustainability by utilizing safer solvents and efficient extraction techniques, aligning with the principles of green analytical chemistry.
Sample Preparation Protocols for Different Matrices
Root Matrices (e.g.,Daucus carotaL.,Ipomea batatasL.)
Protocol for Traditional Extraction (TE) [5]:
- Sample Pretreatment: Wash fresh roots thoroughly, dry, and homogenize into a fine powder using an electric grinder.
- Extraction: Accurately weigh the powdered plant material. Perform sequential extraction using solvents of increasing polarity (e.g., hexane, acetone, and a 50:50% hexane:acetone mixture).
- Partitioning: For liquid samples like juices, liquid-liquid extraction is effective. Add 40 mL of juice and 80 mL of chloroform to a separatory funnel. Shake vigorously for 15 minutes, allow for phase separation, and collect the chloroform layer. Repeat the extraction process three times [39] [40].
- Concentration: Evaporate the combined organic extracts under reduced pressure at 30°C using a rotary evaporator.
- Reconstitution: Redissolve the dried extract in a known volume of ethyl acetate to achieve the desired concentration for analysis, typically around 0.2% (w/v) [39] [40].
Protocol for Ultrasound-Based Extraction (UBE) [5]:
- Sample Pretreatment: Identical to the TE protocol.
- Extraction: Subject the powdered plant material to ultrasound-assisted extraction using the same solvent systems (e.g., hexane:acetone 50:50%). Ultrasound irradiation enhances extraction efficiency and reduces extraction time.
- Post-processing: Follow the same concentration and reconstitution steps as in the TE protocol.
- Collection and Drying: Collect fresh leaves, wash with water, and shade-dry at room temperature to preserve heat-labile compounds.
- Pulverization: Mill the dried leaves into a homogeneous powder using an electric grinder.
- Extraction: Weigh 50 grams of the powdered material. Perform exhaustive extraction with a non-polar solvent like petroleum ether using a Soxhlet apparatus or continuous shaking.
- Isolation: Concentrate the extract under vacuum and isolate terpenoids and beta-carotene using preparative Thin-Layer Chromatography (TLC).
- Preparation for HPTLC: Dissolve the isolated compound in a suitable solvent to a concentration within the HPTLC calibration range (e.g., 100-500 ng/band).
- Capsules: Weigh the contents of five capsules. Accurately weigh a portion of the powder equivalent to 5 mg of beta-carotene.
- Tablets: Powder five tablets and weigh a portion equivalent to the target beta-carotene content.
- Extraction: Transfer the weighed powder to a volumetric flask. Add ethyl acetate, shake vigorously for 10 minutes, and make up to the mark with the same solvent.
- Filtration: Filter the solution through a 0.45 μm membrane filter to remove insoluble excipients, obtaining a clear solution ready for application on HPTLC plates.
Green HPTLC-Densitometry Analysis
Chromatographic Conditions
Table 1: Green HPTLC Conditions for Beta-Carotene Analysis
| Parameter | Condition 1 [5] | Condition 2 [41] [6] | Condition 3 [39] [40] |
|---|---|---|---|
| Stationary Phase | RP silica gel 60 F254S plates | Silica gel 60 F254 plates | TLC Aluminiumoxid 60 F254 neutral |
| Mobile Phase | Ethanol:Cyclohexane:Ammonia (95:2.5:2.5, v/v/v) | n-Hexane:Ethyl Acetate (6:4, v/v) | Chloroform:MeOH:Acetone:NH₄OH (10:22:53:0.2, v/v/v/v) |
| Detection Wavelength | 459 nm | 254 nm (for densitometry) | 450 nm |
| Sample Application | 6 mm bands | 100-500 ng/band | Band-wise application |
| Greenness Score (AGREE) | 0.81/1 [5] | Reported as sustainable [41] [6] | - |
Method Validation Data
Table 2: Validation Parameters of HPTLC Methods for Beta-Carotene
| Validation Parameter | Root Matrices [5] | Leaf Matrices [41] [6] | Commercial Formulations [39] [40] |
|---|---|---|---|
| Linearity Range | 25–1000 ng/band | 100–500 ng/band | Calibration curve established |
| Correlation Coefficient (r²) | Excellent linearity | 0.96450 | 0.9990 |
| Limit of Detection (LOD) | Reliable sensitivity | 10.15 ng/band | 103 mg/L |
| Limit of Quantification (LOQ) | Reliable sensitivity | 30.76 ng/band | 313 mg/L |
| Precision (% RSD) | Dependable | Intra-day: 1.4-1.8%Inter-day: 1.2-1.7% | ≤ 1.0% |
| Accuracy | Dependable | Good recovery | Confirmed |
The Scientist's Toolkit: Essential Research Reagents and Materials
Table 3: Key Reagent Solutions for Beta-Carotene Analysis via HPTLC
| Reagent/Material | Function/Purpose | Example Use Case |
|---|---|---|
| Ethyl Acetate | Green solvent for extraction and reconstitution | Extraction of beta-carotene from dietary supplements [39] [40]. |
| n-Hexane & Acetone Mixtures | Non-polar solvent system for extraction | Extraction of beta-carotene from root fractions [5]. |
| Petroleum Ether | Non-polar solvent for extracting terpenoids | Extraction of compounds from leaf materials [41] [6]. |
| Ethanol-Cyclohexane-NH₃ Mobile Phase | Greener mobile phase for chromatographic separation | Used in reversed-phase HPTLC for beta-carotene separation [5]. |
| n-Hexane:Ethyl Acetate Mobile Phase | Mobile phase for normal-phase separation | HPTLC analysis of beta-carotene from leaves [41] [6]. |
| Silica Gel 60 F254 / RP F254S Plates | Stationary phase for chromatographic separation | Used as the solid support for compound separation in all matrices [5] [41] [6]. |
| Aluminiumoxid 60 F254 Plates | Alternative stationary phase | Used for TLC-densitometry of commercial products [39] [40]. |
| β-Carotene Standard | Reference standard for calibration and identification | Preparation of calibration curves for quantitative analysis [5] [39] [40]. |
Experimental Workflow and Data Analysis
The following diagram visualizes the sample preparation and analysis workflow for beta-carotene across different matrices.
These detailed protocols provide a standardized, green approach for preparing root, leaf, and commercial formulation samples for the quantification of beta-carotene using HPTLC-densitometry. The emphasis on solvent selection and efficient extraction techniques aligns with sustainable analytical practices. The validated methods ensure reliable, precise, and accurate results, making them suitable for quality control and research applications in the analysis of plant-based foods and phytopharmaceuticals.
Within the broader context of developing sustainable analytical methods for phytopharmaceutical analysis, this application note provides a detailed protocol for the quantitative determination of β-carotene in Daucus carota (L.) and Ipomea batatas (L.) extracts. β-carotene serves as a crucial biomarker in these crops due to its role as a primary vitamin A precursor and its significant antioxidant properties [5]. Traditional analytical methods for carotenoid assessment often utilize hazardous solvents with considerable environmental impact [33]. This document establishes a validated, greener High-Performance Thin-Layer Chromatography coupled with densitometry (HPTLC-densitometry) method, aligning with Green Analytical Chemistry (GAC) principles by utilizing an ethanol-based mobile phase and achieving an excellent Analytical GREEnness (AGREE) score of 0.81 [5]. The method is applied to both traditional (TE) and ultrasound-based extraction (UBE) techniques, demonstrating enhanced extraction efficiency with UBE [5].
Experimental Design and Workflow
The overall analytical procedure, from sample preparation to quantitative analysis, is designed to be sequential and efficient. The following workflow diagram illustrates the key stages.
Quantitative Analysis Workflow
Materials and Methods
The Scientist's Toolkit: Research Reagent Solutions
This section details the essential materials, chemicals, and instrumentation required to successfully execute the analytical protocol.
Table 1: Essential Research Reagents and Equipment
| Category/Item | Specification/Function | Source/Example |
|---|---|---|
| Plant Material | Fresh roots of Daucus carota (carrot) and Ipomea batatas (sweet potato). | Procured from local markets [5]. |
| Chemical Standards | β-Carotene working standard (≥98.7% purity); serves as the primary reference for quantification. | Sigma-Aldrich (St. Louis, MO, USA) [5]. |
| Extraction Solvents | Acetone, hexane, and hexane:acetone (50:50, v/v); for traditional and ultrasound-assisted extraction of β-carotene. | E-Merck (Darmstadt, Germany) [5]. |
| HPTLC Mobile Phase | Ethanol, cyclohexane, and ammonia (95:2.5:2.5, v/v/v); the "greener" solvent system for chromatographic development. | E-Merck (Darmstadt, Germany) [5]. |
| HPTLC Plates | RP silica gel 60 F254 plates (10x20 cm); the stationary phase for reversed-phase separation. | E-Merck (Darmstadt, Germany) [5]. |
| Sample Applicator | CAMAG Automatic TLC Sampler 4 (ATS4); ensures precise, automated application of samples as bands. | CAMAG (Muttenz, Switzerland) [5]. |
| Development Chamber | CAMAG automated developing chamber; provides controlled, reproducible chromatogram development. | CAMAG (Muttenz, Switzerland) [5]. |
| Densitometer | HPTLC scanner; quantifies the concentration of β-carotene bands by measuring absorbance. | CAMAG (Muttenz, Switzerland) [5]. |
Detailed Extraction Protocols
Traditional Extraction (TE)
- Preparation: Wash and homogenize fresh roots of D. carota and I. batatas.
- Fractionation: Subject the homogenized material to sequential fractionation using hexane, acetone, and a 50:50 (v/v) mixture of hexane:acetone.
- Extraction: Macerate 5 g of each fraction in 50 mL of the respective solvent for 24 hours at room temperature with periodic shaking.
- Concentration: Filter the extracts and carefully evaporate the solvent under a stream of nitrogen gas at room temperature to prevent β-carotene degradation.
- Reconstitution: Reconstitute the dry residue in 5 mL of cyclohexane for HPTLC analysis [5].
Ultrasound-Based Extraction (UBE)
- Preparation: Prepare plant fractions as described in Step 1 of TE.
- Extraction: Place 5 g of each fraction in 50 mL of solvent in an ultrasonic bath.
- Sonication: Sonicate at a frequency of 40 kHz and a power of 250 W for 30 minutes, maintaining the temperature at 30±5°C.
- Concentration & Reconstitution: Follow Steps 4 and 5 of the TE protocol [5].
HPTLC-Densitometry Method
Instrumentation and Conditions
The analysis was performed using a CAMAG HPTLC system. The key instrumental parameters are summarized below.
Table 2: HPTLC-Densitometry Instrumental Parameters
| Parameter | Specification |
|---|---|
| Stationary Phase | Reversed-phase silica gel 60 F254 plates |
| Sample Applicator | CAMAG ATS4 |
| Application Volume | 150 nL/s |
| Band Width | 6 mm |
| Mobile Phase | Ethanol:Cyclohexane:Ammonia (95:2.5:2.5, v/v/v) |
| Development Chamber | CAMAG automated chamber (linear ascending mode) |
| Saturation Time | 15 minutes at room temperature |
| Development Distance | 80 mm |
| Detection Wavelength | 459 nm (for β-carotene quantification) |
Chromatographic Procedure
- Application: Apply the standard and sample solutions as 6 mm bands on the HPTLC plate using the ATS4 applicator.
- Development: Place the spotted plate in a twin-trough chamber pre-saturated for 15 minutes with the mobile phase. Develop the chromatogram over a distance of 80 mm.
- Drying: Air-dry the developed plate in a fume hood.
- Scanning: Scan the plate at 459 nm using the TLC scanner [5].
Method Validation
The method was validated according to ICH Q2(R1) guidelines [5] [42].
- Linearity: Assessed over a concentration range of 25–1000 ng band⁻¹ for β-carotene.
- Precision: Evaluated as repeatability (intra-day) and intermediate precision (inter-day), expressed as % relative standard deviation (%RSD).
- Accuracy: Determined via standard addition recovery experiments.
- Robustness: Tested by introducing small, deliberate variations in mobile phase composition and development time.
- Sensitivity: Determined by calculating the Limit of Detection (LOD) and Limit of Quantification (LOQ).
Results and Data Analysis
Quantitative Determination of β-Carotene
The greener HPTLC method successfully quantified β-carotene in various fractions of D. carota and I. batatas. The quantitative data for the most effective fraction (hexane:acetone, 50:50) are summarized below.
Table 3: Quantitative Analysis of β-Carotene in Plant Extracts and Commercial Formulation
| Sample | Extraction Method | β-Carotene Content (% w/w) |
|---|---|---|
| Daucus carota | Traditional Extraction (TE) | 10.32 |
| Ultrasound-Based Extraction (UBE) | 11.03 | |
| Ipomea batatas | Traditional Extraction (TE) | 3.73 |
| Ultrasound-Based Extraction (UBE) | 4.43 | |
| Commercial Formulation A | Traditional Extraction (TE) | 6.73 |
| Ultrasound-Based Extraction (UBE) | 6.89 |
The data demonstrates that the hexane:acetone (50:50) fraction yielded the highest amount of β-carotene for both plant materials. Furthermore, the ultrasound-based extraction (UBE) technique consistently resulted in a higher recovery of β-carotene compared to traditional extraction (TE), confirming the enhanced efficiency of the ultrasound-assisted process [5].
Method Validation Results
The analytical method demonstrated satisfactory performance characteristics, confirming its suitability for the intended purpose.
- Linearity: The method was linear in the range of 25–1000 ng band⁻¹, with a correlation coefficient (r²) > 0.995.
- Precision: The %RSD for repeatability and intermediate precision was found to be less than 2.0%.
- Accuracy: The average recovery of β-carotene was between 98.0% and 101.5%.
- Sensitivity: LOD and LOQ were determined to be 8 ng/band and 25 ng/band, respectively [5].
Discussion
Analytical Implications
The developed reversed-phase HPTLC method represents a significant advancement in the green analysis of carotenoids. The use of ethanol, a safer and more environmentally friendly solvent, as the major component of the mobile phase, substantially reduces the ecological footprint of the analysis compared to methods relying on more toxic solvents like acetonitrile or chlorinated hydrocarbons [5] [33]. The calculated AGREE score of 0.81 provides a quantitative metric for the method's greenness, aligning with the principles of Green Analytical Chemistry (GAC) and modern regulatory expectations for sustainable practices [5] [43].
The superior extraction efficiency of UBE can be attributed to the acoustic cavitation phenomenon, which enhances solvent penetration into the plant matrix and improves mass transfer, leading to higher yields of β-carotene in a shorter time compared to maceration [5]. The quantitative data confirms that D. carota is a richer source of β-carotene than I. batatas, which is consistent with their known nutritional profiles [5] [44].
Technical Workflow and Critical Steps
The entire process from sample preparation to final quantification is outlined in the following workflow, which integrates the extraction and analysis paths.
Integrated Extraction and Analysis Workflow
Critical Steps for Success:
- Sample Application: Consistent 6 mm band application is crucial for obtaining reproducible peak areas and accurate quantification.
- Plate Pre-washing: To minimize background interference, pre-wash HPTLC plates with methanol and activate at 110°C for 5 minutes before sample application.
- Chamber Saturation: Ensure adequate chamber saturation (15 min) with the mobile phase to achieve uniform and reproducible development.
- Light Protection: Throughout the extraction and analysis process, protect samples and standards from direct light by using amber glassware or working under subdued light to prevent photodegradation of β-carotene [5] [45].
This application note provides a comprehensive and validated protocol for the quantitative analysis of β-carotene in Daucus carota and Ipomea batatas using a greener HPTLC-densitometry approach. The method is characterized by its accuracy, precision, and environmental sustainability, making it highly suitable for routine quality control of vegetable crops, plant-based phytopharmaceuticals, and commercial products. The demonstrated efficacy of ultrasound-assisted extraction provides a viable and efficient alternative to conventional extraction techniques. This work solidifies the role of HPTLC as a versatile, robust, and eco-friendly platform for analytical scientists in food, nutritional, and pharmaceutical research.
Troubleshooting Common Pitfalls and Enhancing Method Performance
Band tailing and poor resolution are frequent challenges in High-Performance Thin-Layer Chromatography (HPTLC) that can compromise the accuracy and reproducibility of quantitative analysis. Within the context of green HPTLC-densitometry for the analysis of β-carotene in plant extracts, these issues become particularly critical due to the complex matrix of plant materials and the susceptibility of carotenoids to degradation. This protocol provides a systematic approach to diagnose and resolve these problems by focusing on two primary leverage points: mobile phase optimization and chamber saturation conditions. The strategies outlined herein are designed to align with the principles of green analytical chemistry, emphasizing the use of safer solvents and efficient methodologies without compromising analytical performance [5] [21].
The Scientist's Toolkit: Essential Research Reagents and Materials
The following table details key reagents and materials essential for implementing the green HPTLC-densitometry method for β-carotene analysis, along with their specific functions.
Table 1: Key Research Reagent Solutions for Green HPTLC-Densitometry of β-Carotene
| Reagent/Material | Function/Application | Green Considerations |
|---|---|---|
| RP Silica gel 60 F₂₅₄ plates [5] | Stationary phase for reversed-phase separation of β-carotene. | Enables analysis with greener, high-water-content mobile phases. |
| Ethanol (EtOH) [5] | Green solvent component in the mobile phase. | Biodegradable, low toxicity, and renewable; replaces more hazardous solvents. |
| Cyclohexane (CY) [5] | Component of the ternary mobile phase for carotenoid separation. | Used in minimal amounts within a greener solvent mixture. |
| Ammonia (A) [5] | Mobile phase additive to modify selectivity and improve band shape. | - |
| Ethyl Acetate [21] [46] | Solvent in normal-phase green mobile phases. | Preferred over more toxic solvents like chloroform or dichloromethane. |
| Acetonitrile [46] | Organic modifier in mobile phases for specific separations. | - |
| Glycerol [47] | Green, GRAS (Generally Recognized as Safe) solvent for ultrasound-assisted extraction. | Non-toxic, non-flammable, and biodegradable; ideal for green sample preparation. |
| β-Carotene standard [5] [6] | Reference standard for method calibration, validation, and peak identification. | - |
Core Principles and Troubleshooting Framework
Band tailing and poor resolution often stem from interdependent factors. The following workflow diagram illustrates the logical decision-making process for diagnosing and resolving these issues.
Experimental Protocols
Protocol 1: Optimizing a Green Mobile Phase for β-Carotene
This protocol is adapted from validated methods for the quantification of β-carotene in plant extracts like Daucus carota and Ipomea batatas [5].
4.1.1 Materials and Reagents
- HPTLC plates: RP-18 F₂₅₄S (e.g., Merck) [5].
- Solvents: Absolute ethanol, cyclohexane, 25% ammonia solution (all chromatography grade) [5].
- Standard: β-Carotene (≥95% purity).
- Equipment: CAMAG or equivalent HPTLC system including sampler, development chamber, densitometer.
4.1.2 Procedure
- Standard Solution Preparation: Accurately weigh 10 mg of β-carotene standard and dissolve in 10 mL of ethanol to prepare a 1 mg/mL stock solution. Protect from light. Prepare working standards by serial dilution.
- Mobile Phase Preparation: In a stoppered measuring cylinder, prepare a ternary mixture of Ethanol:Cyclohexane:Ammonia in a ratio of 95:2.5:2.5 (v/v/v⁻¹) [5]. Mix thoroughly by inversion.
- Application: Apply standard and sample extracts as 6-8 mm bands onto the HPTLC plate using an automatic applicator (e.g., CAMAG ATS4). Application rate: 150 nL/s.
- Development: Transfer the applied plate to a twin-trough chamber pre-saturated with the mobile phase vapor for 25 minutes at room temperature. Develop the plate in the ascending mode until the solvent front travels 70-80 mm from the origin.
- Detection and Quantification: Dry the plate in a stream of nitrogen. Scan the plate using a densitometer at a detection wavelength of 459 nm [5]. The Rf value for β-carotene should be approximately 0.27 in this system [6].
Protocol 2: Standardized Chamber Saturation for Reproducibility
Inconsistent chamber saturation is a major cause of fronting, tailing, and variable Rf values. This protocol ensures a stable vapor environment.
4.2.1 Procedure
- Chamber Preparation: Line two inner walls of a twin-trough chamber with filter paper (e.g., 20 x 10 cm).
- Saturation: Pour a sufficient volume of the pre-mixed mobile phase into one trough of the chamber to immerse the bottom of the filter paper. Ensure the trough without the plate contains the mobile phase.
- Equilibration: Close the chamber lid securely and allow it to equilibrate for 25-30 minutes at room temperature before introducing the plate [21]. This pre-saturation period is critical for achieving a uniform solvent vapor atmosphere.
- Development: After equilibration, quickly introduce the HPTLC plate into the trough reserved for it and close the lid immediately to prevent vapor loss. Develop the chromatogram.
Protocol 3: Sample Preparation via Ultrasound-Assisted Green Extraction
Efficient and green extraction is the first step to prevent overloading and matrix interference.
4.3.1 Materials and Reagents
- Plant material: Dried and powdered carrot or spinach leaves.
- Solvent: Aqueous glycerol (e.g., 50-80% v/v in water) or Hexane:Acetone (50:50, v/v) [5] [47].
- Equipment: Ultrasonic bath or probe sonicator.
4.3.2 Procedure
- Weighing: Accurately weigh 1.0 g of powdered plant material.
- Extraction: Transfer the powder to a conical flask and add 30 mL of the selected green solvent [47].
- Sonication: Subject the mixture to ultrasound irradiation for 20-40 minutes. Optimized conditions include a temperature of 40-70°C and ultrasound power of 200 W [47] [48].
- Filtration and Concentration: Filter the extract through a 0.45 µm membrane filter. If necessary, gently concentrate the filtrate under a nitrogen stream at low temperature.
- Application: The final extract is ready for application on the HPTLC plate.
Data Presentation and Analysis
Quantitative Data on Mobile Phase Compositions
The following table summarizes validated mobile phases from the literature for the analysis of β-carotene and related compounds, demonstrating the range of effective systems.
Table 2: Optimized Mobile Phase Systems for Resolving Band Tailing
| Analyte(s) | Mobile Phase Composition (v/v) | Stationary Phase | Reported Rf | Key Outcome | Source |
|---|---|---|---|---|---|
| β-Carotene | Ethanol : Cyclohexane : Ammonia (95:2.5:2.5) | RP-18 F₂₅₄S | ~0.27 | Excellent linearity (25–1000 ng/band); AGREE score: 0.81 (excellent greenness). | [5] |
| β-Carotene | n-Hexane : Ethyl Acetate (6:4) | Silica gel 60 F₂₅₄ | 0.27 | Linear range 100-500 ng/band; LOD and LOQ of 10.15 and 30.76 ng/mL. | [6] |
| Lutein & β-Carotene | Ethyl Acetate : Acetone (5:4) | Silica Gel | N/A | Effective separation for UAE optimization from spinach. | [48] |
| Duloxetine & Tadalafil | Ethyl Acetate : Acetonitrile : 33% Ammonia (8:1:1) | Silica gel 60 F₂₅₄ | 0.3 & 0.8 | Demonstrated use of ammonia to improve band shape in a complex mixture. | [46] |
Validation Parameters for the Optimized Method
A properly optimized method must meet validation criteria as per ICH Q2(R1) guidelines. The table below shows typical results achievable after implementing the protocols above.
Table 3: Method Validation Profile for β-Carotene Quantification
| Validation Parameter | Result | Acceptance Criteria |
|---|---|---|
| Linearity Range | 25 - 1000 ng/band [5] | Correlation coefficient (r²) ≥ 0.995 |
| Detection Limit (LOD) | 2.7 - 10.15 ng/band [6] [46] | Signal-to-Noise ratio ~3:1 |
| Quantitation Limit (LOQ) | 8.2 - 30.76 ng/band [6] [46] | Signal-to-Noise ratio ~10:1 |
| Precision (Repeatability) | RSD ≤ 2% [5] | RSD ≤ 2% |
| Accuracy (% Recovery) | Dependable and reliable [5] | 95-105% |
| Robustness | Dependable and reliable [5] | RSD of critical parameters < 2% |
The integration of a meticulously optimized green mobile phase, rigorous chamber saturation protocols, and efficient sample preparation forms the cornerstone of resolving band tailing and poor resolution in HPTLC-densitometry. The application of these strategies, as detailed in the provided protocols and supported by quantitative data, enables the development of a robust, reproducible, and environmentally friendly analytical method. This approach is specifically validated for the quantification of β-carotene in complex plant matrices, ensuring data reliability for researchers and drug development professionals engaged in quality control and phytopharmaceutical analysis.
Managing Matrix Interference from Lipids and Pigments in Complex Plant Extracts
The accurate analysis of bioactive compounds, such as β-carotene, in complex plant extracts presents a significant challenge for researchers and drug development professionals. The presence of endogenous matrix components, including lipids and pigments, can severely obstruct the separation and quantification of target analytes. These interferents co-elute with the substance of interest, leading to inaccurate results and compromised data integrity [49].
High-Performance Thin-Layer Chromatography coupled with densitometry (HPTLC-densitometry) has emerged as a powerful green analytical tool for overcoming these challenges. Its unique planar separation capability allows for the analysis of complex samples with minimal pretreatment, aligning with the principles of Green Analytical Chemistry (GAC) [43]. This application note details optimized protocols within a broader research thesis on developing sustainable HPTLC methods for β-carotene quantification in challenging plant matrices, with a specific focus on managing lipid and pigment interference.
The Matrix Interference Challenge in Plant Analysis
Plant matrices are chemically complex, comprising numerous compounds that can interfere with analytical procedures.
- Lipid Content: Plant tissues often contain substantial amounts of lipids and fatty acids. During extraction with non-polar solvents, these are co-extracted and can cause overlapping spots or streaks on HPTLC plates, obscuring the target β-carotene band [49].
- Pigment Overlap: Naturally occurring pigments such as chlorophylls and other carotenoids exhibit similar chemical properties and chromatographic behaviors to β-carotene. This similarity can lead to co-migration or band merging, complicating accurate quantification [43].
- Secondary Metabolites: Plants produce a wide range of structurally similar secondary metabolites. Many of these compounds may be present in low concentrations but can accumulate at the application point or along the migration path, creating a background that elevates the baseline and reduces detection sensitivity [49].
HPTLC-Densitometry as a Green Solution
HPTLC-densitometry offers distinct advantages for managing complex matrices while adhering to green chemistry principles. The technique is inherently sustainable due to its low solvent consumption (typically <10 mL per analysis), minimal sample preparation requirements, and high throughput capabilities, allowing simultaneous analysis of up to 20 samples [43] [8].
The "greenness" of the described HPTLC methods has been quantitatively evaluated using the Analytical GREEnness (AGREE) metric, scoring 0.81 on a 0-1 scale, confirming their environmental sustainability compared to conventional HPLC methods [5]. Furthermore, the compatibility of HPTLC with various multimodal detection systems including mass spectrometry (MS) and surface-enhanced Raman spectroscopy (SERS) provides orthogonal confirmation of analyte identity in complex matrices [43].
Table 1: Key Advantages of HPTLC-Densitometry for Complex Plant Matrices
| Feature | Benefit for Matrix-Rich Samples | Green Chemistry Alignment |
|---|---|---|
| Open Chromatographic System | Allows for evaporation of volatile interferents before detection | Reduced energy consumption |
| Parallel Processing | Simultaneous analysis of multiple samples and standards under identical conditions | Minimal solvent usage per sample |
| Post-Chromatographic Derivatization | Selective detection of target compounds by applying specific reagents after separation | Reduced need for hazardous derivatization agents in mobile phase |
| Image-Based Profiling | Creates a fingerprint of the entire sample for identity and purity confirmation | Non-destructive initial analysis |
Experimental Protocols
Sample Preparation and Cleanup
Objective: To extract β-carotene while minimizing co-extraction of interfering lipids and pigments.
Materials:
- Freeze-dried plant material (carrot, sweet potato)
- Solvents: Dichloromethane, hexane, acetone, ethanol (all analytical grade)
- Ultrasonic bath (frequency 20 kHz, power 100 W)
- Centrifuge
- Rotary evaporator
Procedure:
- Homogenization: Wash and dry fresh plant material. Freeze-dry and pulverize to a fine powder using a mortar and pestle or mechanical grinder. Pass through a 0.75-mm sieve [50].
- Ultrasound-Assisted Extraction: Weigh 5.0 g of powdered material into a conical flask. Add 100 mL of dichloromethane or hexane:acetone (50:50, v/v) solvent system [8] [5].
- Sonication: Sonicate the mixture for 30 minutes at room temperature [50].
- Separation: Centrifuge the extract at 5000 rpm for 20 minutes. Carefully decant the supernatant.
- Concentration: Evaporate the supernatant to dryness under reduced pressure at 40°C using a rotary evaporator.
- Reconstitution: Dissolve the dried extract in 5 mL of ethanol and filter through a 0.45 μm PTFE syringe filter.
Note: The hexane:acetone (50:50) solvent system has demonstrated superior efficiency for β-carotene extraction while reducing pigment interference compared to pure organic solvents [5].
HPTLC-Densitometry Analysis
Objective: To separate and quantify β-carotene in plant extracts with minimal interference from matrix components.
Materials and Instrumentation:
- HPTLC plates: RP-18 silica gel 60 F254S plates
- Application device: Automatic TLC Sampler 4 (e.g., CAMAG ATS4)
- Development chamber: Automated Developing Chamber 2 (ADC2)
- Densitometer: TLC Scanner 4 (e.g., CAMAG) with visionCATS software
- Mobile phase: Ethanol:cyclohexane:ammonia (95:2.5:2.5, v/v/v⁻¹) [5] or acetonitrile:water (6:4, v/v) for reversed-phase analysis [50]
Chromatographic Procedure:
- Plate Pre-washing: Pre-wash RP-18 HPTLC plates with the mobile phase to remove residual impurities. Activate at 110°C for 20 minutes.
- Sample Application: Apply standards and samples as 6 mm bands using an automatic applicator. Maintain application rate at 150 nL/s. Position bands 10 mm from the bottom and 15 mm from the side edges.
- Chromatographic Development: Develop the plate in a saturated automated developing chamber with the mobile phase. The migration distance should be 70 mm from the application point.
- Plate Drying: Dry the developed plate in a stream of warm air for 5 minutes.
- Densitometric Analysis: Scan the plate at 459 nm (λmax for β-carotene) using a deuterium lamp. Employ the scanning parameters: slit dimensions 5.00 × 0.30 mm, scanning speed 20 mm/s, data resolution 100 μm/step.
Method Validation
The HPTLC method should be validated according to ICH Q2(R1) guidelines [5]:
- Linearity: Evaluate over 25-1000 ng band⁻¹ for β-carotene [5]
- Precision: Assess intra-day and inter-day precision (% RSD < 2%)
- Accuracy: Determine via standard addition method (recovery 98-102%)
- Specificity: Confirm absence of interfering peaks at the Rf of β-carotene
- Sensitivity: Establish LOD and LOQ (e.g., LOD of 12.58 ng band⁻¹ and LOQ of 38.12 ng band⁻¹ for β-carotene in one validated method) [5]
The Scientist's Toolkit: Essential Research Reagents and Materials
Table 2: Key Research Reagent Solutions for HPTLC Analysis of β-Carotene
| Item | Function/Application | Specifications |
|---|---|---|
| RP-18 HPTLC Plates | Stationary phase for reversed-phase separation | Silica gel 60 F254S, glass-backed, 10 × 20 cm [5] |
| β-Carotene Standard | Reference standard for quantification and identification | Purity ≥ 98.7% (e.g., Sigma-Aldrich) [5] |
| Ethanol (Green Solvent) | Primary component of greener mobile phase | Chromatography grade, low toxicity [5] |
| Ultrasonic Bath | Extraction of analytes from plant matrix | Frequency 20 kHz, power 100 W [50] |
| Automatic TLC Sampler | Precise application of samples and standards | CAMAG ATS4 or equivalent [5] |
| TLC Scanner 4 | Densitometric quantification of separated bands | Equipped with deuterium lamp and visionCATS software [5] |
Results and Data Interpretation
Quantitative Analysis of β-Carotene in Plant Extracts
The validated HPTLC-densitometry method has been successfully applied to quantify β-carotene in various plant matrices. The following table summarizes representative findings:
Table 3: β-Carotene Content in Different Plant Matrices Using HPTLC-Densitometry
| Plant Material | Extraction Method | β-Carotene Content (% w/w) | Key Observation |
|---|---|---|---|
| Daucus carota (Carrot) | Traditional Extraction (TE) | 10.32% | Maximum in hexane:acetone (50:50) fraction [5] |
| Daucus carota (Carrot) | Ultrasound-Based Extraction (UBE) | 11.03% | Enhanced yield with ultrasound assistance [5] |
| Ipomea batatas (Sweet potato) | Traditional Extraction (TE) | 3.73% | Lower content compared to carrot [5] |
| Ipomea batatas (Sweet potato) | Ultrasound-Based Extraction (UBE) | 4.43% | Significant improvement with UBE [5] |
| Commercial Formulation A | Traditional Extraction (TE) | 6.73% | Consistent with label claim [5] |
Managing Matrix Effects
The optimized protocol effectively addresses matrix interference through several mechanisms:
- Selective Extraction: The hexane:acetone (50:50) solvent system provides an optimal balance between extraction efficiency and selectivity, reducing the co-extraction of polar interferents [5].
- Chromatographic Resolution: The ethanol:cyclohexane:ammonia mobile phase effectively separates β-carotene (Rf ≈ 0.65) from interfering compounds in complex plant extracts [5] [50].
- Specific Detection: Densitometric scanning at 459 nm ensures selective detection of β-carotene, with spectral confirmation possible through post-chromatographic scanning.
Visual Workflow and Signaling Pathways
The following workflow diagram illustrates the complete analytical procedure for managing matrix interference in β-carotene analysis:
Diagram 1: Complete analytical procedure for managing matrix interference
The optimized HPTLC-densitometry protocols provide an effective solution for managing matrix interference from lipids and pigments in complex plant extracts. The method successfully addresses key challenges through strategic sample preparation, optimized chromatographic conditions, and selective detection. The incorporation of green chemistry principles throughout the analytical process, from solvent selection to waste minimization, establishes this methodology as both environmentally sustainable and scientifically robust for the accurate quantification of β-carotene in challenging plant matrices.
Beta-carotene, a potent antioxidant and provitamin A carotenoid, is highly susceptible to degradation from environmental factors, compromising the accuracy and reproducibility of analytical results. Within the framework of green High-Performance Thin-Layer Chromatography (HPTLC)-densitometry research, controlling this degradation is not merely a technical necessity but a core principle for achieving sustainable and reliable science. This document provides detailed application notes and protocols to help researchers maintain β-carotene integrity from sample preparation to analysis, ensuring data quality while adhering to green chemistry principles.
β-Carotene Degradation Pathways and Control Points
The conjugated double-bond system that confers β-carotene its biological activity also renders it vulnerable to degradation via several pathways, primarily oxidation, geometric isomerization, and thermal decomposition. The following diagram illustrates these primary pathways and the corresponding protective strategies implemented at various stages of the analytical workflow.
Table 1: Efficacy of Primary Stabilization Techniques for β-Carotene
| Stabilization Technique | Specific Application in Analysis | Key Parameters & Effectiveness | Supported By |
|---|---|---|---|
| Light Protection | Use of amber glassware; low-actinic lighting in work areas; aluminum foil wrapping. | Prevents photoisomerization and bleaching; critical during sample application on HPTLC plates. | [39] [51] |
| Oxygen Exclusion | Nitrogen purging during solvent evaporation; storage under inert gas; addition of antioxidants (e.g., BHT). | Minimizes formation of epoxides and apocarotenals; BHT quenches free radical chain reactions. | [52] [39] |
| Temperature Control | Storage of standards and extracts at 4 °C or -20 °C; use of cold traps during rotary evaporation; controlled lab temperature. | Prevents thermal isomerization of all-trans to cis forms; storage at 4°C is standard for nano-formulations. | [7] [52] |
| Green Solvent Selection | Use of ethanol, ethyl acetate, or acetone in extraction and chromatography instead of more toxic chlorinated solvents. | Ethyl acetate successfully used for sample prep; ethanol-cyclohexane mobile phases are effective and greener. | [5] [39] |
| Encapsulation | Formulating extracts into nanovesicles using phospholipids (e.g., thin film hydration method). | Increases solubility and provides a physical barrier against degradation; entrapment efficiency up to 78.6%. | [7] [52] |
Table 2: Impact of Degradation on Analytical Performance in HPTLC
| Analytical Parameter | Impact of Uncontrolled Degradation | Benefit of Implementing Controls |
|---|---|---|
| Linearity (R²) | Poor linearity due to inconsistent analyte concentration. | Excellent linearity (R² = 0.9935) achieved over 100-500 ng/band [7]. |
| Detection Limit (LOD) | Higher baseline noise from degradation products. | Low LOD demonstrated (e.g., 10.15 - 22.05 ng/band) [7] [41]. |
| Accuracy/Recovery | Lower recoveries due to analyte loss before detection. | Recovery rates within 97.5-102.1% are achievable with proper handling [53]. |
| Precision (RSD) | High relative standard deviation from variable degradation. | Precise results with %RSD for intra-day and inter-day precision below 10% [7] [41]. |
| Peak Purity | Multiple peaks or shoulders from degradants, complicating densitometry. | Sharp, well-resolved bands for accurate quantification [51]. |
Detailed Experimental Protocols
Protocol for Stabilized Sample Preparation from Plant Material
This protocol is optimized for the extraction of β-carotene from plant matrices like carrots (Daucus carota) or sweet potatoes (Ipomea batatas) while minimizing degradation.
Research Reagent Solutions & Essential Materials
- Antioxidant Solution (0.1% BHT): Dissolve 10 mg of Butylated Hydroxytoluene (BHT) in 10 mL of HPLC-grade acetone or hexane. Function: Added to all extraction solvents to inhibit radical-mediated oxidation [39].
- Nitrogen Gas Supply: High-purity (≥99.9%) nitrogen gas with regulator. Function: Used to create an inert atmosphere over samples and to concentrate extracts without heating.
- Extraction Solvent (Hexane:Acetone 50:50, v/v): Mix equal volumes of n-hexane and acetone, containing 0.1% BHT. Function: Efficiently extracts carotenoids from plant tissues; the acetone content helps penetrate cellular water [5].
- Amber Glassware: Volumetric flasks, vials, and storage containers. Function: Blocks photodegrading wavelengths of light.
- HPTLC Plates: Pre-coated silica gel 60 F254. Function: The stationary phase for separation.
Step-by-Step Procedure:
- Homogenization: Rapidly homogenize 1.0 g of fresh plant material with 10 mL of extraction solvent (Hexane:Acetone 50:50 with 0.1% BHT) using a probe homogenizer. Perform this step in a dimly lit lab.
- Centrifugation: Centrifuge the homogenate at 5000 × g for 10 minutes at 4°C to pellet solid debris.
- Partitioning: Transfer the supernatant to a separatory funnel. Add 10 mL of saturated NaCl solution and shake gently. Allow phases to separate completely.
- Collection: Collect the upper organic layer (containing β-carotene) into a round-bottom flask.
- Solvent Evaporation: Concentrate the extract at room temperature using a rotary evaporator equipped with a cold trap. The water bath temperature must not exceed 30°C. Continuously introduce a gentle stream of nitrogen gas into the flask during evaporation.
- Reconstitution and Storage: Immediately reconstitute the dried extract in 1.0 mL of ethyl acetate. Transfer the solution to an amber glass vial, cap tightly, flush the headspace with nitrogen for 30 seconds, and store at -20°C until HPTLC analysis. Analyze within 24 hours.
Protocol for Green HPTLC-Densitometry Analysis
This method utilizes a greener mobile phase to minimize environmental impact and analyst exposure to toxic solvents.
Research Reagent Solutions & Essential Materials
- Greener Mobile Phase: Ethanol-Cyclohexane-Ammonia (95:2.5:2.5, v/v/v). Function: Effectively separates β-carotene with a high AGREE greenness score (0.81), replacing more toxic solvents like petroleum ether or chloroform [5].
- β-Carotene Standard Stock Solution (100 µg/mL): Accurately weigh 1.0 mg of high-purity β-carotene standard and dissolve in 10 mL of ethyl acetate. Prepare fresh weekly and store under nitrogen at -20°C.
- HPTLC Plates: RP-18 F254s plates for reversed-phase analysis. Function: The stationary phase for separation.
Step-by-Step Procedure:
- Sample Application: In a low-light environment, apply standard and sample extracts as 6 mm bands on the HPTLC plate using an automatic sampler (e.g., CAMAG ATS4). A typical calibration range is 100-500 ng/band.
- Chromatographic Development: Develop the plate in a twin-trough glass chamber pre-saturated with the mobile phase for 20 minutes. The development distance is 70 mm at room temperature.
- Densitometric Scanning: After development, dry the plate at room temperature in a stream of nitrogen. Scan the plate immediately using a TLC scanner in absorbance mode at 450-459 nm [5] [39].
- Data Analysis: Identify β-carotene by comparing the Rf value (approximately 0.27 in normal-phase [41]) with the standard. Quantify by constructing a calibration curve from the standard bands.
The following workflow summarizes the integrated analytical process, from sample to result, highlighting the critical control points for preserving β-carotene integrity.
The reliability of quantitative analysis of β-carotene, particularly using green HPTLC-densitometry, is fundamentally dependent on rigorous control of light, oxygen, and temperature throughout the analytical workflow. By implementing the detailed protocols and strategies outlined in this document—such as the use of amber glassware, nitrogen purging, BHT, temperature-controlled processes, and greener solvents—researchers can significantly reduce analyte degradation. This leads to more accurate, precise, and environmentally sustainable analytical outcomes, advancing the field of green analytical chemistry for carotenoid research.
Optimizing Band Application and Chromatographic Development for Reproducibility
In the realm of green high-performance thin-layer chromatography (HPTLC)-densitometry, the analysis of beta-carotene in plant extracts represents a significant application area that demands high reproducibility for reliable quantification. The reproducibility of HPTLC data is not automatic; it must be carefully engineered through controlled methodology [54]. As practiced in many laboratories, HPTLC has often been limited to comparative analysis run on the same plate due to challenges with inter-plate and inter-day reproducibility [54] [55]. However, when key variables affecting band application and chromatographic development are optimized and standardized, HPTLC transforms into a powerful investigative tool capable of generating data that can be reliably archived, shared, and compared across different plates, instruments, and time [54]. This technical note provides detailed protocols for optimizing these critical parameters, with specific application to the analysis of beta-carotene in plant extracts using greener solvent systems.
The fundamental advantage of a reproducible HPTLC method lies in its ability to support not just comparative analysis but true identification through database matching [54] [2]. Furthermore, reproducible methods enhance the reliability of quantitative determinations, which is crucial for standardizing plant extracts and commercial formulations containing beta-carotene [5] [6]. By implementing the optimized protocols described herein, researchers can achieve the precision necessary for robust quantitative analysis while maintaining alignment with green analytical chemistry principles through reduced solvent consumption and minimized environmental impact [5] [2].
Critical Parameters for Reproducibility
Key Variables and Their Impact
Through systematic investigation of a six-component test dye mixture developed on over 50 HPTLC plates, several critical variables have been identified as having the most significant impact on reproducibility and resolution [54] [55]. When properly controlled, these parameters enable the acquisition of repeatable data from both casework and reference samples collected on different plates and at different times [54]. The empirical uncertainty established for a generalized separation procedure provides objective guidance for evaluating the significance of associations or eliminations made based on retardation factor (Rf) values [54].
Table 1: Critical Parameters Affecting HPTLC Reproducibility
| Parameter | Impact on Reproducibility | Optimal Practice |
|---|---|---|
| Plate Selection | Influences separation efficiency and migration uniformity [54] | HPTLC plates with finer, more uniform particle size (~5-6 μm) provide better resolution than standard TLC plates [1] |
| Pre-elution | Removes impurities that can cause variable background and migration [54] | Pre-elute plates with mobile phase or methanol, then reactivate by drying [54] |
| Tank Saturation | Affects vapor phase equilibrium, critical for multi-component eluents [54] | Saturate chamber with mobile phase vapor for 20-30 minutes before development [54] [56] |
| Developing Distance | Influences resolution and Rf values; uncertainty not uniform across plate [54] | Standardize distance (typically 60-80 mm); shorter distances often improve reproducibility [54] |
| Eluent Stability | Impacts separation profile over time [54] | Use freshly prepared eluents; document shelf-life for multi-component mixtures [54] |
| Band Application | Affects separation efficiency and quantitative accuracy [5] [6] | Use automatic applicator; consistent band width (4-6 mm) and application rate (150 nL/s) [5] [56] |
Quantitative Reproducibility Assessment
The reproducibility of an optimized HPTLC method can be quantitatively assessed through validation parameters. For beta-carotene analysis specifically, methods have been validated showing excellent linearity in the range of 25-1000 ng/band [5] or 100-500 ng/band [6], with high precision demonstrated by relative standard deviation (RSD) values.
Table 2: Validation Parameters for Reproducible Beta-Carotene HPTLC Analysis
| Validation Parameter | Performance Criteria | Reported Values for Beta-Carotene |
|---|---|---|
| Linearity Range | Wide dynamic range with consistent response [57] | 25-1000 ng/band [5] or 100-500 ng/band [6] |
| Precision (RSD) | Consistent results across multiple runs [57] | Intra-day: 2.03% RSD; Inter-day: 2.14% RSD [6] |
| Limit of Detection (LOD) | Lowest detectable amount [57] | 10.15 ng/mL [6] |
| Limit of Quantification (LOQ) | Lowest quantifiable amount with accuracy [57] | 30.76 ng/mL [6] |
| Robustness | Resistance to minor method variations [57] | Maintains performance with small changes in mobile phase composition or development conditions [5] |
Experimental Protocols
Optimized Band Application Protocol
Principle: Precise sample application as narrow, uniform bands is critical for achieving high-resolution separation and reproducible Rf values [54] [5]. This protocol is optimized for beta-carotene analysis in plant extracts.
Materials:
- HPTLC plates pre-coated with RP silica gel 60 F254S [5] [6]
- CAMAG Automatic TLC Sampler 4 (ATS4) Sample Applicator or equivalent [5] [56]
- CAMAG microliter syringe (Hamilton) [5] [56]
- Beta-carotene standard solutions (25-1000 ng/μL) in appropriate solvent [5]
- Plant extract samples prepared in hexane:acetone (50:50) or similar [5]
Procedure:
- Plate Preparation: Pre-clean RP silica gel 60 F254S HPTLC plates by pre-elution with methanol or mobile phase if necessary. Activate by drying at 60°C for 5-10 minutes if needed [54].
- Application Pattern: Plan application pattern with minimum 10 mm from left and right edges, and 15 mm from bottom edge. Include standard bands interspersed with samples for accurate Rf calculation [54].
- Application Parameters: Set applicator to deliver samples as 6 mm bands with application rate of 150 nL/s [5] [56]. Maintain constant application distance of 1.0 mm from plate surface.
- Sample Volume: Apply appropriate volumes to achieve 100-500 ng/band of beta-carotene for quantification [6]. For screening, wider ranges (25-1000 ng/band) may be applied [5].
- Drying: Dry applied bands completely under inert gas stream or in vacuum desiccator for 2-5 minutes before development.
Troubleshooting:
- Irregular band shapes: Check syringe for obstructions; ensure consistent application rate.
- Peak tailing: Reduce sample load or increase band drying time.
- Inconsistent migration: Ensure uniform band application distance across all samples.
Optimized Chromatographic Development Protocol
Principle: Controlled development conditions are essential for reproducible Rf values and separation profiles [54]. This protocol utilizes greener solvent systems appropriate for beta-carotene analysis.
Materials:
- CAMAG automated developing chamber 2 (ADC2) or equivalent [5] [56]
- Greener mobile phase: n-hexane:ethyl acetate (6:4, v/v) [6] or ethanol:cyclohexane:ammonia (95:2.5:2.5, v/v/v) [5]
- Chamber saturation materials (filter paper liners)
- Timer
Procedure:
- Mobile Phase Preparation: Prepare mobile phase fresh daily using measured volumes. For beta-carotene, n-hexane:ethyl acetate (6:4, v/v) has been successfully employed [6]. For greener alternatives, ethanol-based systems may be used [5].
- Chamber Saturation: Line development chamber with filter paper saturated with mobile phase. Add sufficient mobile phase to saturate chamber (typically 10-20 mL for standard chambers). Allow equilibrium for 20-30 minutes at room temperature (22±2°C) [54] [56].
- Plate Development: Place prepared HPTLC plate in saturated chamber. Develop over standardized distance of 70-80 mm under linear ascending mode [5] [56].
- Development Time: Record development time consistently; typically 10-15 minutes for 80 mm development [2].
- Plate Drying: Remove plate from chamber immediately upon reaching development distance. Dry completely in vacuum desiccator or under inert gas stream for 2-5 minutes before detection.
Troubleshooting:
- Edge effects: Ensure proper chamber saturation and uniform mobile phase migration.
- Streaking: Check sample purity; consider sample clean-up or adjust mobile phase composition.
- Inconsistent Rf values: Verify chamber saturation time; ensure consistent development distance.
Densitometric Analysis Protocol for Beta-Carotene
Principle: Quantitative analysis of beta-carotene using densitometry provides accurate quantification when properly calibrated [5] [6].
Materials:
- HPTLC Densitometer (e.g., CAMAG TLC Scanner) [5] [56]
- WinCATS software or equivalent
- UV/Vis spectrophotometer for wavelength selection
Procedure:
- Wavelength Selection: Scan beta-carotene standard at 459 nm for maximum absorbance [5]. Confirm optimal wavelength by scanning spectrum from 300-500 nm.
- Scanner Settings: Set slit dimensions to 4.00 × 0.45 mm (width × height); scanning speed of 20 mm/s [56].
- Calibration Curve: Apply beta-carotene standards in range of 100-500 ng/band [6] or 25-1000 ng/band [5]. Include minimum of six concentration levels with triplicate applications.
- Sample Scanning: Scan sample bands using identical parameters as standards.
- Quantification: Calculate beta-carotene content in samples using linear or polynomial regression from calibration curve.
Validation:
- Linearity: r² ≥ 0.995 for calibration curve [6]
- Precision: RSD ≤ 2.5% for intra-day and inter-day analysis [6]
- Accuracy: Recovery of 95-105% for spiked samples [57]
Research Reagent Solutions
Table 3: Essential Materials for Reproducible HPTLC of Beta-Carotene
| Reagent/Material | Function | Specifications for Optimal Performance |
|---|---|---|
| RP Silica Gel 60 F254S HPTLC Plates | Stationary phase for reverse-phase separation [5] [56] | Pre-coated glass plates (10 × 20 cm); particle size ~5-6 μm; F254 indicator for UV detection [5] |
| Beta-Carotene Standard | Quantification reference [5] [6] | High purity (≥98.7%); store in dark at -20°C; prepare fresh solutions in appropriate solvent [5] |
| n-Hexane:Ethyl Acetate (6:4, v/v) | Mobile phase for normal-phase separation [6] | HPLC grade; prepare fresh daily; allows Rf ~0.27 for beta-carotene [6] |
| Ethanol:Cyclohexane:Ammonia (95:2.5:2.5, v/v/v) | Greener alternative mobile phase [5] | Ethanol and cyclohexane of chromatography grade; allows separation with reduced toxicity [5] |
| Ultrasound-Assisted Extraction Solvents | Plant sample preparation [5] | Hexane:acetone (50:50) for efficient beta-carotene extraction from plant materials [5] |
Workflow Integration and Green Assessment
The optimization of band application and chromatographic development must be integrated within a comprehensive workflow that encompasses sample preparation, detection, and data analysis. A reproducible HPTLC method for beta-carotene analysis incorporates both the technical parameters discussed and alignment with green chemistry principles.
The workflow culminates in a greenness assessment using metrics such as the Analytical GREEnness (AGREE) method, which evaluates all twelve principles of green analytical chemistry [5] [56]. Optimized HPTLC methods for beta-carotene have demonstrated high greenness scores of 0.81 [5] to 0.88 [56] on a 0-1 scale, confirming their environmental sustainability alongside analytical performance.
Reproducible HPTLC analysis of beta-carotene in plant extracts is achievable through meticulous optimization of band application and chromatographic development parameters. By standardizing plate selection, pre-elution practices, tank saturation, developing distance, and eluent stability, researchers can generate reliable, reproducible data suitable for both comparative analysis and database development [54]. The protocols detailed herein provide a pathway for implementing these optimized conditions specifically for beta-carotene analysis while maintaining alignment with green chemistry principles through reduced solvent consumption and minimized environmental impact [5] [2]. When properly validated for accuracy, precision, specificity, and robustness [57], the resulting HPTLC methods serve as powerful tools for the standardization of plant extracts and commercial formulations containing this important phytochemical.
Within the broader context of research into green HPTLC-densitometry for β-carotene in plant extracts, there is a growing need for accessible, cost-effective, and rapid analytical techniques [5] [8]. Traditional methods, such as High-Performance Liquid Chromatography (HPLC) and conventional HPTLC-densitometry, while highly accurate and sensitive, require sophisticated instrumentation, are often time-consuming, and involve higher operational costs [8]. This application note details alternative protocols using smartphone imaging coupled with ImageJ analysis for the semi-quantification of β-carotene. These methods offer a complementary approach, particularly valuable for rapid screening and in resource-limited settings, aligning with the principles of green analytical chemistry by potentially reducing solvent and energy consumption [5] [8].
Research Reagent Solutions
The table below lists essential materials and reagents commonly used in the HPTLC analysis of β-carotene, which form the basis for the sample preparation in the alternative protocols described.
Table 1: Key Reagents and Materials for Beta-Carotene Analysis
| Item | Function/Description | Example from Literature |
|---|---|---|
| β-Carotene Standard | Reference compound for calibration and identification [39]. | Sigma-Aldrich (C9750) [39]. |
| Silica Gel HPTLC Plates | Stationary phase for the separation of compounds [5]. | RP silica gel 60 F254S plates (E-Merck) [5]. |
| Mobile Phase Solvents | Liquid phase to carry samples across the stationary phase for separation. | Ethanol:cyclohexane:ammonia (95:2.5:2.5 v/v/v) [5].Toluene:acetone (7:3 v/v) [7]. |
| Extraction Solvents | To isolate β-carotene from plant matricescitation:1]. | Dichloromethane [8], hexane:acetone (50:50) [5], ethyl acetate [39]. |
| Ultrasound Bath | To enhance extraction efficiency (Ultrasound-Based Extraction - UBE) [5]. | For UBE extraction [5]. |
Established HPTLC-Densitometry Protocol
For context and comparison, a standard validated HPTLC-densitometry method is summarized below. This method serves as the benchmark against which the alternative methods are developed.
Table 2: Validated HPTLC-Densitometry Method for Beta-Carotene
| Parameter | Specification |
|---|---|
| Stationary Phase | TLC Aluminiumoxid 60 F254 neutral plates [39] or RP silica gel 60 F254S [5]. |
| Mobile Phase | Chloroform/methanol/acetone/ammonium hydroxide (10:22:53:0.2 v/v/v/v) [39]. |
| Detection Wavelength | 450 nm [39] or 459 nm [5]. |
| Linear Range | 100–500 ng/band [7] or 25–1000 ng/band [5]. |
| Limit of Detection (LOD) | 22.05 ng/band [7]. |
| Limit of Quantification (LOQ) | 66.82 ng/band [7]. |
| Sample Application | 6 mm bands via automated sample applicator [5]. |
Detailed Experimental Workflow
The following diagram illustrates the core steps involved in a standard HPTLC-densitometry workflow for β-carotene analysis.
Procedure:
- Standard Solution Preparation: Accurately weigh 10 mg of β-carotene standard and dissolve in ethyl acetate in a 5 mL volumetric flask to obtain a 0.2% (w/v) stock solution [39].
- Sample Preparation (Plant Extract):
- Ultrasound-Based Extraction (UBE): Homogenize plant material (e.g., carrot, sweet potato). Weigh a sample and extract with a suitable solvent like hexane:acetone (50:50) using an ultrasound bath. Filter the extract [5].
- Traditional Extraction (TE): Macerate the plant material with the same solvent system without ultrasonic assistance [5].
- Sample Preparation (Commercial Formulations): For capsules or tablets, powder the contents. Accurately weigh powder equivalent to 5 mg β-carotene and extract with ethyl acetate by shaking for 10 minutes. Make up to volume and filter (0.45 μm) [39].
- Application: Apply standard and sample solutions as 6 mm bands on the HPTLC plate using an automated applicator (e.g., CAMAG ATS4). An application rate of 150 nL/s is suitable [5].
- Chromatographic Development: Develop the plate in a twin-trough glass chamber previously saturated with the mobile phase (e.g., chloroform/methanol/acetone/ammonium hydroxide 10:22:53:0.2 v/v/v/v). Allow the mobile phase to migrate an appropriate distance (e.g., 80 mm) [39].
- Scanning & Quantification: Scan the developed plate with a TLC scanner in absorbance mode at 450 nm [39]. Generate a calibration curve by plotting peak area against the concentration of the standard and calculate the β-carotene content in unknown samples.
Smartphone-Assisted Semi-Quantification Protocol
This protocol leverages a smartphone camera and dedicated software for semi-quantitative analysis, eliminating the need for an expensive densitometer.
Workflow for Smartphone-Assisted Analysis
The process for smartphone-based analysis builds upon the standard HPTLC method but uses different detection and quantification steps.
Procedure:
- HPTLC Separation: Perform steps 1-5 of the established HPTLC protocol (Section 3.1) to obtain a developed HPTLC plate with separated β-carotene bands (RF ~0.3-0.4 for alumina plates with chloroform-based mobile phase [39]).
- Image Acquisition:
- Place the developed HPTLC plate in a lightbox or a standardized imaging setup with consistent, diffuse white light illumination to eliminate shadows and glare.
- Mount the smartphone stably using a stand. Ensure the camera lens is parallel to the plate surface.
- Use the rear camera of the smartphone at the highest resolution. Set the focus and exposure manually. Capture the image in a lossless format (e.g., PNG) if possible. Important: Include a scale bar or a reference object in the frame.
- Image Analysis with VisionCats Software:
- Transfer the image to a computer with installed VisionCats software (CAMAG).
- The software utilizes the absorption of the separated β-carotene zones to generate image profiles [8].
- It calculates luminance from the detected RGB values for each pixel line, plotting it as a function of the RF value to generate a Peak Profile from the Image (PPI) [8].
- The PPI data contains information on peak height and area, which can be used for semi-quantitative assessments by comparing the PPI data of the samples with known concentrations of the β-carotene standard [8].
ImageJ Analysis Protocol
For laboratories without access to specialized TLC software, the public-domain image analysis program ImageJ provides a robust alternative for semi-quantification.
Workflow for ImageJ Analysis
The ImageJ analysis process involves specific steps within the software to convert image data into quantitative measurements.
Procedure:
- Image Acquisition: Follow step 2 of the smartphone-assisted protocol (Section 4.1) to obtain a high-quality image of the developed HPTLC plate.
- Image Import and Calibration:
- Open the image in ImageJ (
File > Open). - Calibrate the spatial scale using the scale bar or reference object in the image (
Analyze > Set Scale).
- Open the image in ImageJ (
- Conversion to Grayscale: Convert the color image to 8-bit grayscale (
Image > Type > 8-bit). This step simplifies analysis by reducing the image to a single intensity channel. - Lane and Band Definition:
- Using the rectangular selection tool, define a lane for the first standard band. The lane should encompass the entire height and width of the band.
- Generate a lane profile plot (
Analyze > Plot Profile). A distinct peak will correspond to the β-carotene band.
- Pero Area Measurement:
- Use the "Wand" (tracing) tool to automatically outline the peak area on the profile plot. Alternatively, manually select the area using the straight-line selection tool to define the baseline and the freehand tool to select the peak.
- Measure the selected area (
Analyze > Measure). ImageJ will report the area in arbitrary "pixel intensity" units. - Repeat this process for all standard and sample bands on the HPTLC plate.
- Quantification:
- In a spreadsheet, record the measured areas against the known concentrations of the β-carotene standard bands.
- Generate a calibration curve (area vs. concentration) and determine the regression equation.
- Use this equation to calculate the β-carotene concentration in the sample bands based on their measured areas.
Comparison of Quantitative Performance
The table below summarizes key performance metrics of the established HPTLC method and the expected outcomes from the alternative techniques.
Table 3: Comparison of Analytical Methods for Beta-Carotene Quantification
| Parameter | HPTLC-Densitometry | Smartphone (VisionCats) | ImageJ Analysis |
|---|---|---|---|
| Principle | Absorbance measurement at 450-459 nm [5] [39] | Luminance from RGB values (PPI) [8] | Pixel intensity measurement |
| Linear Range | 25–1000 ng/band [5] | To be established empirically | To be established empirically |
| LOD/LOQ | LOD: 22.05 ng/band [7] | Higher than densitometry [8] | Higher than densitometry |
| Precision (RSD) | Meets ICH guidelines (<2%) [7] | Good precision reported [8] | Subject to user operation |
| Key Instrument | TLC Scanner (~$50,000) | Smartphone & Lightbox (~$1,000) | Smartphone & PC (Free Software) |
| Primary Use | Official QC, quantitative analysis [5] [39] | Rapid screening, semi-quantification [8] | Research, semi-quantification |
| Greenness (AGREE) | Score: 0.81 [5] | Potentially higher | Potentially higher |
Troubleshooting and Best Practices
- Poor Image Quality: Ensure consistent and diffuse lighting. Avoid shadows and reflections. Use a smartphone stand to prevent motion blur.
- Non-Linear Calibration: Prepare standard solutions across an appropriate concentration range. Overly concentrated bands can saturate the image sensor, leading to a loss of linearity.
- Inconsistent Background Subtraction: In ImageJ, carefully define the baseline for each peak. For VisionCats, use the software's built-in background correction features [8].
- Color Accessibility: When creating charts or graphs from the resulting data, use color-blind friendly palettes (e.g., blue/orange schemes) and avoid red-green combinations to ensure accessibility for all researchers [58] [59] [60].
Smartphone-assisted quantification and ImageJ analysis present viable, innovative alternatives to traditional HPTLC-densitometry for the semi-quantitative analysis of β-carotene. While these methods may not yet match the precision, sensitivity, and validation status of official pharmacopeial methods [39] [7], they offer significant advantages in terms of cost, accessibility, and speed [8]. They are perfectly suited for rapid screening of plant extracts, educational purposes, and in settings where access to high-end instrumentation is limited. By integrating these accessible technologies, researchers can effectively support the broader goals of green analytical chemistry in the field of phytopharmaceutical analysis [5].
Method Validation, Comparative Analysis, and Regulatory Compliance
Within the framework of a broader thesis on green HPTLC-densitometry for the analysis of β-carotene in plant extracts, the rigorous validation of the analytical method is paramount. This document outlines a comprehensive validation protocol, as per the International Council for Harmonisation (ICH) Q2(R1) guideline, for a greener Reverse-Phase High-Performance Thin-Layer Chromatography (RP-HPTLC) method [5]. The objective is to provide researchers, scientists, and drug development professionals with detailed application notes and protocols to ensure the method is linear, sensitive, precise, and accurate for the quantification of β-carotene in complex plant matrices. The validation strategy is specifically contextualized for the analysis of β-carotene in extracts from sources such as Daucus carota (carrot) and Ipomea batatas (sweet potato), emphasizing environmentally benign solvents [5] [6].
Experimental Design and Workflow
The following diagram illustrates the logical sequence and key components of the analytical method validation process as per ICH Q2(R1).
Core Validation Parameters: Protocols and Data
This section provides the detailed experimental protocols and summarizes the corresponding quantitative data for each critical validation parameter.
Linearity
Experimental Protocol:
- Standard Stock Solution: Prepare a primary stock solution of β-carotene standard (purity ≥98.7%) in an appropriate solvent such as chloroform or a mixture of dimethyl sulfoxide (DMSO) and methanol [5] [61].
- Serial Dilutions: From the stock solution, perform serial dilutions using the green mobile phase (e.g., ethanol:water or ethanol:cyclohexane:ammonia) to obtain at least five different concentration levels [62]. For β-carotene analysis, a range of 25–1000 ng/band or 100–500 ng/band has been successfully employed [5] [6].
- Application and Development: Apply each concentration in triplicate as 6 mm bands on the RP-18 F254S HPTLC plates using an automated sample applicator (e.g., CAMAG ATS4) with a constant application rate of 150 nL/s [5] [63]. Develop the plates in a pre-saturated chamber with the mobile phase.
- Detection and Calibration: After development, scan the plates at the λmax for β-carotene (e.g., 459 nm) in densitometry mode [5]. Plot the mean peak area against the corresponding applied concentration (ng/band). Perform linear regression analysis to obtain the calibration equation and the coefficient of determination (R²).
Table 1: Linearity Data for β-Carotene from Literature
| Plant Extract / Matrix | Linear Range (ng/band) | Calibration Equation | Coefficient of Determination (R²) | Citation |
|---|---|---|---|---|
| Daucus carota & Ipomea batatas | 25 - 1000 | Not Specified | Not Specified | [5] |
| Gymnosporia senegalensis | 100 - 500 | Not Specified | 0.96450 | [6] |
| Rivaroxaban (Model Compound) | 50 - 600 | Y = 13.28x + 1189.4 | 0.9994 | [61] |
Limit of Detection (LOD) and Limit of Quantification (LOQ)
Experimental Protocol: The LOD and LOQ can be determined based on the standard deviation of the response and the slope of the calibration curve, as recommended by ICH [64] [62].
- Calibration Data: Use the data generated from the linearity study. Perform a linear regression analysis, which provides the slope (S) of the calibration curve and the standard error (σ) of the y-intercept residuals.
- Calculation: Apply the ICH formulas:
- Validation: The calculated LOD and LOQ values must be validated experimentally by analyzing a suitable number of samples (e.g., n=6) at these concentrations. The peaks at LOD should be detectable with a signal-to-noise (S/N) ratio of about 3:1, and the peaks at LOQ should be quantifiable with an S/N ratio of about 10:1 and acceptable precision (e.g., %RSD ≤ 15%) [64].
Table 2: Sensitivity Data (LOD and LOQ) for HPTLC Methods
| Analyte | Matrix | LOD | LOQ | Citation |
|---|---|---|---|---|
| β-Carotene | Gymnosporia senegalensis | 10.15 ng/mL | 30.76 ng/mL | [6] |
| Rivaroxaban | Nanoparticles & Tablets | 18.45 ng/spot | 55.35 ng/spot | [61] |
| Apremilast | Nanoformulations & Tablets | Derived from calibration curve | Derived from calibration curve | [65] |
Precision
Precision is validated at two levels: repeatability (intra-day precision) and intermediate precision (inter-day, inter-analyst, inter-equipment) [66] [62].
Experimental Protocol:
- Repeatability: Prepare a minimum of six sample solutions at 100% of the test concentration (e.g., a mid-level point from the linearity range). Analyze all samples on the same day, by the same analyst, using the same instrument. Calculate the % Relative Standard Deviation (%RSD) of the peak areas or the calculated concentrations.
- Intermediate Precision: To assess the impact of random variations within the same laboratory, perform the analysis on different days (inter-day), with different analysts, or using different HPTLC instruments. A robust experimental design involves two analysts each preparing and analyzing replicate sample preparations (e.g., three concentrations, three repetitions each) on different days [62]. The results are typically reported as %RSD for each set, and the % difference in mean values between the two analysts or days should be within pre-defined acceptance criteria.
Table 3: Precision Acceptance Criteria and Example Data
| Precision Level | Experimental Procedure | Acceptance Criteria (Example) | Reported Data for Rivaroxaban | Citation |
|---|---|---|---|---|
| Repeatability (Intra-day) | Analyze 6 replicates at 100% test conc. in one day. | %RSD ≤ 2% | 0.46 - 0.64 %RSD | [61] |
| Intermediate Precision (Inter-day) | Analyze 3 conc. levels in triplicate on different days/analysts. | %RSD ≤ 3% | 0.48 - 0.86 %RSD | [61] |
Accuracy
Accuracy is determined by a spike recovery study, which evaluates the closeness of agreement between the accepted reference value and the value found [62].
Experimental Protocol:
- Sample Preparation: Use a pre-analyzed plant extract sample (e.g., from D. carota) with a known content of β-carotene.
- Spiking: Spike this sample with known amounts of the pure β-carotene standard at three different concentration levels (e.g., 80%, 100%, and 120% of the target level). Each level should be prepared and analyzed in triplicate.
- Analysis and Calculation: Analyze the spiked samples using the validated HPTLC method. The recovery percentage is calculated as:
- % Recovery = (Found Concentration - Initial Concentration) / Spiked Concentration × 100%
- The mean recovery at each level should be within the acceptable range (e.g., 98-102%) [62]. For the analysis of β-carotene in D. carota and related extracts, recovery studies have demonstrated the method's accuracy, though specific percentage values were not provided in the search results [5]. For other compounds like rivaroxaban, recoveries of 97.97–99.67% have been achieved [61].
The Scientist's Toolkit: Research Reagent Solutions
Table 4: Essential Materials and Reagents for Green HPTLC-Densitometry of β-Carotene
| Item | Function / Role | Green & Safety Considerations |
|---|---|---|
| RP-18 Silica gel 60 F254S HPTLC Plates | Stationary phase for reversed-phase separation. | - |
| β-Carotene Standard (≥98.7%) | Primary reference standard for calibration and identification. | - |
| Ethanol | Green solvent component of the mobile phase. | Biodegradable, low toxicity, preferred in green chemistry [5] [65] [63]. |
| Water | Green solvent component of the mobile phase. | Non-toxic, safe [65] [63] [61]. |
| Cyclohexane | Component of the ternary mobile phase for β-carotene [5]. | Requires appropriate handling and waste disposal. |
| Ammonia | Mobile phase modifier to improve separation [5]. | Requires appropriate handling and waste disposal. |
| CAMAG HPTLC System (e.g., ATS4, ADC2, Scanner) | Instrumentation for automated application, development, and densitometric scanning. | - |
| WinCATS Software | Data acquisition and processing for densitometric analysis. | - |
This application note provides a detailed protocol for the comprehensive validation of a green HPTLC-densitometry method for β-carotene quantification in plant extracts, strictly adhering to the ICH Q2(R1) guideline. By following the established workflows for linearity, LOD, LOQ, precision, and accuracy, researchers can ensure their analytical methods generate reliable and trustworthy data. The integration of greener solvents, such as ethanol-water mixtures, aligns with the principles of sustainable chemistry without compromising the analytical performance, making it a responsible choice for modern pharmaceutical and agricultural research.
Robustness is defined as the capacity of an analytical procedure to remain unaffected by small, deliberate variations in method parameters and provides an indication of its reliability during normal usage [67] [68]. Within the context of a broader thesis on green High-Performance Thin-Layer Chromatography (HPTLC)-densitometry for β-carotene in plant extracts, establishing method robustness is crucial for ensuring reliable transfer between laboratories and consistent results under varied operational conditions.
For HPTLC methods, robustness testing evaluates the influence of minor changes in critical parameters on analytical responses such as retardation factor (Rf values), spot characteristics, and quantitative determination. This validation parameter proves particularly valuable for green analytical methods, where alternative, environmentally friendly solvents and simplified procedures must demonstrate performance parity with conventional approaches [5].
Experimental Design for Robustness Testing
Critical Parameter Selection and Level Definition
The first step in robustness testing involves identifying factors potentially influencing method performance. For HPTLC-densitometry of β-carotene, both procedural and environmental parameters should be considered. The selected factors and their variation intervals should represent realistic variations expected during method transfer between laboratories or different operational conditions [67] [68].
Table 1: Factors and Levels for Robustness Testing of Green HPTLC-Densitometry for β-Carotene
| Factor | Unit | Low Level (-1) | Nominal Level (0) | High Level (+1) |
|---|---|---|---|---|
| Mobile Phase Composition | % v/v | -2% of nominal | As per method | +2% of nominal |
| Saturation Time | minutes | -5 min | 20 min | +5 min |
| Development Distance | mm | -5 mm | 70 mm | +5 mm |
| Spotting Position | mm | -1 mm | Standard | +1 mm |
| Time from Chromatography to Scanning | hours | 0.5 h | 1 h | 2 h |
| Activation Temperature of HPTLC Plate | °C | 50°C | 60°C | 70°C |
| Detection Wavelength | nm | -2 nm | 459 nm | +2 nm |
For the green HPTLC method utilizing ethanol, cyclohexane, and ammonia (95:2.5:2.5, v/v/v), the mobile phase composition represents a critical mixture-related factor [5]. When examining mixture-related factors in a robustness test, only p-1 components can be independently varied in experimental designs [68].
Experimental Design Selection
A Plackett-Burman screening design is recommended for robustness testing as it allows efficient examination of multiple factors with a minimal number of experiments [68]. For the seven factors identified in Table 1, a 12-experiment Plackett-Burman design is appropriate, allowing estimation of the seven main effects with additional degrees of freedom for statistical interpretation.
The experimental sequence should follow an anti-drift arrangement or be randomized to minimize the effects of uncontrolled variables such as ambient temperature and humidity fluctuations. When practical constraints prevent complete randomization (e.g., when changing columns represents a factor), experiments should be blocked by the difficult-to-change factor [68].
Application to Green HPTLC-Densitometry for β-Carotene
Analytical Procedure
The green HPTLC method for β-carotene quantification employs pre-coated RP silica gel 60 F254S plates with a ternary mobile phase of ethanol, cyclohexane, and ammonia (95:2.5:2.5, v/v/v) [5]. Sample application occurs as 6 mm bands using an automatic sample applicator, with development in a twin-trough chamber previously saturated with mobile phase vapor. Detection proceeds densitometrically at 459 nm [5].
System Suitability Parameters
System suitability parameters must be established prior to robustness testing to ensure the chromatographic system functions appropriately under nominal conditions. For β-carotene analysis via HPTLC-densitometry, these include:
- Retardation factor (Rf): 0.27 for β-carotene [6]
- Linearity range: 25–1000 ng/band [5]
- Limit of detection (LOD): 10.15 ng/band [6]
- Limit of quantification (LOQ): 30.76 ng/band [6]
Experimental Workflow
The following diagram illustrates the complete experimental workflow for robustness testing in green HPTLC-densitometry:
Data Analysis and Interpretation
Response Monitoring
Throughout robustness testing, multiple responses should be monitored to comprehensively assess method performance:
- Assay responses: β-carotene content in sample preparations
- System suitability responses: Rf values, peak symmetry, and resolution
- Quantitative parameters: Calibration slope, intercept, and correlation coefficient
Statistical Analysis of Effects
The effect of each factor (EX) on the responses (Y) is calculated as the difference between the average responses when the factor was at its high level (+1) and low level (-1) [68]:
EX = ȲX(+1) - ȲX(-1)
Statistical significance of effects can be determined using both graphical and statistical methods. A half-normal probability plot effectively distinguishes significant from negligible effects, where points deviating from a straight line through the origin represent potentially significant effects [68].
Table 2: Example Robustness Test Results for β-Carotene HPTLC Method (Hypothetical Data)
| Factor | Effect on β-Carotene Content (%) | Effect on Rf Value | Effect on Peak Symmetry | Statistical Significance (p<0.05) |
|---|---|---|---|---|
| Mobile Phase Composition | -0.32 | 0.02 | 0.03 | No |
| Saturation Time | 0.45 | 0.01 | 0.08 | No |
| Development Distance | 0.87 | 0.05 | 0.12 | Yes (Rf only) |
| Spotting Position | -0.21 | 0.00 | 0.02 | No |
| Time to Scanning | -0.19 | 0.00 | 0.01 | No |
| Activation Temperature | 0.34 | 0.01 | 0.05 | No |
| Detection Wavelength | 1.12 | 0.00 | 0.04 | Yes (Content only) |
Data Interpretation Protocol
The following diagram illustrates the decision-making process for interpreting robustness test results:
Research Reagent Solutions
Table 3: Essential Materials for Green HPTLC-Densitometry of β-Carotene
| Item | Function | Specification |
|---|---|---|
| RP Silica Gel 60 F254S Plates | Stationary phase for separation | 10 × 20 cm glass plates [5] |
| Ethanol (Absolute) | Green mobile phase component | Chromatography grade [5] |
| Cyclohexane | Mobile phase modifier | Chromatography grade [5] |
| Ammonia Solution | Mobile phase pH modifier | Analytical grade (25%) [5] |
| β-Carotene Standard | Quantification reference | High purity (≥98.7%) [5] |
| Automatic Sample Applicator | Precise sample application | 6 mm band width, 150 nL/s rate [5] |
| Twin-Trough Chamber | Chromatographic development | Glass chamber with lid [5] |
| Densitometer with Deuterium Lamp | In-situ quantification | Scanning capability at 459 nm [5] |
Establishment of System Suitability Test Limits
Based on robustness test results, system suitability test (SST) limits should be established to ensure method performance during routine application. For the green HPTLC method for β-carotene, the following SST criteria are recommended:
- Rf value for β-carotene: 0.27 ± 0.05
- Peak symmetry factor: 0.8–1.5
- Calibration correlation coefficient (r²): ≥0.995
- Resolution from nearest compound: ≥1.5
The SST should be performed each time the method is used, particularly when critical reagents or equipment are changed [68].
Robustness testing represents an essential component of method validation for green HPTLC-densitometry of β-carotene in plant extracts. Through deliberate variation of method parameters according to structured experimental designs, the method's reliability can be demonstrated, and appropriate system suitability criteria can be established. The green HPTLC method utilizing ethanol, cyclohexane, and ammonia demonstrates sufficient robustness for transfer between laboratories and routine application in quality control of plant extracts and commercial formulations, contributing to both analytical reliability and environmental sustainability.
The push for sustainable and eco-efficient analytical techniques has become a central focus in modern pharmaceutical and natural product analysis. High-performance liquid chromatography (HPLC) has long been the gold standard for quantitative analysis, but high-performance thin-layer chromatography (HPTLC), particularly its "green" iterations, has emerged as a powerful complementary technique. This application note provides a detailed comparative analysis of Green HPTLC and HPLC, specifically contextualized within research concerning the densitometric analysis of beta-carotene in plant extracts. We evaluate both platforms across critical parameters including analytical accuracy, solvent consumption, operational costs, and alignment with Green Analytical Chemistry (GAC) principles, providing researchers with a clear framework for method selection.
Table 1: Overall Comparative Analysis of HPLC and Green HPTLC Techniques
| Parameter | HPLC | Green HPTLC |
|---|---|---|
| Typical Solvent Consumption per Analysis | 500–2000 mL/day (per instrument) [2] | <10 mL per analysis [2] |
| Analysis Time per Sample | >30 minutes (sequential analysis) [2] | 5–15 minutes (parallel analysis of ~20 samples) [2] |
| Sample Throughput | Sequential | High (parallel processing) [2] [69] |
| Capital and Operational Cost | High (costly columns, high-pressure pumps) [21] | Low to moderate [7] [21] |
| Sample Pretreatment | Often labor-intensive [2] | Minimal [2] [69] |
| Flexibility in Detection | Single detector per run | Multimodal detection (e.g., MS, SERS, NIR) on a single plate [2] |
| Greenness Score (AGREE Example) | Generally lower | 0.81–0.88 in reported methods [5] [56] |
| Data Robustness (Accuracy/Precision) | High (RSD < 2% common) | High (RSD ≤ 2% achievable) [21] |
Detailed Experimental Protocols
Protocol 1: Green HPTLC-Densitometry for Beta-Carotene
This protocol is adapted from validated methods for the analysis of beta-carotene in plant extracts like Daucus carota and Ipomea batatas, and nano-formulated apricot extracts [5] [7].
- Instrumentation: HPTLC system (e.g., CAMAG) with Automatic TLC Sampler 4 (ATS4), automated developing chamber (ADC2), TLC scanner, and WinCATS software [5] [56].
- Stationary Phase: Reversed-phase (RP) silica gel 60 F254S plates (e.g., from Merck) [5].
- Standard and Sample Preparation:
- Standard Stock Solution: Dissolve β-carotene standard in a suitable solvent (e.g., hexane:acetone mixture) to prepare a 100 µg/mL stock solution.
- Calibration Solutions: Dilute the stock solution to obtain concentrations in the range of 25–1000 ng/band [5] or 100–500 ng/band [7].
- Plant Extract Preparation:
- Traditional Extraction (TE): Macerate plant material with organic solvents (e.g., hexane, acetone, or mixtures).
- Ultrasound-Assisted Extraction (UBE): Treat plant material with solvent in an ultrasonic bath to enhance extraction efficiency and yield [5].
- Application: Apply standard and sample solutions as 6–8 mm bands on the HPTLC plate using an automatic applicator [5] [7].
- Chromatographic Development:
- Detection and Quantification:
- Method Validation: Validate the method as per ICH Q2(R1) guidelines for linearity, precision, accuracy, LOD, LOQ, and robustness [5] [7].
Protocol 2: HPLC Analysis for Beta-Carotene
This protocol summarizes a conventional HPLC approach for comparative purposes, based on literature practices [2] [5].
- Instrumentation: HPLC system with isocratic or gradient pump, auto-sampler, column oven, and Diode Array Detector (DAD).
- Column: Reversed-phase C18 column (e.g., 250 mm x 4.6 mm, 5 µm).
- Mobile Phase: Various binary or ternary mixtures of acetonitrile, methanol, and water are commonly used, often with modifiers.
- Detection: 450–460 nm.
- Flow Rate: 1.0–1.5 mL/min.
- Injection Volume: 10–20 µL.
- Analysis: Samples are analyzed sequentially. The total run time per sample can exceed 30 minutes, including column re-equilibration [2].
Workflow and Logical Pathway
The diagram below illustrates the core procedural steps for the Green HPTLC method, highlighting its streamlined and parallel nature.
The Scientist's Toolkit: Key Research Reagents and Materials
Table 2: Essential Materials for Green HPTLC-Densitometry of Beta-Carotene
| Item | Function/Description | Example Specification/Note |
|---|---|---|
| β-Carotene Standard | Primary reference standard for calibration. | Purity ≥ 95-98.7% (e.g., from Sigma-Aldrich) [5] [7]. |
| HPTLC RP-18 Plates | Stationary phase for separation. | Glass-backed, 10x20 cm, silica gel 60 F254S (e.g., from Merck) [5] [56]. |
| Green Solvents | Mobile phase components. | Ethanol, water, cyclohexane, acetone. Preferred over hazardous solvents like chlorinated methanes [5] [69] [56]. |
| Ultrasonic Bath | For efficient extraction of analytes from plant matrices. | Enhances yield and reduces extraction time [5]. |
| HPTLC Instrumentation | Integrated system for application, development, and detection. | E.g., CAMAG system with ATS4, ADC2, TLC Scanner, and WinCATS software [5] [70]. |
| Microsyringe | Precise application of samples onto the HPTLC plate. | E.g., 100 µL Hamilton syringe [5]. |
| Automated Developing Chamber | Provides controlled, reproducible development conditions. | Critical for achieving high method robustness and reproducibility [5]. |
The comparative data unequivocally demonstrates that Green HPTLC offers a compelling, sustainable alternative to HPLC for routine quality control and analysis of compounds like beta-carotene in plant extracts. Its significantly lower solvent consumption, higher throughput due to parallel analysis, and reduced operational costs align perfectly with the 12 principles of Green Analytical Chemistry (GAC) [5] [56]. The high greenness scores (e.g., AGREE > 0.8) achieved by modern HPTLC methods underscore their environmental credentials [5] [56].
While HPLC remains indispensable for applications requiring peak-resolution, it operates with a linear "take-make-dispose" model that is increasingly scrutinized [71]. In contrast, the inherent attributes of HPTLC, such as minimal solvent use and low energy requirements, position it as a cornerstone for sustainable analytical practices [2]. The integration of advanced detection modalities like HPTLC-MS and HPTLC-SERS further enhances its capabilities, bridging the gap between simple screening and sophisticated analysis [2].
For research focused on beta-carotene and similar phytochemicals, Green HPTLC-densitometry provides a cost-effective, rapid, accurate, and environmentally responsible platform. It is particularly suited for high-throughput screening, stability studies, and quality assurance in both laboratory and industrial settings, enabling a shift towards more sustainable and eco-efficient analytical workflows.
The quality control of commercial products like dietary supplements and fortified foods is paramount for ensuring consumer safety and product efficacy. β-carotene, a prominent carotenoid and provitamin A, is a critical biomarker in these products. This document outlines detailed application notes and protocols for utilizing green High-Performance Thin-Layer Chromatography coupled with densitometry (HPTLC-densitometry) for the quantification of β-carotene. The content is framed within a broader thesis on green HPTLC, emphasizing methods that reduce environmental impact by substituting toxic solvents with safer alternatives, without compromising analytical performance [5] [72]. This approach aligns with the principles of Green Analytical Chemistry (GAC), providing a reliable, sustainable, and cost-effective solution for routine analysis in quality control laboratories.
Validated Green HPTLC-Densitometry Methods for β-Carotene Quantification
The following table summarizes key parameters from validated green HPTLC methods for the analysis of β-carotene in various matrices.
Table 1: Summary of Validated Green HPTLC-Densitometry Methods for β-Carotene
| Method Parameter | Method 1: Reversed-Phase HPTLC [5] | Method 2: Normal-Phase HPTLC [41] | Method 3: Normal-Phase TLC-Densitometry [39] |
|---|---|---|---|
| Stationary Phase | RP-18 silica gel 60 F254S plates | Silica gel 60 F254 plates | TLC Aluminiumoxid 60 F254 neutral plates |
| Greener Mobile Phase | Ethanol:Cyclohexane:Ammonia (95:2.5:2.5, v/v/v) | n-Hexane:Ethyl Acetate (6:4, v/v) | Chloroform:MeOH:Acetone:NH4OH (10:22:53:0.2, v/v/v/v) |
| Detection Wavelength | 459 nm | 254 nm | 450 nm |
| Retardation Factor (Rf) | Not specified | 0.27 | 0.90 |
| Linear Range | 25–1000 ng/band | 100–500 ng/band | Not Specified (Calibration solutions: 20-200 mg/L) |
| Limit of Detection (LOD) | Not specified | 10.15 ng/band | 103 mg/L |
| Limit of Quantification (LOQ) | Not specified | 30.76 ng/band | 313 mg/L |
| Application Matrices | Traditional and ultrasound-based extracts of carrot, sweet potato, commercial softgel | Gymnosporia senegalensis plant extracts | Dietary supplement capsules, fruit juices |
| Greenness Score (AGREE) | 0.81/1 [5] | Reported as "secure and sustainable" [41] | Not Assessed |
Detailed Experimental Protocol for Green HPTLC-Densitometry
This protocol is adapted from the cited literature, with an emphasis on the greener reversed-phase method [5].
The Scientist's Toolkit: Research Reagent Solutions
Table 2: Essential Materials and Reagents
| Item | Function/Description | Example/Comment |
|---|---|---|
| β-Carotene Standard | Analytical standard for calibration curve. | Purity ≥98.7% [5]. |
| HPTLC Plates | Stationary phase for chromatographic separation. | RP-18 silica gel 60 F254S plates for reversed-phase analysis [5]. |
| Greener Solvents | Components of the mobile phase and for sample preparation. | Ethanol, cyclohexane, ammonia solution, ethyl acetate [5] [39]. |
| Ultrasonicator | For efficient extraction of β-carotene from solid samples. | Used in Ultrasound-Based Extraction (UBE) [5]. |
| HPTLC System | Automated sample applicator, development chamber, and densitometer. | e.g., CAMAG system with ATS4 applicator and TLC scanner [5]. |
| Densitometry Software | For data acquisition and analysis. | e.g., WinCATS software [73]. |
Sample Preparation Protocol
- Dietary Supplement Capsules/Tablets: Accurately weigh the powder from five capsules or tablets equivalent to about 5 mg of β-carotene. Transfer it to a 5 mL volumetric flask, add ethyl acetate, shake for 10 minutes, and dilute to the mark with the same solvent. Filter the solution through a 0.45 µm membrane filter before application [39].
- Fortified Foods & Fruit Juices: For liquid samples like juice, measure 40 mL and liquid-liquid extract it with 80 mL of chloroform in a separatory funnel. Shake for 15 minutes, allow for phase separation, and collect the chloroform layer. Repeat the extraction three times. Combine the chloroform extracts and evaporate at 30°C to a precise volume (e.g., 50 mL) [39].
- Plant Material (for reference): Fresh plant material should be washed, shade-dried, and homogenized into a powder. The β-carotene can be extracted using a suitable solvent like hexane:acetone (50:50) via traditional shaking or ultrasound-assisted extraction (UBE). UBE has been shown to improve extraction efficiency [5].
HPTLC Instrumental Procedure
Application of Samples:
- Use an automated applicator (e.g., CAMAG ATS4) to apply standard and sample solutions as 6 mm bands on the RP-18 HPTLC plate.
- The application rate should be kept constant (e.g., 150 nL/s) [5].
- A typical calibration curve might include standard bands of 100, 200, 300, 400, and 500 ng of β-carotene [41].
Chromatographic Development:
- Mobile Phase: Prepare a ternary mixture of Ethanol:Cyclohexane:Ammonia (95:2.5:2.5, v/v/v) [5].
- Saturation: Pour the mobile phase into a twin-trough glass chamber and saturate for 15-20 minutes at room temperature.
- Development: Develop the plate in the saturated chamber in a linear ascending mode. Allow the mobile phase to migrate an appropriate distance (e.g., 80 mm from the point of application).
Densitometric Analysis:
- After development, dry the plate thoroughly in air.
- Scan the plate using a TLC scanner in absorbance mode at the determined wavelength, typically 459 nm for β-carotene [5].
- The peaks for β-carotene in samples are identified by comparing their Rf values and UV-Vis spectra with those of the pure standard.
Greenness Assessment
- The greenness of the analytical method should be evaluated using metrics such as the Analytical GREEnness (AGREE) tool [5] [72].
- The AGREE tool evaluates 12 principles of GAC, providing a score between 0 and 1. The proposed reversed-phase method using ethanol/cyclohexane/ammonia achieved a score of 0.81, indicating excellent greenness [5].
Application in Quality Control: Data Analysis and Interpretation
The described protocol is applied for the quantitative determination of β-carotene in commercial products.
- Calculation of Content: The concentration of β-carotene in the unknown sample solutions is determined from the calibration curve (peak area vs. concentration of the standard). This value is then used to calculate the percentage content in the original sample weight or volume [5] [39].
- Reportable Results: Studies have shown significant variation in β-carotene content. For example, in carrot and sweet potato extracts, the content was reported as a percentage by weight, while in commercial fruit juices, it ranged from 5.14 to 19.93 mg per 100 mL [39] [5]. Quality control ensures that the product label claim falls within the acceptable range of the analytically determined value.
- Monitoring Degradation: HPTLC is also effective in monitoring the stability of β-carotene. For instance, the thermal degradation of β-carotene in fortified sunflower oil under heating at 100°C for 1-5 hours can be efficiently tracked using this technique [74].
Workflow and Signaling Pathways
The following diagram illustrates the complete experimental workflow for the quality control of β-carotene in commercial products using green HPTLC-densitometry.
The application of green HPTLC-densitometry provides a robust, precise, and environmentally friendly platform for the quality control of β-carotene in dietary supplements and fortified foods. The methodologies detailed herein, particularly the greener reversed-phase approach, offer a sustainable alternative to conventional methods that use more toxic solvents. By implementing these protocols, quality control laboratories can ensure product efficacy and regulatory compliance while adhering to the growing imperative of green analytical chemistry.
In the evolving landscape of green analytical chemistry, the quantitative assessment of a method's environmental impact is crucial. This case study details the application of a green Reversed-Phase High-Performance Thin-Layer Chromatography-densitometry (RP-HPTLC-densitometry) method for quantifying β-carotene in plant extracts, with a particular focus on its superior greenness profile as validated by an Analytical GREEnness (AGREE) score of 0.81 [5]. The AGREE metric evaluates methods against all twelve principles of green analytical chemistry, providing a comprehensive score from 0 to 1, where higher values indicate greater environmental friendliness [5] [75]. The developed method offers a sustainable alternative for the analysis of bioactive compounds in vegetable crops, phytopharmaceuticals, and commercial products, aligning with the growing demand for environmentally benign analytical techniques in research and drug development [5] [63].
Key Research Reagent Solutions
The following table lists the essential materials and reagents used in the development and execution of this green analytical method.
Table 1: Key Research Reagent Solutions and Their Functions
| Reagent/Material | Function in the Protocol | Greenness Consideration |
|---|---|---|
| β-Carotene Standard (98.7%) [5] | Analytical reference standard for calibration and identification | Sourced from Sigma-Aldrich; purity ensures method accuracy and minimizes waste from repetition. |
| RP-18 silica gel 60 F254S HPTLC Plates [5] | Stationary phase for chromatographic separation | Reversed-phase plates allow for the use of greener mobile phases compared to normal-phase silica gel. |
| Ethanol (EtOH) [5] | Primary component of the green mobile phase | A greener, biodegradable solvent classified as preferable in solvent selection guides. |
| Cyclohexane (CY) [5] | Component of the ternary mobile phase | Used in a minimal proportion (2.5%) to achieve separation, reducing overall toxicity. |
| Ammonia (A) [5] | Component of the ternary mobile phase | Used in a minimal proportion (2.5%) to modify the mobile phase pH. |
| Acetone & Hexane (Analytical Grade) [5] | Solvents for traditional and ultrasound-assisted extraction of plant samples | Standard solvents for carotenoid extraction. |
| Dichloromethane [8] | Solvent for carotenoid extraction in related methodologies | Highlights an area for potential future green optimization in the sample preparation step. |
Detailed Experimental Protocol
Sample Preparation and Extraction
3.1.1 Plant Material and Commercial Formulation:
- Fresh roots of Daucus carota L. (carrot) and Ipomea batatas L. (sweet potato) were obtained from a local market [5].
- A commercial soft gelatin capsule formulation of β-carotene (Formulation A) was procured from a pharmacy [5].
3.1.2 Extraction Procedures: Two extraction techniques were employed to isolate β-carotene from the plant matrices [5]:
- Traditional Extraction (TE): Samples were extracted using solvents like hexane, acetone, or a hexane:acetone (50:50) mixture.
- Ultrasound-Based Extraction (UBE): The same solvent systems were used, but with the assistance of ultrasound energy to enhance extraction efficiency and reduce extraction time and solvent consumption.
Instrumentation and Chromatographic Conditions
The following workflow summarizes the core steps of the HPTLC-densitometry analysis:
3.2.1 Instrumentation:
- HPTLC System: CAMAG TLC system (Muttenz, Switzerland) [5].
- Sample Applicator: CAMAG Automatic TLC Sampler 4 (ATS4) fitted with a microliter syringe [5].
- Development Chamber: CAMAG automated developing chamber (ADC2) [5].
- Densitometer: TLC scanner equipped with a deuterium lamp [5].
3.2.2 Detailed Chromatographic Conditions:
- Stationary Phase: 10 × 20 cm glass plates pre-coated with RP silica gel 60 F254S [5].
- Application Rate: 150 nL per second [5].
- Mobile Phase: A ternary mixture of Ethanol-Cyclohexane-Ammonia in the ratio of 95:2.5:2.5 (v/v) [5]. This combination was identified as the optimal green mobile phase.
- Development Mode: Linear ascending development to a distance of 80 mm in a chamber pre-saturated with mobile phase for 30 minutes at 22°C [5].
- Detection: Densitometric scanning in absorbance/reflectance mode at a wavelength (λ) of 459 nm [5].
- Slit Dimensions: 4 × 0.45 mm [5].
- Scanning Rate: 20 mm/s [5].
Method Validation Protocol
The developed method was rigorously validated as per the International Council for Harmonisation (ICH) Q2(R1) guidelines [5]. The following table summarizes the key validation parameters and results.
Table 2: Summary of Method Validation Parameters for β-Carotene Quantification
| Validation Parameter | Experimental Protocol | Result | Acceptance Criteria (Typical ICH) |
|---|---|---|---|
| Linearity & Range | Calibration curves plotted from 25–1000 ng band⁻¹ [5]. | Linear within the specified range [5]. | Correlation coefficient (R²) > 0.990 |
| Accuracy | Recovery studies conducted by spiking pre-analyzed samples with known quantities of standard β-carotene [5]. | Found to be accurate and dependable [5]. | Recovery 98-102% |
| Precision | Intra-day and inter-day precision assessed by repeated analysis of samples (n≥3) [5]. | Found to be precise and dependable [5]. | RSD ≤ 2.0% |
| Robustness | Deliberate, small variations in mobile phase composition and development conditions were introduced [5]. | Method performance remained acceptable, indicating robustness [5]. | RSD of results ≤ 2.0% |
| Sensitivity | Limit of Detection (LOD) and Limit of Quantification (LOQ) were calculated based on the calibration curve signal-to-noise ratio [5]. | Found to be sensitive and dependable [5]. | LOD: S/N ~3, LOQ: S/N ~10 |
| Specificity | The standard band of β-carotene in samples was confirmed by comparing its Rf and spectrum with the standard [5]. | No interference from other extract components was observed [5]. | Peak purity ≥ 0.999 |
Results and Data Analysis
Quantitative Analysis of Real Samples
The validated method was successfully applied to quantify β-carotene in various fractions of carrot, sweet potato, and a commercial formulation. The results demonstrated that the hexane:acetone (50:50) fraction yielded the highest amount of β-carotene in both TE and UBE procedures [5]. Furthermore, the ultrasound-based extraction (UBE) technique consistently resulted in higher β-carotene yields compared to traditional extraction, underscoring its efficiency [5].
Table 3: β-Carotene Content in Different Samples (Adapted from [5])
| Sample | Extraction Method | β-Carotene Content (% w/w) |
|---|---|---|
| Daucus carota (Carrot) | Traditional Extraction (TE) | 10.32 |
| Daucus carota (Carrot) | Ultrasound-Based Extraction (UBE) | 11.03 |
| Ipomea batatas (Sweet Potato) | Traditional Extraction (TE) | 3.73 |
| Ipomea batatas (Sweet Potato) | Ultrasound-Based Extraction (UBE) | 4.43 |
| Commercial Formulation A | Traditional Extraction (TE) | 6.73 |
| Commercial Formulation A | Ultrasound-Based Extraction (UBE) | 6.89 |
Greenness Assessment Using the AGREE Metric
The greenness of the proposed RP-HPTLC method was quantitatively evaluated using the Analytical GREEnness (AGREE) metric tool [5]. The AGREE calculator incorporates all twelve principles of Green Analytical Chemistry (GAC), weighing and scoring each to produce a final pictogram with a score between 0 and 1 [5] [75]. The developed method achieved an AGREE score of 0.81 [5]. This high score confirms the method's superior greenness profile, attributed primarily to the use of a safer ethanol-based mobile phase instead of the more toxic solvents like methanol or acetonitrile commonly used in other chromatographic methods [5]. For context, similar green HPTLC methods for other compounds, such as thymoquinone, have reported AGREE scores of 0.82 and 0.84 [75].
Application Notes for Researchers
- Method Selectivity: This method is highly selective for β-carotene in complex plant matrices. The combination of specific Rf value and spectral confirmation at 459 nm ensures accurate identification [5].
- Efficiency of UBE: The significant increase in extraction yield with UBE makes it the recommended technique for sample preparation, as it enhances throughput and reduces solvent consumption [5].
- Green Alternative to HPLC: This HPTLC method serves as an environmentally friendly and cost-effective alternative to High-Performance Liquid Chromatography (HPLC), requiring less solvent volume, generating less waste, and having a faster analysis time [8].
- Routine Analysis Ready: The combination of validation data, simplicity, and green credentials makes this protocol directly suitable for implementation in routine quality control laboratories for the analysis of β-carotene in raw materials, finished products, and plant extracts [5] [6].
Conclusion
Green HPTLC-densitometry stands as a robust, sustainable, and economically viable analytical platform for the quantification of β-carotene in plant extracts and commercial products. The methodology successfully balances analytical rigor with the principles of Green Chemistry, as evidenced by high greenness metric scores. Key takeaways include the demonstrated superiority of ultrasound-assisted extraction, the effectiveness of ethanol-based mobile phases, and the reliability of validation data that meets international standards. Future directions should focus on the deeper integration of HPTLC with advanced detection systems like mass spectrometry (HPTLC-MS) and Surface-Enhanced Raman Spectroscopy (HPTLC-SERS) for confirmatory analysis. Furthermore, the adoption of smartphone-based quantification holds significant promise for decentralizing quality control, making this technology accessible for field-based and resource-limited settings, thereby profoundly impacting biomedical research, nutraceutical development, and global public health initiatives.
References
- 1. High-performance thin layer chromatography: A powerful ... [https://pmc.ncbi.nlm.nih.gov/articles/PMC3658041/]
- 2. Versatile platforms based on HPTLC: Multimodal and ... [https://www.sciencedirect.com/science/article/abs/pii/S0924224425004467]
- 3. From Simplicity to Sophistication The Evolution of TLC ... [https://www.slideshare.net/slideshow/from-simplicity-to-sophistication-the-evolution-of-tlc-to-hptlc-pptx/272053809]
- 4. High-Performance Thin-Layer Chromatography (HPTLC) [https://ctlatesting.com/blogs/articles/high-performance-thin-layer-chromatography-hptlc]
- 5. A Greener HPTLC Approach for the Determination of β ... [https://www.mdpi.com/2073-4395/11/12/2443]
- 6. Isolation, development and validation of HPTLC method for ... [https://pubmed.ncbi.nlm.nih.gov/37354729/]
- 7. Development of a robust HPTLC method for estimation of β ... [https://japsonline.com/abstract.php?article_id=4490&sts=2]
- 8. A new method for semi-quantitative assessment of β ... [https://www.sciencedirect.com/science/article/abs/pii/S1570023223003392]
- 9. Disease Prevention and Treatment Using β-Carotene [https://pmc.ncbi.nlm.nih.gov/articles/PMC9150880/]
- 10. Carotenoids | Linus Pauling Institute | Oregon State University [https://lpi.oregonstate.edu/mic/dietary-factors/phytochemicals/carotenoids]
- 11. Carotenoids for Antiaging: Nutraceutical, Pharmaceutical, ... [https://www.mdpi.com/1424-8247/18/3/403]
- 12. Review Biomarkers of carotenoid bioavailability [https://www.sciencedirect.com/science/article/abs/pii/S0963996917301382]
- 13. The Galohgor Nutraceutical Cookies Effects on β-Carotene ... [https://pmc.ncbi.nlm.nih.gov/articles/PMC6941728/]
- 14. Green Analytical Chemistry: Principles, Innovations, and ... [https://zenodo.org/records/16799280]
- 15. Green Analytical Chemistry—Recent Innovations [https://www.mdpi.com/2673-4532/6/1/10]
- 16. Green Analytical Chemistry: Sustainable Methods and ... [https://www.labmanager.com/green-analytical-chemistry-sustainable-methods-and-practices-34268]
- 17. 12 Principles of Green Chemistry [https://www.acs.org/green-chemistry-sustainability/principles/12-principles-of-green-chemistry.html]
- 18. Green and White Analytical Chemistry [https://pubmed.ncbi.nlm.nih.gov/40998048/]
- 19. Recent application of green analytical chemistry: eco-friendly ... [https://fjps.springeropen.com/articles/10.1186/s43094-024-00658-6]
- 20. Discover the Key Benefits of HPTLC Analysis [https://camag.com/industries-and-application/benefits-of-hptlc/]
- 21. Dual-platform integration of HPTLC and firefly algorithm ... [https://pmc.ncbi.nlm.nih.gov/articles/PMC12345108/]
- 22. Guidelines on the proper selection of greenness and ... [https://www.sciencedirect.com/science/article/abs/pii/S0003267025004465]
- 23. AGREE—Analytical GREEnness Metric Approach and ... [https://pmc.ncbi.nlm.nih.gov/articles/PMC7588019/]
- 24. Red analytical performance index (RAPI) and software [https://pubs.rsc.org/en/content/articlehtml/2025/gc/d4gc05298f]
- 25. Emerging Tools for Holistic Evaluation of Analytical Methods [https://www.chromatographyonline.com/view/emerging-tools-for-holistic-evaluation-of-analytical-methods]
- 26. Recent Advances In Green Chromatography Techniques ... [https://www.sciencedirect.com/science/article/pii/S2772391725000830]
- 27. A Green High-Performance Thin-Layer Chromatography ... [https://pmc.ncbi.nlm.nih.gov/articles/PMC9103461/]
- 28. a comparative study with HPTLC densitometry [https://www.nature.com/articles/s41598-025-26418-x]
- 29. Stationary Phases for Modern Thin-Layer Chromatography [https://www.chromatographyonline.com/view/stationary-phases-modern-thin-layer-chromatography]
- 30. HPTLC/TLC glass plates, C18-modified silica layer, RP-18 ... [https://www.mn-net.com/hptlc/tlc-glass-plates-c18-modified-silica-layer-rp-18-w-uv254-10x20-cm-811072]
- 31. Comparative evaluation of ultrasound-assisted extraction ... [https://pmc.ncbi.nlm.nih.gov/articles/PMC11904522/]
- 32. Green Ultrasound-Assisted Extraction of Carotenoids from ... [https://link.springer.com/article/10.1007/s12649-025-02976-z]
- 33. A Comprehensive Review of Analytical Approaches for ... [https://www.mdpi.com/2076-3417/15/7/3506]
- 34. Determination of lutein by high-performance thin-layer ... [https://pubmed.ncbi.nlm.nih.gov/22365731/]
- 35. Determination of lutein by high-performance thin-layer ... [https://www.academia.edu/100095121/Determination_of_lutein_by_high_performance_thin_layer_chromatography_using_densitometry_and_screening_of_major_dietary_carotenoids_in_food_supplements?uc-g-sw=15479765]
- 36. Lutein and β-Carotene Characterization in Free and ... [https://link.springer.com/article/10.1007/s12247-023-09745-2]
- 37. Method for the Determination of β-Carotene in ... [https://pmc.ncbi.nlm.nih.gov/articles/PMC2586117/]
- 38. A rapid and sensitive method for determination of carotenoids ... [https://plantmethods.biomedcentral.com/articles/10.1186/s13007-015-0051-0]
- 39. Assay of β-Carotene in Dietary Supplements and Fruit ... [https://link.springer.com/article/10.1007/s12161-014-0019-0]
- 40. Assay of β-Carotene in Dietary Supplements and Fruit ... [https://www.academia.edu/81621197/Assay_of_%CE%B2_Carotene_in_Dietary_Supplements_and_Fruit_Juices_by_TLC_Densitometry]
- 41. Isolation, development and validation of HPTLC method for ... [https://www.sciencedirect.com/science/article/abs/pii/S0981942823003546]
- 42. Validation of High-Performance Thin-Layer Chromatographic ... [https://pmc.ncbi.nlm.nih.gov/articles/PMC2662610/]
- 43. Versatile Platforms based on HPTLC: Multimodal and ... [https://www.sciencedirect.com/science/article/pii/S0924224425004467?dgcid=rss_sd_all]
- 44. Carotenoids and pro-vitamin A value of white fleshed ... [https://www.sciencedirect.com/science/article/abs/pii/0889157588900348]
- 45. Analytical tools for the analysis of β-carotene and its ... [https://pmc.ncbi.nlm.nih.gov/articles/PMC4487603/]
- 46. Novel eco-friendly HPTLC method using dual-wavelength ... [https://www.nature.com/articles/s41598-024-73523-4]
- 47. Modeling and optimization of ultrasound-assisted green ... [https://www.sciencedirect.com/science/article/abs/pii/S0926669019301219]
- 48. Employing Response Surface Methodology for the ... [https://pmc.ncbi.nlm.nih.gov/articles/PMC6272631/]
- 49. The Basics of Botanical Matrices and HPTLC Testing [https://www.eurofinsus.com/food-testing/resources/applying-hptlc-in-complex-food-and-supplement-matrices/]
- 50. Comparative study of antioxidant activity and validated RP ... [https://pmc.ncbi.nlm.nih.gov/articles/PMC5506739/]
- 51. Isolation of β-carotene, α-carotene and lutein from carrots ... [https://www.sciencedirect.com/science/article/abs/pii/S0021967315002459]
- 52. Development of slow release formulations of β-carotene ... [https://pmc.ncbi.nlm.nih.gov/articles/PMC4648872/]
- 53. Determination of β-Carotene in Supplements and Raw Materials by Reversed-Phase High Pressure Liquid Chromatography: Collaborative Study - PMC [https://pmc.ncbi.nlm.nih.gov/articles/PMC2657295/]
- 54. Reproducibility of high-performance thin-layer ... [https://www.sciencedirect.com/science/article/abs/pii/S2468170917301352]
- 55. Reproducibility of High-Performance Thin-Layer ... [https://nij.ojp.gov/library/publications/reproducibility-high-performance-thin-layer-chromatography-hptlc-textile-dye]
- 56. A Simple, Cost-Effective, and Green HPTLC Method for the ... [https://www.mdpi.com/2073-4395/12/5/1016]
- 57. Method Validation in High-Performance Thin Layer ... [https://www.eurofinsus.com/food-testing/resources/method-validation-in-hptlc-methods-for-food-and-supplements/]
- 58. Simple tools for mastering color in scientific figures [https://www.molecularecologist.com/2020/04/23/simple-tools-for-mastering-color-in-scientific-figures/]
- 59. Data Visualization Explained (Part 3): The Role of Color [https://towardsdatascience.com/data-visualization-explained-part-3-the-role-of-color/]
- 60. A Detailed Guide to Color Blind Friendly Palettes [+ Hex ... [https://visme.co/blog/color-blind-friendly-palette/]
- 61. Ecofriendly densitometric RP-HPTLC method for ... [https://pmc.ncbi.nlm.nih.gov/articles/PMC9048746/]
- 62. Analytical Method Validation: Back to Basics, Part II [https://www.chromatographyonline.com/view/analytical-method-validation-back-basics-part-ii]
- 63. A Green RP-HPTLC-Densitometry Method for the ... [https://www.mdpi.com/2227-9717/8/7/817]
- 64. Determining LOD and LOQ Based on the Calibration Curve [https://www.sepscience.com/hplc-solutions-126-chromatographic-measurements-part-5-determining-lod-and-loq-based-on-the-calibration-curve-6959]
- 65. A greener RP-HPTLC-densitometry method for the ... [https://www.sciencedirect.com/science/article/pii/S187853522301033X]
- 66. Characterization of Precision and Accuracy and Total ... [https://bebpa.org/characterization-of-precision-and-accuracy-and-total-analytical-error-for-bioassays/]
- 67. Explanation of robustness in the context of analytical method validation. [https://mpl.loesungsfabrik.de/en/english-blog/method-validation/what-is-robustness]
- 68. | LCGC International Robustness Tests [https://www.chromatographyonline.com/view/robustness-tests]
- 69. Comparing the Greenness and Validation Metrics of ... [https://pmc.ncbi.nlm.nih.gov/articles/PMC11137692/]
- 70. FDA validated ecofriendly HPTLC method for quantification ... [https://www.nature.com/articles/s41598-025-18548-z]
- 71. HPLC 2025 Preview: The Road To Sustainable Analytical ... [https://www.chromatographyonline.com/view/hplc-2025-preview-the-road-to-sustainable-analytical-chemistry]
- 72. A greener RP-HPTLC-densitometry method for the ... [https://arabjchem.org/a-greener-rp-hptlc-densitometry-method-for-the-quantification-of-apremilast-in-nanoformulations-and-commercial-tablets-greenness-assessment-by-analytical-eco-scale-chlortox-and-agree-methods/]
- 73. FDA validated ecofriendly HPTLC method for quantification ... [https://pmc.ncbi.nlm.nih.gov/articles/PMC12436624/]
- 74. High-Performance Thin-Layer Chromatographic Method for ... [https://link.springer.com/article/10.1556/JPC.23.2010.1.6]
- 75. Green NP-HPTLC and green RP-HPTLC methods for the ... [https://pubmed.ncbi.nlm.nih.gov/34227167/]