Green HPTLC: Strategies for Reducing Solvent Consumption in Analytical Method Development
This article provides a comprehensive guide for researchers and drug development professionals on implementing solvent-reduction strategies in High-Performance Thin-Layer Chromatography (HPTLC).
Green HPTLC: Strategies for Reducing Solvent Consumption in Analytical Method Development
Abstract
This article provides a comprehensive guide for researchers and drug development professionals on implementing solvent-reduction strategies in High-Performance Thin-Layer Chromatography (HPTLC). It explores the foundational principles of HPTLC's inherent green advantages, presents practical methodological approaches for minimizing solvent use, offers troubleshooting for common optimization challenges, and outlines validation protocols for eco-friendly methods. By integrating modern green chemistry metrics and practical applications from food, herbal, and pharmaceutical analysis, this resource supports the development of sustainable, cost-effective, and regulatory-compliant HPTLC methods.
The Green Advantage: Understanding HPTLC's Low Solvent Footprint
Core Principles of HPTLC Driving Solvent Efficiency
High-Performance Thin-Layer Chromatography (HPTLC) is an advanced, instrumentalized form of thin-layer chromatography that offers superior separation efficiency, detection limits, and reproducibility compared to conventional TLC [1]. In an era of increasing environmental consciousness, optimizing solvent consumption is not merely an economic concern but a fundamental aspect of sustainable analytical method development. This technical support center addresses the core principles of HPTLC that enable researchers to achieve excellent separations while minimizing solvent usage, framed within the broader context of green chemistry principles and environmental responsibility.
FAQs: Fundamental Principles and Troubleshooting
How does HPTLC achieve solvent efficiency compared to other chromatographic methods?
HPTLC is inherently more solvent-efficient than column chromatography techniques like HPLC due to its parallel processing capability and minimal mobile phase requirements [1]. While HPLC requires continuous solvent flow throughout analysis, HPTLC uses a fixed, small volume of mobile phase in a developing chamber to separate multiple samples simultaneously. The solvent consumption in HPTLC is independent of the number of samples analyzed, making it increasingly efficient as sample throughput increases [1]. A single HPTLC development uses approximately 5-10 mL of mobile phase regardless of whether 10 or 36 samples are analyzed [1].
What are the key principles governing mobile phase selection for efficient separations?
Mobile phase selection in HPTLC is governed by the eluotropic value series, which ranks solvents by their polarity and eluting power [2]. The core principle is to select the least polar solvent system that provides adequate separation of target compounds, as this typically results in lower toxicity, cost, and environmental impact. Successful separation requires optimizing solvent polarity to achieve Rf values between 0.2-0.8, with ideal separations targeting Rf = 0.4 for the compound of interest [2]. Binary and ternary solvent mixtures provide fine-tuned polarity control for optimal separations [2].
What are the most common solvent-related issues in HPTLC and their solutions?
Table: Troubleshooting Common Solvent-Related Issues in HPTLC
| Problem | Possible Causes | Solutions |
|---|---|---|
| Streaking | Sample overloading, solvent mismatch, acidic/basic compound interactions | Reduce sample concentration; ensure sample solvent is compatible with mobile phase; add modifiers like triethylamine for basic compounds or acetic acid for acidic compounds [2] |
| Poor Resolution | Incorrect mobile phase polarity, insufficient chamber saturation | For co-eluting compounds (Rf difference <0.15), decrease mobile phase polarity; for excessive retention (Rf <0.2), increase polarity; ensure proper chamber saturation [2] |
| Irregular Solvent Front | Chamber not properly saturated, uneven plate immersion | Saturate chamber with filter paper for minimum 20 minutes; ensure mobile phase depth is consistent (0.5 cm) and plate is vertically positioned [3] [2] |
| Ghost Peaks | Contaminated solvents, carryover from previous runs | Use fresh, high-purity solvents; run blank injections to identify contamination sources; clean equipment thoroughly [4] |
How can I assess and improve the greenness of my HPTLC method?
Several assessment tools are available to evaluate the environmental impact of HPTLC methods. The NEMI scale, AGREE software, Eco scale assessment, GAPI, and White Analytical Chemistry metrics provide comprehensive evaluation frameworks [5]. To improve greenness:
- Replace hazardous solvents with less toxic alternatives (e.g., ethanol instead of methanol)
- Minimize overall solvent consumption through method optimization
- Implement solvent recycling systems where possible
- Choose biodegradable solvents when available options provide comparable separation efficiency [6] [5]
Experimental Protocols for Solvent-Efficient HPTLC
Standard HPTLC Procedure for Reduced Solvent Consumption
Plate Preparation: Use pre-coated HPTLC plates (e.g., silica gel 60 F254). Pre-wash with methanol if necessary, then activate at 110-120°C for 20-30 minutes [2] [1].
Sample Application: Dissolve samples in a minimal volume of volatile solvent. Apply as narrow bands (1-2 mm width) using automated applicators like the CAMAG Linomat [1]. Optimal concentration is typically 0.5-5 μL per band [1].
Mobile Phase Optimization:
- Begin with screening binary mixtures based on compound polarity
- Use systematic approaches like PRISMA for ternary solvent optimization
- Target the minimal solvent strength needed for adequate separation [2]
Chromatographic Development:
Detection: Utilize UV visualization at 254 nm or 366 nm, with chemical derivatization only when necessary [1].
Method Validation for Solvent-Efficient Protocols
Validate optimized methods according to ICH guidelines, assessing:
- Linearity: Typically demonstrated with correlation coefficient r > 0.995 [2]
- Precision: RSD < 5% for replicate analyses [2]
- Accuracy: Recovery of 95-105% for spiked samples [6] [2]
- Detection limits: LOD < 2.0 ng/spot, LOQ < 5.0 ng/spot for most applications [2]
Research Reagent Solutions for Solvent-Efficient HPTLC
Table: Essential Materials for Solvent-Efficient HPTLC
| Item | Function | Efficiency Considerations |
|---|---|---|
| Pre-coated HPTLC plates (e.g., silica gel 60 F254) | Stationary phase with uniform particle size (5-6 μm) for high-resolution separations [1] | Smaller particles (5-6 μm vs. conventional 10-12 μm) enable shorter development distances, reducing solvent use [1] |
| Automated sample applicator (e.g., CAMAG Linomat) | Precise sample application as narrow bands [6] [1] | Enables smaller initial spot size, reducing broadening and improving separation efficiency with standard mobile phases [1] |
| Twin-trough development chamber | Controlled development environment [1] | Requires less solvent for chamber saturation; allows different atmospheres in each trough [1] |
| Densitometer scanner | Quantitative analysis of separated compounds [6] | Enables precise quantification without additional solvent use for elution [6] |
| Binary/ternary solvent systems | Mobile phase optimization [2] | Carefully optimized mixtures achieve better separations with less solvent than single solvents [2] |
Workflow and Signaling Pathways
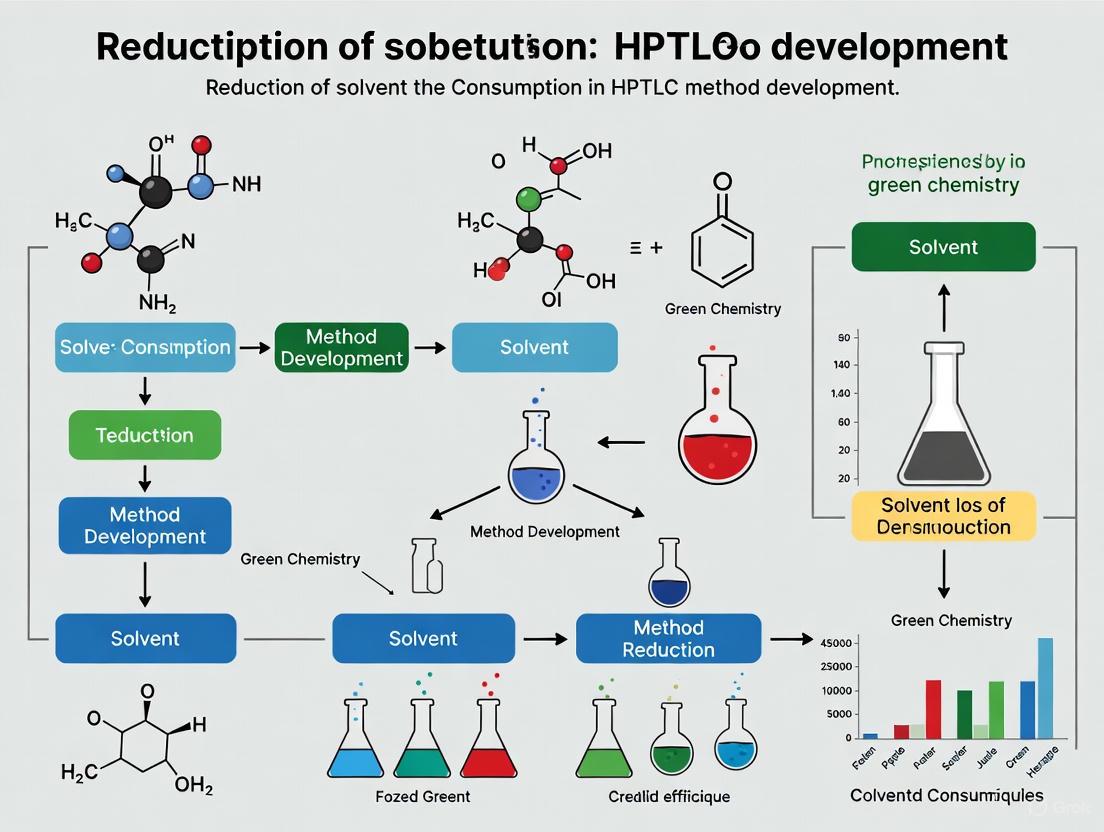
HPTLC Solvent Optimization Workflow
This systematic workflow demonstrates how to develop solvent-efficient HPTLC methods while maintaining analytical performance. The iterative process ensures that environmental considerations are integrated throughout method development rather than as an afterthought.
Advanced Optimization Strategies
Quality by Design (QbD) Approach
Implementing AQbD (Analytical Quality by Design) in HPTLC method development provides a systematic framework for achieving solvent efficiency while maintaining robustness [1]. This involves:
- Method Intent Definition: Clearly define analytical target profile
- Experimental Design: Identify critical method parameters (CMPs) and critical quality attributes (CQAs)
- Risk Assessment: Evaluate impact of varying analytical parameters
- Design Space Establishment: Define proven acceptable ranges for method parameters [1]
The QbD approach reduces method development time and validation failures while ensuring the method remains robust and solvent-efficient throughout its lifecycle [1].
Solvent Selection Guides for Different Compound Classes
Table: Mobile Phase Recommendations by Compound Polarity
| Compound Class | Recommended Mobile Phase | Efficiency Notes |
|---|---|---|
| Hydrocarbons | 100% hexane or with 2-5% ethyl acetate [2] | Minimal polarity, low environmental impact |
| Ethers, Esters | 10-20% ethyl acetate in hexane [2] | Moderate polarity, good separation efficiency |
| Aldehydes, Ketones | 20-40% ethyl acetate in hexane [2] | Balanced polarity for intermediate compounds |
| Alcohols, Amines | 30-70% ethyl acetate in hexane; may require modifiers [2] | Higher polarity, may need additives for peak shape |
| Carboxylic Acids | 50-90% ethyl acetate; may require methanol addition [2] | Highest polarity, most challenging for green solvents |
Solvent efficiency in HPTLC is achievable through methodical application of fundamental chromatographic principles, modern instrumentation, and green chemistry considerations. The parallel processing capability of HPTLC, combined with optimized mobile phases and development techniques, enables researchers to significantly reduce solvent consumption while maintaining excellent separation performance. By implementing the troubleshooting guides, experimental protocols, and optimization strategies outlined in this technical support center, researchers and drug development professionals can advance both their scientific objectives and environmental stewardship goals.
Frequently Asked Questions (FAQs)
FAQ 1: My method development is consuming too much solvent during the mobile phase optimization stage. How can I reduce this? The high solvent consumption in traditional TLC is often due to the use of large, non-saturated chambers. Modern HPTLC approaches this differently.
- Cause: Using large-volume rectangular glass chambers for TLC, which require 100-250 mL of solvent per run, especially when testing multiple mobile phase compositions [7] [8].
- Solution: Employ a twin-trough chamber for HPTLC. This chamber uses a fraction of the solvent (e.g., ~10-20 mL) because only one trough is filled with mobile phase, while the other can hold the plate for saturation or an acid/base for conditioning [9] [7]. For the highest efficiency in method optimization, use an Automated Multiple Development (AMD) system, which uses a minimal solvent volume in a graded development sequence [10].
FAQ 2: I need to analyze many samples, but my HPLC runs are slow and solvent-intensive. Is there a more efficient chromatographic technique? Yes, HPTLC is specifically designed for high-throughput analysis with minimal solvent use per sample.
- Cause: HPLC is an online technique where one sample is analyzed per run, consuming the entire mobile phase volume for that single analysis. Furthermore, additional solvent is required for column washing and equilibration [9].
- Solution: HPTLC is an off-line technique where multiple samples are run in parallel on the same plate. A single HPTLC plate can separate 15 to 20 samples (or more) simultaneously using the same solvent volume (typically ~10-20 mL) that would be required for a single HPLC run [9] [11]. This drastically reduces the solvent consumption per sample analyzed.
FAQ 3: Why are my quantification results on my HPTLC plate inconsistent? Inconsistent quantification can stem from several steps in the workflow, but the solution often lies in greater automation.
- Cause: Manual sample application using capillaries can lead to uneven spot sizes and loading. Inconsistent derivatization (e.g., manual dipping or spraying) can also create uneven color or fluorescence development, affecting the scanning results [9].
- Solution:
- Automate Sample Application: Use an auto-sampler (e.g., Camag Linomat) that sprays samples as narrow, homogeneous bands. This improves reproducibility and resolution [9] [7].
- Automate Derivatization: Use a chromatogram immersion device or an automatic derivatizer to ensure the reagent is applied with uniform speed, time, and coverage [9].
- Validate the Method: Ensure your method is validated according to ICH guidelines for parameters like linearity, precision, and accuracy, as demonstrated in validated methods [12] [13] [14].
FAQ 4: Can I confirm the identity of a separated compound directly from the HPTLC plate? Yes, this is a key advantage of HPTLC. Unlike HPLC, the separated analytes remain on the plate after development.
- Solution: The target band can be scraped off the plate and the compound eluted for further analysis using techniques like High-Resolution Mass Spectrometry (HRMS) for structural elucidation [11]. Furthermore, multiple detection methods (e.g., UV/Vis, fluorescence, and effect-directed analysis) can be performed on the same plate to gather complementary information [7] [11].
Troubleshooting Guide
| Problem | Possible Cause | Recommended Solution |
|---|---|---|
| Streaking or poor resolution | Sample applied as a spot instead of a band; Sample overload. | Filter your sample and use an auto-sampler to apply narrow bands for higher resolution [9] [10]. |
| Irreproducible Rf values | Chamber saturation not achieved; solvent evaporation. | Pre-saturate the chamber with mobile phase vapors for at least 20 minutes using a twin-trough chamber or an Automatic Developing Chamber (ADC) [9] [7]. |
| High background noise in scanning | Dirty plate; non-specific derivatization. | Pre-wash HPTLC plates with methanol and activate in an oven before use. Ensure the derivatization reagent is specific and the plate is properly dried post-derivatization [7] [13]. |
| Solvent front runs irregularly | Uneven plate surface; chamber not level. | Use high-quality, pre-coated HPTLC plates with a uniform particle size. Ensure the development chamber is placed on a level surface [8] [10]. |
Quantitative Solvent Use Comparison
The following table summarizes the typical solvent consumption for the three techniques, highlighting the efficiency of HPTLC.
| Parameter | Traditional TLC | HPTLC | HPLC |
|---|---|---|---|
| Typical Solvent Volume per Run | 100 - 250 mL [7] [8] | 10 - 20 mL [9] [7] | Varies per run; typically 10s to 100s of mL per single sample [9] |
| Samples per Run | < 10 [8] | 15 - 20+ [9] [11] | 1 |
| Solvent Volume per Sample | High | Very Low | High |
| Key Reason for Solvent Use | Large volume chambers; single-use. | Small volume chambers; parallel analysis. | Column washing & equilibration; single-sample serial analysis [9]. |
Experimental Protocol: HPTLC Densitometric Analysis
The following is a generalized experimental protocol for quantification using HPTLC, as referenced in several studies [12] [13] [14].
1. Sample Preparation:
- Dissolve the analyte in an appropriate solvent (e.g., methanol, acetonitrile).
- Critical Step: Filter the sample through a 0.45 µm syringe filter to prevent clogging of the automated applicator syringe [9].
- Prepare standard solutions at known concentrations for the calibration curve.
2. Plate Preparation:
- Use commercial pre-coated HPTLC plates (e.g., silica gel 60 F254).
- Pre-wash plates, if necessary, by developing with methanol. Activate in an oven at 105-110 °C for 15 minutes before use [7] [13].
3. Automated Sample Application:
- Use an auto-sampler (e.g., Camag Linomat).
- Program the instrument to apply samples and standards as bands (e.g., 6-8 mm wide) onto the baseline [13].
- Example: In the tenoxicam study, a constant application rate of 150 nL/s was used to apply bands 10 mm from the bottom of the plate [13].
4. Chromatogram Development:
- Pour the optimized mobile phase into a twin-trough chamber.
- Saturate the chamber for 20-30 minutes at room temperature [9] [7].
- Place the spotted plate in the trough and allow the mobile phase to ascend (e.g., 80 mm from the application position).
5. Derivatization & Detection:
- Air-dry the plate thoroughly to evaporate the mobile phase.
- Derivatize by uniformly dipping or spraying with a suitable reagent (e.g., sulfuric acid for charring, or anisaldehyde for terpenoids).
- Heat the plate on a plate heater or in an oven to develop color/fluorescence [10].
6. Scanning and Quantification:
- Use a TLC scanner to perform densitometry at the analyte's appropriate wavelength (e.g., 379 nm for tenoxicam) [13].
- Perform a multi-wavelength scan (190-900 nm) initially to determine the optimal wavelength for your compound [9].
- The software generates a densitogram (peak area vs. Rf) and calculates the quantity of the analyte in unknown samples by interpolation from the standard calibration curve.
Research Reagent Solutions
The following table lists key materials and reagents essential for conducting HPTLC analysis as per the cited methodologies.
| Item | Function | Example from Literature |
|---|---|---|
| HPTLC Plates (Silica gel 60 F254) | The stationary phase for compound separation. The F254 indicator allows for UV visualization at 254 nm. | Aluminum-backed, 20x20 cm, 0.25 mm thickness [12] [13]. |
| Auto-sampler (e.g., Linomat) | Precisely applies samples as narrow bands, improving resolution and quantification reproducibility. | Used in methods for tenoxicam and florfenicol/meloxicam [12] [13]. |
| Twin-Trough Development Chamber | Allows chamber saturation and development with a low volume of mobile phase. | Used for developing plates in a pre-saturated environment [7] [13]. |
| TLC Scanner Densitometer | Quantifies the separated compounds by measuring the absorbance or fluorescence of the bands. | Camag TLC Scanner III controlled by WinCATS software [12] [13]. |
| HPTLC-grade solvents | Used for mobile phase preparation and sample dissolution; high purity ensures reproducible chromatography. | Toluene, ethyl acetate, methanol, glacial acetic acid [12] [13]. |
HPTLC Experimental Workflow
Frequently Asked Questions (FAQs)
1. What makes HPTLC an "eco-friendly" technique compared to HPLC? HPTLC is considered eco-friendly because it consumes significantly less solvent per sample, has lower energy requirements, and generates less waste. A typical HPTLC analysis uses <10 mL of solvent and can run multiple samples in parallel (5-15 minutes), whereas HPLC is a serial technique with analysis times often exceeding 30 minutes and much higher solvent consumption [15]. Quantitative greenness assessment tools like the Modified Green Analytical Procedure Index (MoGAPI) and Analytical GREEnness Metric (AGREE) consistently give HPTLC high ratings due to its minimal solvent volumes and energy requirements [15].
2. I keep getting smeared spots instead of sharp bands. How can I fix this? Smeared spots or streaking are commonly caused by sample overloading or an inappropriate mobile phase [16] [2]. To resolve this:
- Reduce sample concentration or application volume.
- Ensure your sample is completely solubilized in a solvent that is compatible with the mobile phase [17] [2].
- For acidic or basic compounds, add modifiers to the mobile phase (e.g., 2-3 drops of acetic acid or triethylamine per 100 mL) to suppress ionization and tailing [2].
3. Why are my Rf values inconsistent between runs? Inconsistent Rf values are often a result of improper chamber saturation or variations in plate activation [18]. For reproducibility:
- Pre-saturate the development chamber for at least 20-30 minutes by lining it with filter paper soaked in the mobile phase [18].
- Activate the plate by heating in an oven at 110-120°C for 20-30 minutes before use to remove adsorbed moisture, especially if the plates have been exposed to humidity [17] [18] [2].
- Always use the same mobile phase preparation and maintain a constant development distance and temperature.
4. What causes ghost peaks or high background in my chromatograms? Ghost peaks can arise from several sources, including contaminants in solvents or sample vials, carryover from previous injections, or a contaminated HPTLC plate [4]. To identify and eliminate them:
- Run a blank injection (solvent only) to spot contaminant peaks [4].
- Use fresh, high-purity mobile phase and filter solvents if necessary.
- Pre-wash your HPTLC plates by developing them with methanol or your intended mobile phase before sample application, then re-activate [18] [2].
Troubleshooting Guides
Issue 1: Poor Resolution or Overlapping Spots
Problem: Compounds are not well separated; spots are too close or co-elute.
| Possible Cause | Diagnostic Check | Solution |
|---|---|---|
| Mobile phase too strong | All compounds have high Rf values (>0.8) [2]. | Systematically decrease mobile phase polarity. For normal-phase, reduce the percentage of polar solvents like ethyl acetate or methanol [2]. |
| Mobile phase too weak | All compounds have low Rf values (<0.2) [2]. | Systematically increase mobile phase polarity by adding more of the polar modifier [2]. |
| Sample overload | Spots are large, diffuse, or streaky [16]. | Dilute the sample or apply a smaller volume. Ensure the application band is narrow (ideally ≤1 mm) [17] [2]. |
| Inadequate chamber saturation | Solvent front runs unevenly or crookedly [16]. | Ensure the chamber is saturated with mobile phase vapor for at least 20-30 minutes before development [18]. |
Issue 2: Irregular Spot Shapes (Tailing, Streaking, Fronting)
Problem: Spots are not compact and round or oval, making quantification difficult.
| Possible Cause | Diagnostic Check | Solution |
|---|---|---|
| Sample solvent too strong | Spot may have a "doughnut" or smeared appearance, especially for early-eluting peaks [4]. | Re-dissolve the sample in a solvent that is weaker than the mobile phase or of the same composition [4] [2]. |
| Interactions with active sites | Tailing is observed, particularly for basic compounds. | Add a competing agent like triethylamine to the mobile phase to block active silanol sites on the silica gel [4] [2]. |
| Damaged or contaminated plate | Irregularities are present across multiple samples. | Pre-wash and re-activate the plate. Always handle plates by the edges to avoid contamination from skin oils [17] [2]. |
Issue 3: Low or Inconsistent Signal Intensity
Problem: Spots are faint, difficult to visualize, or intensity varies between identical samples.
| Possible Cause | Diagnostic Check | Solution |
|---|---|---|
| Sample concentration too low | Spots are faint even after derivatization. | Concentrate the sample or use multiple applications to the same spot, drying between each application [16]. |
| Improper derivatization | Spots are not visible after treatment with a detection reagent. | Ensure the plate is completely dry before dipping it into the derivatization reagent to prevent spot dissolution [17]. Keep heating time and temperature constant if heat is required [17]. |
| Inconsistent application | Band width or position varies between tracks. | Use an autosampler for precise, computer-controlled application. Keep the band position and width constant for all samples [17]. |
GAC Metrics and Solvent Consumption Data
The following table summarizes key metrics that demonstrate the greenness of HPTLC, particularly when compared to other chromatographic methods like HPLC.
Table: Greenness Comparison of HPTLC vs. HPLC
| Metric | HPTLC | HPLC (for comparison) | Reference |
|---|---|---|---|
| Analysis Time | 5-15 minutes for multiple samples in parallel [15]. | Often >30 minutes per sample (serial analysis) [15]. | [15] |
| Solvent Consumption per Analysis | <10 mL total volume [15]. | Typically hundreds of mL per sample [15]. | [15] |
| Energy Consumption | Low (often operates at ambient pressure/temperature) [15]. | High (due to high-pressure pumps and column ovens) [15]. | [15] |
| Waste Generation | Minimal (small solvent volume, single plate) [15]. | Significant (organic solvent waste from eluent) [15]. | [15] |
| Quantitative Greenness Score | High ratings on AGREE and MoGAPI metrics [15]. | Lower scores due to higher solvent and energy use [15]. | [15] |
Experimental Protocol: Implementing a Green HPTLC Method with QbD
This protocol outlines a systematic, Quality by Design (QbD) approach to developing an HPTLC method that minimizes solvent consumption from the start [18].
1. Define Method Intent
- Clearly state the analytical goal (e.g., identity testing, purity check, quantification).
- Identify the Critical Method Attributes (CMAs), such as resolution between key compounds, Rf value, and spot capacity.
2. Risk Assessment and Screening
- Identify Critical Method Parameters (CMPs) that can impact the CMAs. These typically include:
- Mobile phase composition and ratio
- Volume of mobile phase used
- Development distance
- Chamber saturation time
- Use a structured approach (e.g., a factorial design) to understand the effect of these parameters on your separation.
3. Method Optimization
- Based on the screening results, optimize the CMPs to achieve the desired CMAs with minimal solvent use.
- The PRISMA model is a systematic optimization protocol for this stage. It involves three steps [2]:
- Polarity Optimization: Test solvents of different polarities (e.g., hexane, ethyl acetate, methanol).
- Selectivity Optimization: Test ternary mixtures of the selected solvents to fine-tune separation.
- Volume Optimization: Finally, adjust the total volume of the mobile phase to the minimum required for a successful development.
4. Method Control
- Once optimal conditions are found, establish a control strategy (e.g., define acceptable ranges for mobile phase composition, chamber saturation time) to ensure the method remains robust and green over its lifecycle.
The Scientist's Toolkit: Essential Materials for Green HPTLC
Table: Key Research Reagent Solutions and Materials
| Item | Function in HPTLC | Green Consideration |
|---|---|---|
| Pre-coated HPTLC Plates (Silica gel 60 F₂₅₄) | The stationary phase for separation. Smaller, uniform particles (5-10 µm) provide higher resolution per unit distance than standard TLC plates [17] [18]. | Enables faster development, reducing solvent use. The F₂₅₄ indicator allows for UV detection without mandatory chemical derivatization, reducing reagent waste [15]. |
| Micro-syringe or Autosampler (e.g., Linomat) | For precise sample application as narrow bands. This is critical for obtaining high resolution and accurate quantification [17] [18]. | Precise application prevents the need for repeat analyses due to poor results, saving sample, solvent, and time. |
| Twin-trough Development Chamber | A chamber designed for pre-saturation of the mobile phase vapor, leading to more reproducible and sharper separations [18]. | The twin-trough design uses less mobile phase for saturation compared to traditional chambers, aligning with waste prevention principles [15]. |
| Green Solvent Suite (e.g., Ethyl Acetate, Ethanol, Methanol) | Components of the mobile phase. Ethyl acetate and ethanol are considered more environmentally preferable than solvents like chloroform or hexane [2]. | Selecting safer solvents is a core principle of Green Analytical Chemistry. Using minimal volumes in optimized mobile phases directly reduces environmental impact [15] [2]. |
| Densitometer Scanner | Instrument for quantitative analysis by measuring the intensity of spots directly on the plate [12] [18]. | Enables quantification without eluting compounds, which would generate additional solvent waste. |
The Role of Stationary Phase Technology in Solvent Reduction
Troubleshooting Guides
Table 1: Troubleshooting Common HPTLC Issues for Solvent Reduction
| Problem | Possible Cause | Solution | Impact on Solvent Consumption |
|---|---|---|---|
| Poor resolution requiring method re-runs | Inappropriate stationary phase selectivity for analytes [19] | Select a stationary phase with complementary chemistry (e.g., CN, Diol, RP-18) [19] | Prevents multiple development attempts, saving 5–10 mL solvent per run [15] |
| Streaked or tailed bands | Active sites on standard silica gel; sample overload [4] | Use premium purity plates or modified silica phases (e.g., NH₂) to reduce active interactions [19] [4] | Eliminates need for stronger, more toxic solvent modifiers to fix peak shape [20] |
| Inconsistent Rf values between runs | Uncontrolled humidity affecting the stationary phase [17] [19] | Use RP-modified plates, which are less humidity-sensitive; pre-activate silica plates [17] [19] | Prevents repeated optimization runs, reducing total solvent waste [15] |
| High baseline noise in quantification | Contaminated stationary phase or coarse particles [17] | Filter samples; use HPTLC-grade plates with finer, uniform particles (5–6 µm) [17] [19] | Avoids redundant analyses, ensuring first-run success and minimal solvent use [21] |
| Inadequate separation of complex mixtures | Limited peak capacity of standard TLC [15] [19] | Employ AMD 2 with specialized plates for gradient elution on a single plate [19] | Replaces multiple HPLC runs (≥30 mL solvent each) with one AMD run (<10 mL total) [15] |
Table 2: Stationary Phase Selection Guide for Green HPTLC
| Stationary Phase Type | Key Mechanism | Ideal Application | Green Benefits & Solvent Reduction |
|---|---|---|---|
| Silica Gel 60 F₂₅₄ | Normal-phase adsorption [19] | General screening; phytochemicals [20] [19] | Faster development (3–20 min); high throughput reduces solvent use per sample [19] |
| RP-18 (Reversed-Phase) | Partitioning into C18 chains; hydrophobic interactions [19] | Polar compounds; water-rich mobile phases [19] | Enables use of high-water content mobile phases (up to 100%), reducing organic solvent toxicity [20] [19] |
| CN (Cyanopropyl) | Dual-mode: normal-phase and reversed-phase [19] | 2D separations of diverse analytes [19] | Enables orthogonal 2D separation on one plate without solvent-miscibility issues, replacing two separate methods [10] [19] |
| Diol | Moderately polar; hydrogen bonding [19] | Sensitive molecules; proteins [19] | Prevents catalytic degradation of analytes, avoiding re-analysis and solvent waste [19] |
| NH₂ (Aminopropyl) | Weak ion-exchange; hydrogen bonding [19] | Sugars, nucleotides, charged molecules [19] | Allows reagent-free detection (thermochemical fluorescence), eliminating derivatization reagent waste [19] |
| LiChrospher | Spherical silica particles for higher efficiency [19] | High-throughput trace analysis [19] | 20% faster run times and higher sensitivity directly reduce solvent consumption per analysis [19] |
Experimental Protocols
1. Plate Preparation and Sample Application
- Stationary Phase: Use pre-coated silica gel 60 F₂₅₄ HPTLC plates (10 x 10 cm, 0.2 mm thickness). For complex mixtures, consider LiChrospher plates for faster run times [19].
- Activation: Activate the plate by heating in an oven (e.g., 80°C for 10-15 minutes) to remove absorbed water, which ensures reproducible Rf values [17].
- Sample Application: Using an automated applicator (e.g., Camag Linomat 5), apply samples as 8 mm bands. Maintain a constant application position and band width for quantitative accuracy [17] [21]. Filter all samples through a 0.22 µm syringe filter to prevent clogging and contamination [17].
2. Chromatogram Development
- Mobile Phase Selection: Opt for eco-friendly solvent combinations. An ethyl acetate–ethanol system (7:3, v/v) has been successfully used for pharmaceutical analysis, aligning with Green Analytical Chemistry principles [21].
- Development Chamber: Use an automated development chamber (e.g., Camag ADC2) with a controlled environment (25 ± 0.5 °C, 40 ± 2% relative humidity). Pre-saturate the chamber for 25 minutes to achieve mobile phase vapour equilibrium, which improves separation sharpness [21].
- Development: Develop the plate in the ascending direction to a distance of 80 mm. The entire development process typically takes 5-15 minutes, consuming less than 10 mL of mobile phase [15] [21].
3. Derivatization and Densitometric Analysis
- Plate Drying: After development, dry the plate completely using a blow-dryer or in a stream of warm air. This prevents dissolution of compounds during derivatization [17].
- Derivatization (if needed): Immerse the plate in a derivatization reagent (e.g., anisaldehyde) for a few seconds only. Prolonged dipping can dissolve separated compounds [17]. For quantitative analysis, use a heating oven with controlled time and temperature for even heat distribution [17].
- Scanning and Quantification: Scan the plate using a densitometer (e.g., Camag TLC Scanner 3) in reflectance-absorbance mode. Use software to record peak areas and perform quantification [21].
Green HPTLC Workflow
Frequently Asked Questions (FAQs)
Q1: How does the choice between TLC and HPTLC plates directly impact solvent usage? HPTLC plates use sorbents with much smaller (5–6 µm), more uniform particles than standard TLC plates (10–12 µm) [19]. This results in higher packing density and superior separation efficiency, which reduces development time and solvent consumption. HPTLC typically uses <10 mL of solvent with analysis times of 3–20 minutes, whereas older TLC methods are slower and less efficient [15] [19].
Q2: Can stationary phase technology really help meet regulatory guidelines for impurity profiling while being green? Yes. Modern HPTLC methods using advanced stationary phases can simultaneously quantify active pharmaceutical ingredients and mutagenic impurities, meeting stringent ICH guidelines [21]. These methods have been validated and show perfect scores on greenness assessment tools like AGREE and NEMI, proving that regulatory compliance and sustainability are achievable together [21].
Q3: What is the most significant advancement in stationary phases for reducing solvent consumption in complex separations? Automated Multiple Development (AMD) on specialized AMD HPTLC plates is a major advancement. This technique uses repeated development with a consistent solvent gradient on a single plate to resolve up to 40 components over a short distance [19]. This replaces the need for multiple, solvent-intensive HPLC runs, drastically cutting total solvent use [15].
Q4: How do reversed-phase (RP) HPTLC plates contribute to greener analysis? RP-HPTLC plates (e.g., RP-2, RP-8, RP-18, RP-18W) allow for the use of mobile phases with high water content [19]. The RP-18W plate can even be used with 100% water as the solvent [19]. This reduces or eliminates the need for toxic organic solvents, lowering the ecological footprint and toxicity of the analysis [20].
The Scientist's Toolkit: Research Reagent Solutions
Table 3: Essential Materials for Green HPTLC Method Development
| Item | Function in Solvent Reduction | Key Characteristics |
|---|---|---|
| HPTLC Plates (Silica Gel 60) | Core substrate for separation; finer particles enable faster runs and less solvent use [19] | Particle size 5-6 µm; 100-200 µm layer thickness; often with fluorescent indicator F₂₅₄ [19] |
| Modified Silica Phases (CN, Diol, NH₂) | Provide alternative selectivity to avoid solvent-intensive method re-development [19] | CN for dual-mode (NP/RP); Diol for H-bonding; NH₂ for weak ion-exchange [19] |
| RP-18W HPTLC Plates | Enable use of 100% aqueous mobile phases, eliminating organic solvent use [19] | Reversed-phase silica with low surface modification for 100% water tolerance [19] |
| Automated Development Chamber (ADC 2) | Ensures reproducible, controlled development conditions, preventing failed runs [21] | Controls temperature, humidity, and pre-saturation; critical for robust green methods [21] |
| TLC Scanner 3 with WinCATS | Enables precise densitometric quantification without the need for solvent-based elution for detection [21] | Measures reflectance/absorbance of zones directly on the plate; software manages data [21] |
| Green Mobile Phase Components | Replace toxic solvents (e.g., acetonitrile, chlorinated solvents) with safer alternatives [20] [21] | Ethanol, ethyl acetate, water; used in systems like ethyl acetate-ethanol (7:3) [21] |
Stationary Phase Selection
Regulatory and Economic Drivers for Sustainable Method Development
The development of High-Performance Thin-Layer Chromatography (HPTLC) methods is increasingly guided by the dual pressures of regulatory compliance and economic efficiency, with a specific focus on reducing solvent consumption. Conventional chromatographic methods often employ significant volumes of toxic solvents, creating environmental, safety, and cost concerns [22]. Sustainable method development addresses these issues by aligning with Green Analytical Chemistry principles, creating analytical processes that are not only environmentally responsible but also cost-effective and compliant with evolving regulatory standards [22]. This technical support center provides practical guidance for researchers navigating this complex landscape, offering troubleshooting advice and methodologies for implementing sustainable HPTLC practices in pharmaceutical analysis.
Core Drivers: Regulatory Frameworks and Economic Incentives
Regulatory Requirements
Global regulatory bodies have established clear guidelines for solvent use in pharmaceutical analysis, primarily focusing on controlling residual solvent levels and promoting greener alternatives.
USP <467> Residual Solvents: The United States Pharmacopeia requires rigorous testing and classification of residual solvents in pharmaceuticals. It categorizes solvents into three classes [23]:
- Class 1: Solvents to be avoided (known human carcinogens, strong environmental hazards), such as benzene and carbon tetrachloride.
- Class 2: Solvents to be limited (nongenotoxic animal carcinogens, other irreversible toxicities), including methanol and acetonitrile, with strict concentration limits (ppm).
- Class 3: Solvents with low toxic potential (e.g., ethanol, ethyl acetate), considered lower risk but still subject to good manufacturing practices.
European Pharmacopoeia (Chapter 2.4.24): The recently revised chapter on residual solvents provides updated guidelines for identification and control, emphasizing clearer analytical procedures and including additional solvents like cyclopentyl methyl ether and tert-butyl alcohol [24]. The revision aims to improve usability with a more structured approach covering non-targeted and targeted analysis.
ICH Q3C Guidelines: This international standard provides a comprehensive framework for classifying residual solvents and establishing permitted daily exposures, requiring manufacturers to justify solvent choices and demonstrate rigorous testing using validated methods like Headspace Gas Chromatography (HS-GC) and HS-GC-MS [23].
Economic Incentives
Beyond regulatory compliance, compelling economic factors drive the adoption of sustainable HPTLC methods:
Solvent Cost Reduction: Solvent consumption constitutes a major operational expense. Methods that reduce solvent volumes or replace expensive solvents with cheaper, greener alternatives directly lower analysis costs [22] [6].
Waste Management Savings: Reduced solvent usage decreases costs associated with hazardous waste disposal, storage, and transportation, contributing significantly to long-term economic benefits [25].
Capital Efficiency: Techno-economic assessments reveal that technologies with reduced solvent consumption can achieve lower capital costs (up to 50% reduction estimated for some solvent-based extraction technologies) and benefit from economies of scale, with scale factors as low as 0.72 [25].
Table: Economic Impact of Sustainable Practices in Analytical Methods
| Economic Factor | Impact of Sustainable Practices | Evidence |
|---|---|---|
| Solvent & Material Costs | Reduced volumes and replacement with cheaper alternatives | Eco-friendly HPTLC uses simpler mobile phases [6] |
| Waste Management | Lower disposal and handling costs for hazardous waste | Reduced solvent usage decreases waste [22] |
| Capital Investment | Potential for lower equipment and facility costs | Solvent-based technologies estimated 50% lower capital costs [25] |
| Scale Efficiency | Significant cost reduction at larger production scales | Scale factor of 0.72 for solvent-based technologies [25] |
Troubleshooting Guide: Sustainable HPTLC Method Development
FAQ 1: How can I effectively reduce solvent toxicity in HPTLC method development?
Challenge: Balancing analytical performance with reduced environmental and safety hazards.
Solution:
- Systematic Solvent Replacement: Begin by mapping your current solvent system against the AGREE (Analytical GREEnness) metric or similar green assessment tools [22] [12]. Replace Class 1 and 2 solvents with Class 3 solvents wherever possible.
- Binary Mobile Phase Optimization: Investigate combinations of greener solvents like ethyl acetate, ethanol, and water with small percentages of modifiers like glacial acetic acid or triethylamine to achieve desired separation [6] [12]. For example, a dichloromethane-acetone system (8.5:1.5 v/v) has been successfully used for antiviral drug analysis [6].
- Troubleshooting Tip: If separation efficiency decreases after switching to greener solvents, adjust the ratio of solvents in small increments (2-5%) and consider temperature control during development to improve reproducibility.
FAQ 2: What strategies can minimize solvent consumption without compromising resolution?
Challenge: Maintaining peak resolution and spot compactness while reducing mobile phase volumes.
Solution:
- Mobile Phase Optimization: Utilize method development techniques to identify the minimum solvent volume required for adequate separation. Techniques such as design of experiments (DoE) can systematically optimize solvent ratios for maximum efficiency with minimum consumption.
- Stationary Phase Selection: Choose appropriate stationary phases (reverse-phase vs. normal-phase) that provide better separation with less solvent. For instance, reverse-phase HPTLC using isopropanol:water:glacial acetic acid has demonstrated excellent linearity (R² = 0.9998) with reduced solvent consumption [22].
- Troubleshooting Tip: If spots show tailing or inadequate separation with reduced solvent volumes, ensure proper chamber saturation (typically 15-30 minutes) and use smaller development distances to maintain solvent front consistency.
FAQ 3: How do I validate that my green HPTLC method is truly sustainable?
Challenge: Quantifying and documenting the environmental benefits of new methods.
Solution:
- Standardized Greenness Assessment: Employ multiple validated metrics to comprehensively evaluate your method's sustainability:
- AGREE Metric: Provides a comprehensive score (0-1) based on multiple green analytical chemistry principles. Sustainable HPTLC methods have achieved scores of 0.82-0.83 [22].
- Analytical Eco-Scale: Assesses penalty points based on hazardous chemical usage, energy consumption, and waste generation [6].
- GAPI (Green Analytical Procedure Index): Evaluates environmental impact across the entire analytical procedure [6].
- Documentation for Regulatory Submission: Include greenness assessment results in regulatory submissions to demonstrate alignment with environmental sustainability principles, which is increasingly valued by regulatory agencies [23].
Table: Comparison of Green Assessment Tools for HPTLC Methods
| Assessment Tool | Key Parameters Measured | Scoring System | Reported Scores for Green HPTLC |
|---|---|---|---|
| AGREE | Multiple principles of GAC, energy consumption, waste generation | 0-1 (Higher is greener) | 0.82-0.83 [22] |
| Analytical Eco-Scale | Hazard of reagents, instruments, and waste | Penalty points (Lower is greener) | Applied to REM/LNZ/RIV analysis [6] |
| GAPI | Entire analytical procedure from sample collection to final determination | Pictogram with 5 pentagrams | Applied to REM/LNZ/RIV analysis [6] |
| AGREEprep | Environmental impact of sample preparation | 0-1 (Higher is greener) | 0.73-0.77 for sample prep [22] |
Experimental Protocols for Sustainable HPTLC
Protocol 1: Developing a Green HPTLC Method for Pharmaceutical Analysis
This protocol outlines the development of an eco-friendly HPTLC method based on published sustainable approaches [22] [6].
Materials and Reagents:
- HPTLC Plates: Silica gel 60 F254 aluminum plates (5 μm particle size, 0.25 mm thickness) [6] [12]
- Mobile Phase: For normal-phase: n-butanol:ethyl acetate; For reverse-phase: isopropanol:water:glacial acetic acid [22]
- Sample Application: Automated applicator (e.g., CAMAG Linomat V) with 100 μL syringe
- Detection: Densitometric scanner with deuterium lamp, scanning at appropriate wavelength (e.g., 254-265 nm)
Procedure:
- Mobile Phase Selection: Test binary and ternary mixtures of Class 3 solvents (ethanol, ethyl acetate, water) with small percentages of modifiers.
- Plate Preparation: Cut HPTLC plates to required size (typically 10×10 cm or 20×10 cm) and precondition if necessary.
- Sample Application: Apply samples as bands (4-8 mm width) 1.0 cm from bottom edge using nitrogen gas aspirator.
- Chromatographic Development: Develop in twin-trough chamber pre-saturated with mobile phase for 15-30 minutes at room temperature.
- Detection and Visualization: Dry plates thoroughly and scan at selected wavelength with densitometer.
- Validation: Validate method according to ICH Q2(R2) guidelines for linearity, accuracy, precision, and robustness.
Protocol 2: Greenness Assessment Using AGREE Metric
Procedure:
- Data Collection: Compile data on all method parameters: solvent types and volumes, energy consumption, waste generation, sample size, and throughput.
- Software Application: Use the AGREE open-access software (available at most analytical chemistry software repositories).
- Parameter Input: Input all collected data into the 12 principle-based segments of the software.
- Interpretation: Review the circular output diagram and overall score (0-1). Scores >0.75 indicate excellent greenness [22].
Essential Research Reagent Solutions
Table: Key Reagents for Sustainable HPTLC Method Development
| Reagent/Material | Function in HPTLC | Green Considerations | Example Applications |
|---|---|---|---|
| Silica gel 60 F254 plates | Stationary phase for separation | Reusable with proper cleaning | Standard for most HPTLC applications [6] [12] |
| Ethyl acetate | Mobile phase component | Class 3 solvent (low toxicity) | Used in dichloromethane:acetone system [6] |
| Ethanol | Mobile phase component | Class 3 solvent (low toxicity) | Alternative to methanol or acetonitrile |
| n-Butanol | Mobile phase component | Class 3 solvent (low toxicity) | NP-HPTLC for sorafenib [22] |
| Isopropanol | Mobile phase component | Class 3 solvent (low toxicity) | RP-HPTLC for sorafenib [22] |
| Glacial acetic acid | Mobile phase modifier | Minimal usage for pH adjustment | RP-HPTLC (0.05% in mobile phase) [22] [12] |
| Triethylamine | Mobile phase modifier | Minimal usage for peak shaping | Used in FLR/MEL method (0.10% in mobile phase) [12] |
| Water | Mobile phase component | Greenest possible solvent | RP-HPTLC applications [22] |
Visualization of Sustainable Method Development Framework
The following diagram illustrates the interconnected regulatory and economic drivers that shape sustainable HPTLC method development:
Sustainable Method Development Drivers
The economic assessment process for implementing sustainable methods involves multiple validation steps:
Economic Assessment Workflow
Practical Strategies for Minimizing Solvent Use in HPTLC Methods
Mobile phase optimization is a critical step in High-Performance Thin-Layer Chromatography (HPTLC) method development, directly influencing the separation efficiency, resolution, and analysis time. Within the broader context of reducing solvent consumption in research, selecting an optimal solvent system is not only a technical requirement for achieving valid results but also a fundamental aspect of sustainable laboratory practice. This guide provides targeted troubleshooting and experimental protocols to help researchers efficiently develop methods that minimize solvent use without compromising analytical performance.
Troubleshooting Common Mobile Phase Issues
Here are common issues encountered during mobile phase optimization and how to resolve them.
| Problem | Possible Cause | Solution |
|---|---|---|
| Streaking or Tailing Spots [2] [17] | - Sample overloading.- Acidic/basic compound interactions with active sites on the stationary phase.- Plate contamination. | - Reduce sample concentration or application volume [2].- Add 2-3 drops of modifier per 100 mL mobile phase (e.g., acetic acid for acids, triethylamine for bases) [2].- Pre-wash the plate with methanol or the intended mobile phase [2] [26]. |
| Insufficient Resolution (Rf < 0.2 or > 0.8) [2] [26] | - Mobile phase polarity is too high or too low.- Poor solvent system selectivity for the sample components. | - For low Rf: Increase mobile phase polarity (e.g., add more ethyl acetate or methanol) [2].- For high Rf: Decrease polarity (e.g., increase hexane proportion) [2].- Use a systematic approach like the PRISMA model to test ternary solvent mixtures [2]. |
| Irregular Solvent Front [2] [26] | - Insufficient chamber saturation.- Chamber atmosphere not equilibrated (humidity variations).- Scratches on the silica layer. | - Equilibrate the chamber with mobile phase for a minimum of 20 minutes before development [2].- Place a saturated filter paper inside the chamber wall to improve vapor saturation [2] [26].- Handle plates carefully by the edges to avoid damaging the surface [17]. |
Optimized Experimental Protocols for Reduced Solvent Consumption
Protocol 1: Systematic Mobile Phase Screening with the PRISMA Model
This systematic approach efficiently narrows down the optimal solvent system while minimizing trial runs and solvent waste [2].
- Select Solvents: Choose three solvents of different selectivity groups: a non-polar solvent (e.g., hexane), a medium-polarity solvent (e.g., dichloromethane), and a polar solvent (e.g., methanol).
- Purity Check: Ensure all solvents are of high analytical grade to prevent interference.
- Initial Run: Spot your sample on three different HPTLC plates. Develop each plate with one of the pure, selected solvents.
- Analyze Migration: Evaluate the Rf values. The ideal solvent will bring the analyte of interest to an Rf of approximately 0.5.
- Optimize with Mixtures: If no single solvent is ideal, create binary or ternary mixtures. For example, if a component is stuck at the origin (Rf ~0) with hexane, create mixtures of hexane and ethyl acetate in varying ratios (e.g., 9:1, 8:2, 7:3) to fine-tune the polarity.
- Final Adjustment: Add minimal amounts of modifiers (e.g., acids or bases) if tailing is observed.
Protocol 2: Eco-Friendly HPTLC-Densitometry for Pharmaceutical Quantification
This validated protocol demonstrates a specific, solvent-efficient mobile phase for analyzing a drug combination, adaptable for other compounds [12] [21].
- Objective: Simultaneous quantification of multiple active pharmaceutical ingredients with minimal solvent use.
- Stationary Phase: Silica gel 60 F₂₅₄ HPTLC plates (e.g., 10x10 cm or 20x20 cm) [12] [21].
- Mobile Phase: Ethyl acetate–ethanol (7:3, v/v) [21] or a quaternary system like glacial acetic acid–methanol–triethylamine–ethyl acetate (0.05:1.00:0.10:9.00, v/v) [12].
- Methodology:
- Sample Application: Apply samples as 6-8 mm bands using an automated applicator (e.g., Camag Linomat 5) [12] [21].
- Development: Develop the plate in a twin-trough or automated development chamber pre-saturated with mobile phase vapor for 15-25 minutes [12] [21]. The development distance is typically 80 mm [12].
- Densitometry: Scan the developed and dried plate at a selected wavelength (e.g., 230 nm or 254 nm) using a TLC scanner [12] [21].
The following workflow summarizes the key steps in the eco-friendly HPTLC method development process:
Frequently Asked Questions (FAQs)
What is the ideal Rf range for the best separation, and how does it relate to solvent consumption?
The optimal Rf range is between 0.2 and 0.6, with the best separation often achieved around Rf = 0.3 [2] [27] [26]. Targeting this range from the beginning avoids the need for multiple optimization runs with poorly migrating or co-eluting compounds, thereby reducing the total volume of solvent used in method development.
How can I make my HPTLC mobile phase more environmentally friendly?
- Use Smaller Plates: Cutting standard 20x20 cm plates to smaller dimensions (e.g., 10x10 cm) significantly reduces the volume of mobile phase required for development [21].
- Choose Greener Solvents: Prefer solvents with lower toxicity, such as ethanol or ethyl acetate, over more hazardous options like chloroform or benzene [20] [21].
- Employ Efficient Chamber Designs: Use twin-trough chambers, which require less mobile phase for chamber saturation, or automated chambers that ensure highly reproducible results with minimal solvent [12] [26].
Why is chamber saturation so important, and what happens if it's skipped?
Chamber saturation ensures a uniform vapor pressure of the mobile phase throughout the chamber, leading to a regular solvent front and reproducible Rf values [2] [26]. Insufficient saturation causes irregular solvent flow and "edge effects," where solvent travels faster at the edges of the plate. This leads to poor separation and wasted analytical runs, increasing overall solvent consumption to achieve reliable results [2] [3].
The Scientist's Toolkit: Essential Reagents and Materials
The table below lists key materials required for the protocols described in this guide.
| Item | Function/Benefit |
|---|---|
| HPTLC Silica gel 60 F₂₅₄ Plates [8] [12] [21] | The standard stationary phase. Smaller particle size (5-7 µm) provides higher resolution and efficiency than standard TLC plates, allowing for better separation with shorter development distances and less solvent. |
| Ethyl Acetate and Ethanol [21] | Common, relatively eco-friendly solvents that can be blended to create an effective mobile phase for many applications, aligning with green chemistry principles. |
| Automated HPTLC System(e.g., CAMAG Linomat, ADC2, TLC Scanner) [12] [21] | Provides precise, automated sample application as bands, controlled development, and densitometric scanning. This automation drastically improves reproducibility and reduces human error, preventing the need for repeated experiments and saving solvents. |
| Twin-Trough Development Chamber [12] [26] | A specialized chamber that uses less mobile phase for saturation and development compared to a beaker, directly supporting solvent reduction goals. |
| Triethylamine / Glacial Acetic Acid [2] [12] | Mobile phase modifiers. Added in small quantities (e.g., 0.1-0.5%) to suppress the ionization of basic or acidic analytes, thereby reducing spot tailing and improving peak shape without a major increase in solvent volume or toxicity. |
The following diagram illustrates the critical preparatory steps for the HPTLC plate and development chamber, which are essential for achieving reproducible results:
Systematic Mobile Phase Development with PRISMA and Other Models
This guide provides troubleshooting support for researchers developing High-Performance Thin-Layer Chromatography (HPTLC) methods using systematic models like PRISMA. A core focus is aligning method development with Green Analytical Chemistry (GAC) principles to significantly reduce hazardous solvent consumption, minimizing the environmental footprint of pharmaceutical analysis without compromising analytical performance [22] [5].
Frequently Asked Questions (FAQs)
Q1: What is the PRISMA model and how does it specifically benefit green HPTLC method development?
The PRISMA model is a systematic, three-stage optimization procedure for chromatographic method development. It benefits green HPTLC by providing a structured framework to find the mobile phase with the best separation efficiency using the minimal amount of the least toxic solvents, thereby reducing waste and environmental impact [28] [29].
Q2: I am struggling with peak tailing and asymmetric bands in my HPTLC analysis. What mobile phase modifications can help?
The issue is often related to undesirable interactions between the analytes and the stationary phase. Incorporating additives can be highly effective:
- Ammonia: Adding a small percentage of ammonia (e.g., 0.1%) can improve peak shape for basic compounds by suppressing silanol interactions [5].
- Surfactants: Using surfactants like Sodium Dodecyl Sulphate (SDS) in the mobile phase can modify the stationary phase surface, leading to more symmetric bands. Research has shown this can bring tailing and asymmetry factors close to 1.0, indicating ideal band geometry [30].
Q3: How can I objectively prove that my new HPTLC method is more environmentally friendly?
You can use modern greenness assessment tools to quantify your method's environmental profile. These tools evaluate factors like solvent toxicity, energy consumption, and waste generation.
- AGREE Calculator: This software provides a composite score on a 0-1 scale, where 1 is ideal. Developed methods have achieved scores of 0.83 for RP-HPTLC and 0.82 for NP-HPTLC, confirming high environmental sustainability [22].
- NEMI Scale: This pictorial tool offers a quick visual summary of a method's greenness based on four key criteria [5].
- Eco-Scale Assessment: A high score on this scale indicates a more excellent environmental friendliness [5].
Q4: My method works well for standard solutions but fails with a complex sample matrix. How can I improve its robustness?
Complex matrices like sediments or plant extracts contain co-eluting substances that can interfere. An optimized cleanup step is crucial.
- HPTLC Cleanup Protocol: An optimized HPTLC cleanup using a solvent system like hexane:DCM (7:3, v/v) has been demonstrated to enhance the purity of target analytes in complex marine sediment samples from 66% to 96% without inducing fractionation, ensuring reliable results in downstream analysis [31] [32].
Troubleshooting Guides
Poor Separation or Inadequate Resolution
| Symptom | Possible Cause | Solution |
|---|---|---|
| Spots are too close together (low resolution). | Solvent strength is inappropriate. | Use the PRISMA model to adjust solvent strength systematically. Begin by testing neat solvents and then creating binary/ternary mixtures [28] [29]. |
| Spots are streaked or misshapen. | The mobile phase pH is wrong, causing unwanted ionic interactions. | For ionizable compounds, incorporate a buffer or pH-modifying agent like ammonia or acetic acid to ensure the analytes are in a single, non-ionic form [5]. |
| Spots remain at the origin or migrate too far. | The mobile phase is too weak or too strong. | Refer to the PRISMA model's solvent classification (e.g., from non-polar to polar) to select solvents with the correct eluotropic strength for your analytes [29]. |
Method Reproducibility Issues
| Symptom | Possible Cause | Solution |
|---|---|---|
| Inconsistent Rf values between runs. | Mobile phase composition is not prepared with sufficient precision. | Use calibrated glassware for mobile phase preparation. Ensure the mixture is homogenous before use. Document preparation procedures meticulously [33]. |
| Variable development conditions. | Chamber saturation (vapor phase) is not controlled. | Use an automated development chamber (ADC) with a fixed pre-saturation time (e.g., 25 minutes) to ensure a consistent vapor equilibrium, which is critical for reproducible Rf values [21]. |
| Environmental humidity and temperature fluctuations. | Perform chromatography in a controlled laboratory environment (e.g., 25 ± 0.5 °C, 40 ± 2% relative humidity) [21]. |
Experimental Protocols
Protocol: PRISMA-Based Mobile Phase Optimization for HPTLC
This protocol outlines the systematic development of a green mobile phase.
Workflow Overview
The following diagram illustrates the three-stage PRISMA optimization workflow.
Materials and Reagents
- HPTLC Plates: Silica gel 60 F₂₅₄ (e.g., Merck), often cut to 10x10 cm for efficiency [21].
- Solvents: A selection of solvents from different selectivity groups (e.g., acetic acid, acetonitrile, ethyl acetate, n-butanol, isopropanol, toluene) [22] [5] [21].
- Sample Applicator: Automated device (e.g., Camag Linomat 5) with a 100 µL syringe [21].
- Development Chamber: Automated Developing Chamber (ADC) with humidity and temperature control [21].
- Densitometer: TLC Scanner (e.g., Camag TLC Scanner 3) [21].
Step-by-Step Procedure
- Stage 1: Selection of Basic Parameters
- Stationary Phase: Choose a suitable phase (e.g., normal-phase silica gel or reversed-phase RP-18W).
- Vapor Phase: Decide on chamber saturation; a pre-saturated chamber (e.g., 25 min) is recommended for reproducibility [21].
- Neat Solvent Testing: Apply your standard mixture to the plate and develop it individually with 5-10 neat solvents of varying polarities and selectivities. This identifies which solvents provide some separation (Rf between 0.2 and 0.8).
Stage 2: Optimization via the PRISMA Model
- Solvent Combination: From the promising neat solvents, create a mixture of 2-3 solvents representing different selectivity groups. The PRISMA model helps visualize and determine the optimal volume ratio [28] [29].
- Strength Adjustment: If needed, adjust the overall strength by adding a small amount of a "modifier" solvent (e.g., n-hexane to decrease strength or water to increase it) to bring all analyte Rf values into the desired range.
Stage 3: Mode Selection and Transfer
- Select the final development mode (isocratic is preferred for simplicity).
- The optimized mobile phase from the PRISMA model is now ready for validation and application on the HPTLC system.
Protocol: HPTLC Cleanup for Complex Matrices
This protocol is for purifying analytes from complex samples like plant or sediment extracts before the main HPTLC analysis.
Workflow Overview
The diagram below summarizes the HPTLC cleanup protocol for complex samples.
Materials and Reagents
- HPTLC Plates: Silica gel 60 F₂₅₄
- Cleanup Solvents: HPLC-grade Hexane, Dichloromethane (DCM) [31] [32].
- Micro-syringe: For precise application of the crude extract.
- Scraper and Elution Device: To collect the target band and elute the analyte.
Step-by-Step Procedure
- Initial Extraction and Cleanup: Perform a primary extraction of the sample (e.g., sonication with organic solvent) followed by a preliminary silica gel column cleanup to remove bulk interferences [31].
- HPTLC Application: Concentrate the partially purified extract. Apply it as a band on the HPTLC plate.
- Chromatographic Development: Develop the plate in a chamber pre-saturated with the optimized cleanup solvent system, such as n-hexane:DCM (70:30, v/v) [31] [32].
- Band Visualization and Elution: Visualize the target analyte band under UV light (if applicable). Scrape the sorbent containing the target band carefully. Elute the purified analyte from the sorbent using a strong, volatile solvent.
- Re-analysis: The eluate, now highly purified, can be concentrated and analyzed by your main HPTLC method or other techniques like GC-IRMS.
The Scientist's Toolkit: Essential Reagents and Materials
Table: Key Reagents for Green HPTLC Method Development
| Reagent/Material | Function in HPTLC | Green & Practical Considerations |
|---|---|---|
| Ethyl Acetate | A common organic modifier in the mobile phase, offering intermediate polarity. | Considered one of the more environmentally acceptable solvents. Used in an ethyl acetate–ethanol (7:3, v/v) system for multi-drug analysis [21]. |
| Ethanol | Used as a less-toxic polar modifier in mobile phases. | A green solvent, preferable to acetonitrile or methanol. Serves as a key component in eco-friendly mobile phases [21]. |
| Isopropanol | Used in reversed-phase (RP) and normal-phase (NP) systems. | Used in a green NP-HPTLC method with n-butanol and in an RP-HPTLC method with water and acetic acid [22]. |
| n-Butanol | A solvent for normal-phase HPTLC. | Employed in a validated NP-HPTLC method with ethyl acetate, demonstrating excellent greenness scores [22]. |
| SDS (Surfactant) | Mobile phase additive to modify stationary phase and improve band shape. | Reduces tailing, leading to lower solvent consumption per analysis. Raman spectroscopy confirms its adsorption on the RP-18 W sorbent [30]. |
| Ammonia Solution | A volatile additive to control pH and suppress silanol activity. | Prevents peak tailing of basic compounds, improving resolution and avoiding the need for method re-development [5]. |
| Acetic Acid | A volatile additive for pH control in acidic ranges. | Used in an RP-HPTLC method (isopropanol:water:glacial acetic acid) to achieve sharp peaks and a high greenness score [22]. |
Data Presentation: Quantitative Outcomes
Table: Exemplary Green HPTLC Methods and Their Performance Metrics
| Analyte | Mobile Phase Composition | Greenness Assessment Score (AGREE) | Key Performance Data | Reference |
|---|---|---|---|---|
| Sorafenib (RP-HPTLC) | Isopropanol : Water : Glacial Acetic Acid | 0.83 | Linearity: 200-1000 ng/spot (R²=0.9998)Rf: 0.54 ± 0.2 | [22] |
| Sorafenib (NP-HPTLC) | n-Butanol : Ethyl Acetate | 0.82 | Linearity: 200-1200 ng/spot (R²=0.9993)Rf: 0.7 ± 0.2 | [22] |
| Carvedilol | Toluene : Isopropanol : Ammonia (7.5:2.5:0.1, v/v/v) | Excellent scores via NEMI, AGREE, and Eco-Scale | Linearity: 20-120 ng/band (R²=0.995)Rf: 0.44 ± 0.02 | [5] |
| Bisoprolol, Amlodipine, Impurity | Ethyl Acetate–Ethanol (7:3, v/v) | Perfect NEMI & AGREE scores; Carbon Footprint: 0.037 kg CO₂/sample | LOD: 3.56–20.52 ng/bandRf: 0.29 (HBZ), 0.72 (AML), 0.83 (BIP) | [21] |
Technical Support Center: Troubleshooting Guides and FAQs
This technical support center provides targeted troubleshooting guides and FAQs to help researchers overcome common challenges in HPTLC method development, with a specific focus on strategies that enable significant reduction in solvent consumption.
Troubleshooting Guide: HPTLC System Errors and Method Performance
| Problem Category | Specific Symptoms | Possible Causes | Recommended Solutions & Green Benefits |
|---|---|---|---|
| System & Automation | HPTLC PRO Module has a critical error (marked in Red) [34]. | Software communication error or module malfunction. | Perform a HPTLC PRO Module reset on the concerned module. If the error persists, execute a HPTLC PRO SYSTEM reset [34]. |
| Unwanted carrier detected; SYSTEM initialization failed [34]. | Physical obstruction on the conveyor system or plate misalignment. | Manually remove the carrier and perform a HPTLC PRO SYSTEM reinit [34]. | |
| Sample Application | Sample streaking or elongated spots [35]. | Sample overload; incompatible chemistry for compound type [35]. | Dilute the sample solution [35] [36]. For base-sensitive compounds, add 0.1–2.0% acetic acid to the mobile phase [35]. |
| Spots on the TLC plate are not visible after development [35]. | Low compound concentration; volatile compounds; high solvent level [35]. | Concentrate the sample by spotting multiple times in the same location, letting it dry between applications [35]. | |
| Separation Performance | Compounds are too close to the baseline or solvent front [35]. | Mobile phase polarity is inappropriate [35]. | If too close to the baseline, increase the proportion of polar solvent. If too close to the solvent front, decrease the proportion of polar solvent [35]. |
| Peaks tailing or fronting in quantitative analysis. | Column overload; secondary interactions with stationary phase; injection solvent mismatch [4]. | Reduce injection volume or dilute the sample. Ensure sample solvent strength is compatible with the initial mobile phase [4]. | |
| Unexpected Results | Ghost peaks or unexpected signals. | Carryover from prior injections; contaminants in mobile phase or sample vial [4]. | Run blank injections; clean the autosampler and injection needle; use fresh, high-purity mobile phases [4]. |
| Several unexpected spots are seen. | Accidental contamination of the TLC plate surface [16]. | Always handle plates by the edges to avoid contact with the sorbent layer [17] [16]. |
Frequently Asked Questions (FAQs)
Q1: How does automation in systems like the HPTLC PRO SYSTEM directly contribute to reducing solvent consumption?
Automation enhances solvent reduction through several mechanisms. The system uses built-in conveyors to transport plates between modules, eliminating manual intervention and the associated risk of method deviations [37] [38]. It supports the use of smaller HPTLC plates (20x10 cm) and enables the miniaturization of the entire separation process [37]. Furthermore, the software-controlled Module DEVELOPMENT supports the use of up to three different developing solvents with high precision, minimizing waste from manual preparation and use [37] [38]. By maximizing standardization, these systems ensure reproducible results, reducing the need for repeated experiments and the associated solvent use [37].
Q2: What are the key practical differences between TLC and HPTLC in the context of green chemistry?
The differences are significant and center on efficiency and miniaturization. HPTLC plates are manufactured with thinner, more uniform layers of smaller silica particles (∼10 µm), which provides greater resolving power per unit distance [36] [17]. This allows for shorter development distances (e.g., 4 cm for HPTLC vs. 8 cm for conventional TLC), which directly translates to faster development times and lower solvent consumption [36]. One study demonstrated that shortening the development distance from 8 cm to 4 cm reduced solvent use by 50%, albeit with a less than 30% reduction in theoretical plate number, indicating a favorable trade-off [36].
Q3: When transferring a method from TLC to HPTLC, why might the separation results be worse, and how can this be fixed?
This is often due to a stationary phase overload effect. HPTLC plates have a higher efficiency and smaller active layer, meaning they have a lower sample capacity than conventional TLC plates [36]. If the same sample amount is applied, overloading will occur, leading to band broadening and poor separation [36]. The solution is to dilute the initial sample, typically by 50% or more, and then re-apply [36]. This adjustment is a key part of method optimization during miniaturization and ultimately contributes to green goals by allowing the analysis of smaller sample volumes.
Q4: Besides automation, what other green chromatography techniques can be integrated with HPTLC?
Several emerging green techniques are highly compatible with HPTLC. Natural Deep Eutectic Solvents (NADES) are gaining traction as green alternatives for extraction and sample preparation due to their biodegradability and low toxicity [20]. Microextraction techniques, such as Solid-Phase Microextraction (SPME), also reduce solvent and sample volume requirements upstream of the chromatographic analysis [20]. Furthermore, effect-directed analysis (EDA) couplings, where miniaturized HPLC is fractionated onto an HPTLC plate, use HPTLC's power to separate co-eluting substances, enhancing the informational output per unit of solvent consumed [39].
Quantitative Comparison of Miniaturized Planar Techniques
The following table summarizes data on solvent use and performance for different chromatographic methods, highlighting the benefits of miniaturization [36].
| Technique | Typical Development Distance | Relative Solvent Consumption | Key Advantages & Notes |
|---|---|---|---|
| Conventional TLC | 8 cm | Baseline | Reference for comparison. |
| Short-Distance TLC | 4 cm | ~50% reduction vs. 8 cm TLC | Faster analysis, reduced solvent use, but may have lower efficiency [36]. |
| HPTLC | 4-6 cm | Lower than TLC | Higher efficiency per unit distance; may require sample dilution to avoid overload [36] [17]. |
| UTLC (Ultra TLC) | 1-3 cm | Significantly lower | Uses monolithic stationary phases (10 μm); very high efficiency for short distances [36]. |
| OPLC (Overpressure LC) | ~4 cm | Controlled, minimized | Mobile phase flow induced by external pressure; reduces development time [36]. |
Essential Experimental Protocol: Method Transfer and Optimization from TLC to HPTLC
This protocol outlines the critical steps for successfully adapting a conventional TLC method to a miniaturized, greener HPTLC method.
The Scientist's Toolkit: Key Research Reagent Solutions
| Reagent / Material | Function in Green HPTLC | Key Considerations |
|---|---|---|
| HPTLC Plates (e.g., silica gel 60) [17] | The stationary phase for separation. Thinner layers with smaller, uniform particles (∼10 µm) provide greater resolution per unit distance. | Enables shorter development distances, leading to direct reductions in solvent consumption [36] [17]. |
| Natural Deep Eutectic Solvents (NADES) [20] | Green alternatives for sample extraction and preparation before application to the HPTLC plate. | Offer biodegradability and low toxicity compared to traditional organic solvents [20]. |
| Derivatization Reagents (e.g., Anisaldehyde, Vanillin) [35] | Used to visualize compounds that lack chromophores/fluorophores by reacting to form colored products. | Requires careful, automated spraying to ensure even coverage and minimize reagent waste [37] [35]. |
| Green Mobile Phases (e.g., Ethanol-Ethyl Acetate-Water) | The liquid phase that carries the sample across the stationary phase. | Selecting less toxic, biodegradable solvent systems aligns with green chemistry principles and reduces hazardous waste [20] [35]. |
Technical Support Center: CAMAG AMD 2 System
The CAMAG AMD 2 System is an automated multiple development chamber for HPTLC that uses a patented technique of stepwise gradient elution to solve complex separation challenges with high resolution, precision, and repeatability [40]. Its principle involves repeatedly developing the HPTLC plate in the same direction, with each successive run extending over a longer migration distance and using a solvent of lower elution strength, creating a stepwise gradient [40]. This process, combined with vacuum drying between runs, results in extreme band sharpening, allowing baseline separation of up to 40 components [40].
Key Technical Specifications [40]:
- Plate Types: HPTLC glass plates 20 x 10 cm only
- Maximum Development Steps: 99
- Gas Supply: Nitrogen or clean air, 4.5–6 bar (60–90 PSI)
- Nitrogen Consumption: Approximately 1 liter per gradient step
- Operating Environment Temperature: 15° – 30° C
- Software: visionCATS for control and 21 CFR Part 11 compliance
Troubleshooting Guide
This section addresses common operational issues with the AMD 2 system.
Q1: The solvent front is detected unevenly or runs crookedly. What could be wrong?
- Possible Cause: The HPTLC plate might be improperly seated or making contact with the chamber walls or lining. An uneven layer thickness on the plate can also cause this.
- Solution: Ensure the plate is correctly positioned on the tray. Visually inspect the plate for any visible imperfections or damage to the sorbent layer before use [16].
Q2: No spots are visible on the plate after development and derivatization.
- Possible Cause 1: The sample concentration or amount applied is too low [16].
- Solution: Concentrate the sample solution or apply it multiple times to the same location on the plate, allowing the application solvent to dry completely between each application.
- Possible Cause 2: The development method or derivatization reagent is inappropriate for the analytes.
- Solution: Review the chemical properties of your target compounds and re-design the gradient or derivatization method. Ensure the reagent is fresh and properly applied.
- Possible Cause 3: The solvent level in the chamber was above the application point at the start of development.
- Solution: Always ensure the initial solvent level is below the spotted samples when the development cycle begins, or the sample will dissolve directly into the reservoir [16].
Q3: Samples are running as streaks rather than sharp bands.
- Possible Cause 1: The sample was overloaded (applied in excess) [16].
- Solution: Dilute the sample solution and re-apply a smaller volume.
- Possible Cause 2: The gradient profile is not optimal for the sample's polarity range.
- Solution: Re-optimize the gradient steps. The AMD 2 uses a decremental elution strength gradient; verify that the starting solvent is not too strong or the gradient descent too steep for the components [40].
- Possible Cause 3: The vacuum drying between steps is insufficient, causing bands to diffuse.
- Solution: Verify the vacuum pump is functioning correctly and that there are no leaks in the system.
Q4: The system fails to start a run or reports an error during initialization.
- Possible Cause 1: Insufficient gas pressure.
- Solution: Check that the nitrogen or air pressure is maintained between 4.5–6 bar (60–90 PSI) [40]. Ensure the gas supply valve is fully open and the regulator is functioning.
- Possible Cause 2: A component in the internal self-test failed.
- Solution: Run the diagnostic tests available in the instrument's firmware or service menu to check valve functions, switches, and the CCD sensor [41].
Frequently Asked Questions (FAQs)
Q1: How does AMD directly contribute to reducing solvent consumption in my lab? AMD is inherently a "green" technology. It consumes minimal solvent volumes (typically <10 mL per analysis) because it uses small, discrete amounts of solvent for each development step within a sealed chamber [15]. Furthermore, its high separation power allows for the analysis of complex samples without the need for lengthy, solvent-heavy HPLC runs, significantly reducing organic solvent waste overall [15].
Q2: Can I use the AMD 2 for quantitative analysis in a regulated environment? Yes. When operated with the visionCATS software, the AMD 2 system supports compliance with 21 CFR Part 11 and can be IQ/OQ (Installation Qualification/Operational Qualification) qualified, making it suitable for cGMP environments [40]. Quantitative analysis is performed using scanning densitometry on the focused bands [42].
Q3: My sample contains acids, bases, and neutral compounds. Can AMD handle this? Yes, this is a key strength of AMD. The stepwise gradient elution over increasing migration distances allows for the single-run separation of substances spanning a very wide polarity range, including acids, bases, neutral, hydrophilic, and lipophilic compounds [40].
Q4: What are the critical parameters to validate an HPTLC-AMD method? For any analytical method, validation is crucial. Key parameters to validate for an HPTLC-AMD method include [43]:
- Accuracy: Ability to correctly identify and/or quantify the analyte compared to a reference.
- Precision: Consistency of results under the same conditions (intra-day and inter-day).
- Specificity: Ability to distinguish the analyte from other components.
- Limit of Detection (LOD): Lowest concentration that can be detected.
- Robustness: Reliability of the method under small, deliberate variations in conditions.
Q5: What are common pitfalls during method development on the AMD 2? Common challenges and their solutions include [16] [42]:
- Pitfall: Poor resolution after many gradient steps.
- Solution: The initial solvent strength may be too high. Start with a weaker solvent and design a shallower gradient.
- Pitfall: Spots are not focused into sharp bands.
- Solution: Ensure the vacuum drying between steps is complete. Incomplete drying is a common cause of band broadening.
- Pitfall: Unreproducible results.
- Solution: Always use fresh, high-purity solvents. Control laboratory temperature and humidity, and ensure rigorous standardization of the entire workflow from sample application to derivatization.
Experimental Protocol: AMD for Complex Mixture Separation
The following diagram illustrates the core AMD procedure.
Detailed Methodology for Lipid Analysis [40]: This protocol is adapted for separating complex lipid samples, which are typical AMD applications.
Principle: The plate undergoes repeated developments with solvents of decreasing elution strength and increasing migration distance. The "focusing effect"—where compounds are re-concentrated at the interface of the advancing and receding solvent front during each drying step—results in extremely narrow, well-resolved bands [40].
Materials & Reagents:
- HPTLC Plates: Silica gel 60, glass-backed, 20 x 10 cm (e.g., Merck 1.05641) [40].
- AMD 2 System (CAMAG) with visionCATS software.
- Gas Supply: Nitrogen (99.995% purity) or clean, dry air.
- Solvents: HPLC grade n-hexane, dichloromethane, ethyl acetate, methanol.
- Sample Solution: Lipid extract dissolved in a suitable volatile solvent (e.g., chloroform) at a concentration of ~1-10 mg/mL.
Procedure:
- Sample Application: Apply the sample as 5-8 mm bands onto the HPTLC plate using an automated applicator (e.g., LINOMAT).
- Gradient Programming in visionCATS:
- Define a 10-step gradient in the software table. Example for lipids:
- Steps 1-9: Methanol-Dichloromethane (40:60 to 10:90 in decremental steps).
- Step 10: Methanol-Dichloromethane (10:90) isocratic.
- Set the migration distance for steps 1-9 to 40 mm, and the final step to 70 mm [40].
- Define a 10-step gradient in the software table. Example for lipids:
- System Initialization: Place the spotted plate in the AMD 2 chamber. Ensure solvent bottles are filled and gas pressure is at 5 bar. Start the automated run.
- Automated Execution: The system will automatically:
- Develop the plate for the specified distance.
- Remove the solvent by vacuum evaporation.
- Proceed to the next step with a weaker solvent and longer migration distance.
- Post-Chromatographic Derivatization: After the final drying step, remove the plate.
- Option 1: Dip in a charring reagent (e.g., copper sulfate in phosphoric acid) and heat at 120°C until bands appear.
- Option 2: For fluorescent compounds, image under UV 254 nm or UV 366 nm.
- Documentation & Quantification: Capture the chromatogram image using a TLC visualizer (e.g., CAMAG TLC Visualizer 2). Perform densitometric scanning for quantitative analysis.
The Scientist's Toolkit: Essential Research Reagents & Materials
The table below lists key materials required for effective AMD experiments.
Table 1: Key Research Reagent Solutions for HPTLC-AMD
| Item | Function / Purpose | Example & Notes |
|---|---|---|
| HPTLC Plates | The stationary phase for separation. | Silica gel 60 F₂₅₄, 20x10 cm glass plates [40]. The small, uniform particle size (5-6 µm) is crucial for high resolution. |
| Gradient Solvents | Mobile phase components for the stepwise elution. | HPLC-grade solvents (e.g., n-hexane, ethyl acetate, methanol, dichloromethane). Up to 5 bottles can be connected to the AMD 2 [40]. |
| Derivatization Reagents | Visualizing compounds that are not visible. | E.g., Anisaldehyde sulfuric acid for lipids/sugars; Natural Product reagent for specific herbal compounds [40]. |
| Application Solvent | Solvent for dissolving the sample. | Volatile solvents like methanol, chloroform, or dichloromethane that allow formation of compact application bands. |
| Calibration Standards | For method validation and quantitative analysis. | Authentic reference compounds for identifying and quantifying analytes in the sample [43]. |
Troubleshooting Decision Workflow
This flowchart provides a systematic approach to diagnosing and resolving common AMD problems.
Troubleshooting Guides
Troubleshooting Common HPTLC Experimental Issues
Table 1: Troubleshooting Guide for HPTLC Experiments Focused on Solvent Reduction
| Problem Category | Specific Symptom | Potential Cause | Solution | Preventive Measures |
|---|---|---|---|---|
| Sample Application | Irregular or diffuse bands during application. | Sample solution contains particulate matter; air bubbles in syringe [17]. | Filter sample through a 0.22 µm syringe filter; purge syringe to remove air bubbles [17]. | Ensure complete sample solubilization and careful syringe handling [17]. |
| Inconsistent Rf values between runs. | HPTLC plate not activated prior to use; variable environmental conditions [17] [21]. | Activate silica plate by heating in an oven before use [17]. | Standardize plate activation and control chamber saturation time/temperature [21]. | |
| Plate Development | Poor resolution or smearing of bands. | Inadequate chamber saturation; incorrect mobile phase composition; plate overloading [21]. | Ensure developing chamber is saturated with mobile phase vapor (e.g., for 15-25 min) [12] [21]. | Pre-saturate chamber; use precise mobile phase volumes; avoid over-concentrated samples [21]. |
| Detection & Imaging | Faint or non-existent bands after derivatization. | Plate not dried properly after development; insufficient derivatization agent [17]. | Dry plate thoroughly after run using a blow-dryer or oven [17]. | Ensure plate is completely dry before derivatization; standardize dipping duration [17]. |
| Uneven background or high noise during scanning. | Contamination from skin oils or debris on plate surface [17]. | Handle plates only by the edges or with clean forceps [17]. | Always wear gloves and avoid touching the active layer of the plate [17]. | |
| System Performance | Aborted steps or system in critical state. | Software or hardware communication error [44]. | Execute an HPTLC PRO SYSTEM reset to abort steps, reset modules, and reinitialize [44]. | Verify plate state after reset; it is often better to restart the entire analysis [44]. |
Troubleshooting Method Greenness and Solvent Reduction
Table 2: Troubleshooting Guide for Achieving Sub-10 mL Solvent Consumption
| Problem Category | Specific Symptom | Potential Cause | Solution | Preventive Measures |
|---|---|---|---|---|
| Method Development | High solvent consumption per sample. | Using non-optimized, large-volume mobile phases; inefficient sample preparation [45]. | Switch to miniaturized HPTLC plates (e.g., 10x10 cm) [21]. | Adopt green solvent principles early in method development; use micro-syringes [45] [46]. |
| Poor greenness metric scores (e.g., low AGREE score). | Use of hazardous solvents (e.g., chlorinated, high-toxicity) [46]. | Replace hazardous solvents with greener alternatives (e.g., Ethanol, Ethyl Acetate) [21] [46]. | Assess method greenness using tools like AGREE or Analytical Eco-Scale during validation [46]. | |
| Separation Efficiency | Inadequate separation with green solvents. | Insufficient selectivity of the eco-friendly mobile phase. | Optimize mobile phase ratios; consider small additives (e.g., 0.5% glacial acetic acid) [12]. | Use experimental design to optimize mobile phase composition for efficiency and greenness [21]. |
Frequently Asked Questions (FAQs)
General HPTLC and Solvent Reduction
Q1: What makes HPTLC an inherently "greener" technique compared to HPLC for pharmaceutical analysis? HPTLC is fundamentally greener due to significantly lower solvent consumption. While a single HPLC run can consume hundreds of milliliters of solvents, a complete HPTLC analysis with multiple samples on one plate typically uses less than 10-25 mL of total mobile phase [45] [21]. This is because HPTLC is a passive capillary flow process without pumps, and it analyzes samples in parallel, not sequentially. This drastically reduces solvent waste, energy use, and environmental impact, aligning with Green Analytical Chemistry principles [45].
Q2: How can I quantitatively prove that my HPTLC method is environmentally friendly? You can use several validated greenness assessment tools. The Analytical GREEnness (AGREE) calculator provides a comprehensive score based on multiple GAC principles [46]. The Analytical Eco-Scale is another tool where a higher score (closer to 100) indicates a greener method; one HPTLC method for Suvorexant achieved a score of 93 [46]. Other metrics include NEMI, ComplexGAPI, and ChlorTox, which collectively evaluate factors like waste generation, toxicity, and energy consumption [21] [46].
Q3: My samples are not resolving well with green solvents. What should I do? Try using a multi-solvent system that combines green solvents. A common strategy is to use Ethyl Acetate-Ethanol mixtures in varying ratios (e.g., 7:3, v/v), which has proven effective for separating complex pharmaceutical mixtures [21]. Small percentages of additives like triethylamine or glacial acetic acid can help improve peak shape and resolution without drastically increasing environmental impact [12].
Technical and Practical Applications
Q4: Why is it critical to activate the HPTLC plate in an oven before use? The silica layer on HPTLC plates is hygroscopic and absorbs moisture from the air. This absorbed water can act as an unintended stationary phase, altering the Rf values of your analytes, especially polar compounds. Activation by heating drives off this water, ensuring consistent and reproducible chromatographic performance [17].
Q5: Can HPTLC truly be used for quantitative analysis of active pharmaceuticals and their impurities in compliance with regulatory standards? Yes, absolutely. Modern HPTLC-densitometry is a robust, validated quantitative technique. For example, a recently published method simultaneously quantified the cardiovascular drugs Bisoprolol Fumarate and Amlodipine Besylate along with a mutagenic impurity, 4-hydroxybenzaldehyde, achieving detection limits as low as 3.56 ng/band [21]. Methods can be fully validated as per ICH Q2(R2) guidelines for linearity, accuracy, precision, and specificity [12] [46].
Q6: What is a key step often overlooked that is crucial for reproducible HPTLC results? Proper and consistent drying of the plate after development is critical. If a plate with a wet mobile phase is dipped into a derivatization reagent, the analytes can dissolve and diffuse into the reagent solution, leading to smeared bands and inaccurate quantification. Always ensure the plate is completely dry before any derivatization and scanning steps [17].
Experimental Protocols for Sub-10 mL Consumption
Protocol 1: Simultaneous Quantification of Two Drugs in a Formulation
This protocol is adapted from a method for quantifying Florfenicol and Meloxicam [12].
- Objective: To simultaneously quantify two drugs in a pharmaceutical formulation using less than 10 mL of mobile phase.
- Materials:
- HPTLC plates (Silica gel 60 F₂₅₄, 10x10 or 10x20 cm)
- CAMAG Linomat autosampler or equivalent
- CAMAG ADC2 developing chamber or equivalent
- Densitometry scanner (e.g., CAMAG TLC Scanner 3)
- Micro-syringes (100 µL)
- Mobile Phase: Glacial acetic acid, methanol, triethylamine, and ethyl acetate (0.05:1.00:0.10:9.00, by volume). Total volume prepared: ~10 mL.
- Procedure:
- Sample Preparation: Dissolve the formulation in a suitable solvent (e.g., methanol with a small amount of NaOH). Filter through a 0.45 µm membrane filter.
- Plate Activation: Activate the HPTLC plate by heating in an oven at the recommended temperature (e.g., 80°C for 10-15 minutes).
- Application: Using the autosampler, apply samples and standards as 8 mm bands on the activated plate.
- Development: Transfer the plate to an ADC2 chamber that has been pre-saturated with the mobile phase vapor for 15 minutes. Develop the plate over a 8 cm distance at room temperature. The development will consume approximately 5-10 mL of mobile phase.
- Drying: Dry the developed plate thoroughly using a blow-dryer or in a stream of warm air.
- Detection & Quantification: Scan the plate densitometrically at 230 nm. Generate calibration curves for each drug using the peak area ratios (analyte/Internal Standard).
- Greenness Assessment: This method uses a high proportion of ethyl acetate (a greener solvent) and minimal volumes, scoring highly on green metrics [12].
Protocol 2: Stability-Indicating Assay of a Drug Substance
This protocol is adapted from a green stability-indicating method for Suvorexant [46].
- Objective: To develop a stability-indicating reverse-phase HPTLC method for a drug substance with high greenness scores.
- Materials:
- HPTLC plates (RP-18 F₂₅₄S, 10x20 cm)
- Automated developing chamber (ADC2)
- Mobile Phase: Ethanol/Water (75:25, v/v). Total volume prepared: ~10 mL.
- Procedure:
- Forced Degradation: Subject the drug substance to stress conditions (acid, base, oxidation, heat).
- Sample Preparation: Prepare samples of stressed and unstressed drug in the mobile phase.
- Application & Development: Apply samples to the RP-18 plate. Develop in the ADC2 chamber pre-saturated with ethanol/water vapor for 30 minutes. The development will consume approximately 10 mL of mobile phase.
- Detection: Scan the plate at 255 nm.
- Analysis: Demonstrate that the method successfully separates the pure drug from its degradation products, confirming its stability-indicating property.
- Greenness Assessment: This method uses an ethanol-water mobile phase, which is non-toxic and safe. It reported an excellent AGREE score of 0.88 and an Analytical Eco-Scale score of 93 [46].
Research Reagent Solutions and Essential Materials
Table 3: Essential Materials for Green HPTLC Method Development
| Item | Function / Rationale | Green Considerations |
|---|---|---|
| HPTLC Plates (Silica gel 60 F₂₅₄) | Standard normal-phase separation medium. Smaller, consistent particle size (~5 µm) provides greater resolution per unit distance than conventional TLC [17]. | Compatible with a range of green solvent systems [12] [21]. |
| HPTLC Plates (RP-18 F₂₅₄S) | Reversed-phase plates for separating more polar compounds. Essential for certain stability-indicating methods [46]. | Can be used with ethanol/water mobile phases, a highly green combination [46]. |
| Ethyl Acetate | A common component of normal-phase mobile phases. Classified as a preferable solvent due to its lower environmental impact and toxicity [21]. | A key green alternative to more hazardous solvents like chloroform or dioxane [21]. |
| Ethanol | Used as a solvent or mobile phase component in both normal and reversed-phase HPTLC. Biodegradable and renewable [46]. | Can replace toxic methanol in many applications. Ethanol/Water is a classic green mobile phase [46]. |
| Water (Purified) | The greenest solvent available. Often used in reversed-phase HPTLC [46]. | Non-toxic, non-flammable, and safe. |
| Glacial Acetic Acid / Triethylamine | Used in small quantities (<1% of mobile phase) as pH modifiers to improve peak shape and resolution [12]. | Their minimal use keeps the overall method green while enhancing performance [12]. |
| 0.22 µm Syringe Filter | Critical for removing particulate matter from samples to prevent clogging of application syringes and ensure clean baselines [17]. | Prevents waste from failed applications and need for re-analysis. |
| CAMAG ADC2 Chamber | Automated Developing Chamber provides controlled pre-saturation and development conditions, crucial for reproducibility [21] [46]. | Standardization reduces solvent and material waste from failed runs due to environmental variability. |
Experimental Workflow and Signaling Pathways
Workflow Description
This diagram outlines the critical path for developing a green HPTLC method with sub-10 mL solvent consumption. Key green steps include Sample Preparation (filtering to prevent re-runs), Plate Development (using a minimal volume of a green mobile phase), and the final Greenness Assessment, which quantitatively validates the method's environmental friendliness using modern metrics [12] [21] [46]. Standardizing steps like plate activation and chamber saturation is essential for achieving reproducibility with low solvent volumes [17] [21].
Sample Preparation Cleanup to Enhance Separation and Reduce Re-developments
In High-Performance Thin-Layer Chromatography (HPTLC) method development, effective sample preparation is the cornerstone of achieving optimal separation in a single development. Proper cleanup techniques directly determine separation quality, resolution, and analytical reliability by removing matrix interferents that compromise chromatographic performance [2]. Within the context of green chemistry, streamlined sample preparation that reduces the need for repeated developments directly contributes to sustainability goals by minimizing solvent consumption, hazardous waste generation, and overall analysis time [15]. This guide provides researchers with practical troubleshooting and methodological frameworks to overcome common sample-related challenges, enhancing first-attempt success rates in HPTLC analysis.
FAQs: Fundamental Cleanup Principles
1. Why is sample preparation cleanup critical for reducing re-developments in HPTLC? Sample preparation directly determines separation quality, resolution, and analytical reliability. Inadequate cleanup leaves matrix interferents that cause streaking, tailing, and irreproducible results, often necessitating repeated analyses [2]. Complex biological, pharmaceutical, and environmental samples contain components that lead to spot overloading, chemical interactions with the stationary phase, and competitive binding—all of which reduce target compound resolution and frequently require re-development [2]. Effective cleanup protocols remove these interferents while preserving analyte integrity, making single-developments achievable.
2. How does effective sample cleanup contribute to greener HPTLC practices? Optimized sample cleanup enhances method sustainability by reducing solvent consumption associated with multiple re-developments and additional cleanup steps. HPTLC is recognized for its low solvent consumption (<10 mL per analysis) and minimal energy requirements compared to other chromatographic techniques [15]. When sample preparation prevents the need for repeated runs, it further reduces the environmental footprint, aligning with core Green Analytical Chemistry (GAC) principles of waste prevention and reduced hazardous chemical use [15].
3. What are the primary sample cleanup techniques for HPTLC? The three primary cleanup approaches are:
- Filtration: Removes particulate matter that can damage TLC plates or cause irregular solvent flow. For critical applications, 0.22 μm syringe filters provide complete particle removal [2].
- Liquid-Liquid Extraction: Separates target analytes from aqueous matrices or removes specific interferent classes. pH adjustment controls ionization state and partitioning behavior of acidic or basic compounds [2].
- Solid-Phase Extraction (SPE): Provides selective cleanup for complex biological or environmental samples. SPE cartridge selection depends on analyte polarity, matrix composition, and required cleanup selectivity [2].
Troubleshooting Guide: Common Sample Preparation Issues
Table 1: Troubleshooting Common Sample-Related Problems in HPTLC
| Problem | Possible Causes | Solutions | Green Chemistry Benefit |
|---|---|---|---|
| Sample Streaking | Sample overloading; Acidic/basic compound interactions; Plate contamination [2] [35] | Reduce sample concentration/volume; Add modifiers to mobile phase (0.1-2% acetic acid for bases, 0.1-2% triethylamine for acids) [35]; Pre-wash plates to remove contaminants [2] | Prevents solvent waste from multiple developments |
| No Spots Visible After Development | Low sample concentration; Compound volatility; High solvent level in chamber [35] [16] | Concentrate sample by multiple applications in same location; Use less volatile solvent; Ensure solvent level is below spotting line [16] | Avoids repeated analysis and solvent consumption |
| Unexpected Multiple Spots | Sample contamination; Plate handling contamination; Decomposition [16] | Use cleaner solvents and vials; Handle plates carefully by edges; Ensure sample stability during preparation [16] | Prevents need for repeated analysis |
| Compounds Too Close to Solvent Front or Baseline | Incorrect mobile phase polarity [35] | For high Rf: decrease polar solvent proportion; For low Rf: increase polar solvent proportion [35] | Enables optimal separation in single development |
| Spots with Same Rf Values | Insufficient resolution between compounds [35] | Try "co-spotting" with standards; Change solvent system class (e.g., polar/hydrocarbon vs. polar/dichloromethane) [35] | Reduces trial-and-error method development |
Experimental Protocols for Effective Cleanup
Protocol 1: Standard Sample Dissolution and Dilution
Optimal sample dissolution is fundamental to preventing development issues:
- Solvent Selection: For normal-phase HPTLC, select the least polar solvent that achieves complete dissolution to minimize spot spreading during application. Common solvents include hexane, dichloromethane, ethyl acetate, and acetone, selected based on analyte polarity [2].
- Dilution Ratio: Use a standard dilution of approximately 1 drop sample to 1 mL solvent (50-100x dilution). This concentration typically provides sharp, well-defined spots with diameters under 2 mm with adequate sensitivity while preventing overloading [2] [3].
- Application Parameters: Apply 0.5-2.0 μL for identity testing, with a maximum of 10 μL for purity analysis. Maintain spot diameter under 2 mm and apply slowly to allow solvent evaporation between additions [2].
Protocol 2: Solid-Phase Extraction (SPE) Cleanup for Complex Matrices
SPE provides selective cleanup for challenging samples:
- Cartridge Selection: Choose sorbent type based on analyte characteristics:
- Reverse-phase (C18) for non-polar compounds
- Normal-phase (silica) for polar compounds
- Mixed-mode for acidic/basic compounds [2]
- Extraction Procedure:
- Condition sorbent with appropriate solvent
- Load sample in weak solvent
- Wash with intermediate strength solvent to remove interferents
- Elute target analytes with strong solvent [2]
- Concentration: Gently evaporate eluent under nitrogen stream and reconstitute in solvent compatible with HPTLC application [2].
Protocol 3: TLC Plate Pre-Washing and Activation
Proper plate preparation eliminates background interference:
- Pre-Washing: Develop blank plate with methanol or intended mobile phase to remove impurities from binders and packaging materials. Air dry completely in a fume hood away from chemical vapors [2] [47].
- Activation: Heat plates at 120°C for 20-30 minutes in a clean laboratory oven to remove adsorbed moisture that reduces stationary phase activity [2] [47].
- Storage: Cool activated plates in a desiccator and use within 2-4 hours for optimal performance to prevent rehydration [2].
Workflow Diagram: Sample Preparation Cleanup Pathway
Research Reagent Solutions for Sample Cleanup
Table 2: Essential Materials for HPTLC Sample Preparation Cleanup
| Reagent/Material | Function/Purpose | Application Notes |
|---|---|---|
| Silica Gel 60 F254 Plates | Standard stationary phase for normal-phase HPTLC | 0.25 mm thickness for analytical work; 0.5-2.0 mm for preparative separations [2] [48] |
| Solid-Phase Extraction Cartridges | Selective cleanup for complex matrices | Reverse-phase (C18), normal-phase (silica), mixed-mode sorbents address different analytical challenges [2] |
| Syringe Filters (0.22 μm) | Removal of particulate matter | Prevents damage to TLC plates and irregular solvent flow; membrane compatibility must match sample solvent [2] |
| Mobile Phase Modifiers | Suppress ionization of acidic/basic compounds | Triethylamine (0.1-2%) for basic compounds; Acetic/Formic acid (0.1-2%) for acidic compounds [35] |
| Pre-Washing Solvents | Remove plate contaminants | Methanol or intended mobile phase; develops blank plate before sample application [2] [47] |
Advanced Cleanup Applications
Case Study: HPTLC Cleanup for Environmental PAH Analysis
Research demonstrates the effectiveness of HPTLC cleanup for challenging environmental matrices. In a study analyzing polycyclic aromatic hydrocarbons (PAHs) in marine sediments, an optimized HPTLC cleanup protocol using hexane:dichloromethane (70:30, v/v) successfully enhanced PAH purity from 66% to 96% without inducing isotopic fractionation [31]. This efficient cleanup enabled precise compound-specific isotope analysis by effectively removing unresolved complex mixtures that would otherwise interfere with accurate quantification [31].
Sustainable Method Development Framework
Integrating effective sample preparation with green chemistry principles creates a virtuous cycle in HPTLC method development. Starting with comprehensive sample cleanup reduces the need for multiple optimization runs, directly minimizing solvent consumption [15]. This approach aligns with quantitative greenness assessment tools like the Analytical GREEnness Metric (AGREE), where HPTLC consistently demonstrates high ratings due to low solvent volumes, minimal energy requirements, and parallel processing capabilities [15].
Solving Common Challenges in Eco-Friendly HPTLC Development
Troubleshooting Poor Resolution with Low-Polarity Mobile Phases
Poor chromatographic resolution when using low-polarity mobile phases is a common challenge in High-Performance Thin-Layer Chromatography (HPTLC) method development. This issue can compromise the accuracy and reliability of your analytical results. This guide provides targeted troubleshooting strategies and practical solutions to help you achieve sharp, well-separated bands while adhering to the principles of green chemistry by minimizing solvent consumption and waste.
Core Principles of Resolution in HPTLC
Chromatographic resolution (Rs) measures how well two adjacent bands are separated. It is primarily governed by three key parameters [49]:
- Efficiency (N): The ability of the system to produce sharp, narrow bands. Higher efficiency improves resolution.
- Selectivity (α): A measure of the relative retention of two components, indicating the stationary phase's ability to differentiate between them.
- Retention (k'): The degree to which a compound is retained on the stationary phase. Ideal retention factors provide sufficient time for separation without excessive analysis time.
In low-polarity environments, the interactions between analytes, the stationary phase, and the mobile phase are fundamentally different from those in polar systems. Understanding these interactions is the first step in troubleshooting.
Frequently Asked Questions (FAQs)
Why do my compounds streak or form elongated bands with low-polarity solvents?
Streaking is one of the most frequent problems encountered with low-polarity mobile phases. The primary causes and solutions are [35] [2]:
- Sample Overloading: The amount of sample applied to the plate may be too high. Dilute your sample solution and re-spot.
- Inappropriate Sample Solvent: If the sample is dissolved in a solvent that is too polar for the low-polarity mobile phase, it can cause spot broadening. Ensure the sample is dissolved in the same low-polarity solvent or a solvent of weaker eluting strength [50].
- Active Sites on the Stationary Phase: Residual silanol groups on silica gel can strongly adsorb certain compounds, especially basic ones, causing tailing. For basic compounds, try adding a basic modifier like triethylamine (0.1-2.0%) to the mobile phase to suppress these interactions [35].
My compounds are not moving from the baseline. What should I do?
This indicates that the mobile phase is not polar enough to displace the analytes from the stationary phase [35].
- Increase Polarity Systematically: Gradually increase the percentage of a more polar solvent in your mobile phase mixture. For a hexane-based system, this could mean increasing the percentage of ethyl acetate or dichloromethane.
- Refer to an Eluotropic Series: Use a solvent eluotropic series table to select a slightly more polar solvent that maintains the desired selectivity.
My compounds are moving with the solvent front. How can I improve retention?
When compounds migrate with the solvent front (Rf > 0.8), there is insufficient interaction with the stationary phase for any meaningful separation [35].
- Decrease Mobile Phase Polarity: Reduce the percentage of the polar modifier in your binary mixture.
- Choose a Less Polar Solvent: Switch to a weaker solvent from the eluotropic series. For example, replace ethyl acetate with toluene or dichloromethane.
Two compounds have very similar Rf values and are not resolving. How can I separate them?
When selectivity is poor, a simple polarity adjustment may not be sufficient.
- Modify Mobile Phase Selectivity: Sometimes, replacing one solvent with another of similar polarity can dramatically change selectivity. For instance, replacing acetonitrile with methanol in a reversed-phase system can alter interactions [49].
- Use a Different Stationary Phase: If mobile phase optimization fails, consider switching to a different stationary phase, such as C18 for reversed-phase HPTLC, which offers a different separation mechanism [35] [2].
- Employ Multiple Development: Developing the plate multiple times in the same or different solvent strengths can enhance resolution for complex mixtures [2].
Troubleshooting Guide: Common Problems and Solutions
The table below summarizes the most common issues, their likely causes, and actionable solutions.
| Problem | Primary Cause | Recommended Solution |
|---|---|---|
| Streaking or Tailing | Sample overloading [35] | Dilute sample; reduce application volume [2] |
| Secondary interactions with active sites on silica [49] | Add mobile phase modifiers (e.g., 0.1-2% acid for bases, 0.1-2% base for acids) [35] | |
| Sample solvent too strong [50] | Dissolve sample in a weaker (less polar) solvent | |
| No Migration (Low Rf) | Mobile phase is not polar enough [35] | Increase concentration of polar modifier; choose a stronger solvent |
| All compounds at solvent front (High Rf) | Mobile phase is too polar [35] | Decrease concentration of polar modifier; choose a weaker solvent |
| Poor Separation (Close Rf) | Insufficient selectivity [49] | Change mobile phase composition/type; change stationary phase; use multiple development [2] |
| Uneven Solvent Front | Uneven plate layer; chamber not saturated [16] [50] | Ensure chamber is properly saturated with filter paper; use evenly coated plates |
Step-by-Step Optimization Protocol
This systematic workflow will guide you from initial setup to a robust, optimized method using minimal solvent.
Step 1: Initial Plate Preparation
- Pre-wash: Develop a blank plate with methanol to remove impurities. Dry completely [2].
- Activate: Heat the plate at 110-120°C for 20-30 minutes to remove adsorbed water and maximize activity. Cool in a desiccator [50] [2].
Step 2: Mobile Phase Selection and Chamber Equilibration
- Start with a Standard System: For normal-phase HPTLC with low-polarity solvents, a mixture of hexane and ethyl acetate is an excellent starting point.
- Equilibrate: Line the development chamber with a filter paper soaked in the mobile phase. Add the mobile phase (0.5 cm depth) and allow it to equilibrate for at least 20 minutes to ensure a saturated vapor atmosphere. This is critical for reproducible Rf values [50].
Step 3: Sample Application and Development
- Spot Accurately: Apply samples as small, compact bands (≤ 2 mm diameter) using a capillary or automated applicator. The baseline should be 1.0 cm from the bottom edge [2].
- Develop: Place the plate in the equilibrated chamber and develop until the solvent front reaches about 1 cm from the top.
- Dry and Visualize: Dry the plate thoroughly in a fume hood to remove solvent residues before visualization under UV light or with a derivatization reagent.
The Scientist's Toolkit: Essential Research Reagents and Materials
The table below lists key materials used in HPTLC method development with low-polarity phases.
| Item | Function/Description |
|---|---|
| HPTLC Silica Gel plates | Standard stationary phase for normal-phase chromatography; often with F₂₅₄ indicator for UV detection [50] [2]. |
| Pre-coated C18 plates | Reversed-phase stationary phase; provides an alternative separation mechanism when silica gel fails [35]. |
| Hexane, Heptane | Non-polar base solvents for creating low-polarity mobile phases [50] [2]. |
| Ethyl Acetate | A common, moderately polar modifier used in binary mixtures with hydrocarbons [50]. |
| Dichloromethane | A solvent with good solvating power and moderate polarity [2]. |
| Triethylamine | Basic modifier added in small amounts (0.1-2.0%) to deactivate silanol groups and reduce tailing of basic compounds [35]. |
| Acetic/Formic Acid | Acidic modifier added in small amounts (0.1-2.0%) to suppress ionization and reduce tailing of acidic compounds [35]. |
| Automated Development Chamber | Allows for controlled chamber saturation and development conditions, crucial for reproducibility [21]. |
Advanced Strategies and Green Chemistry Considerations
Integrating advanced strategies can further enhance resolution while aligning with the goal of reducing solvent consumption.
- Multi-Modal HPTLC Platforms: Modern HPTLC can be coupled with techniques like mass spectrometry (MS) or surface-enhanced Raman spectroscopy (SERS) for definitive compound identification without the need for extensive re-analysis, saving solvents and time [15].
- Eco-Friendly Solvent Selection: When optimizing your mobile phase, consider replacing traditional solvents like methanol or acetonitrile with greener alternatives, such as ethanol or isopropanol, where possible [22]. HPTLC inherently uses less solvent than column chromatographic techniques, making it a greener choice [15] [21].
- Validated Green Methods: When developing a new method, use greenness assessment tools (e.g., AGREE, GAPI) to evaluate its environmental impact. This ensures your optimized, low-solvent method is not only effective but also sustainable [21] [22].
Avoiding Streaking and Tailing in Minimal Solvent Systems
Frequently Asked Questions
What are the primary causes of streaking in HPTLC? Streaking is most commonly caused by sample overloading, where the mobile phase cannot effectively transport all applied material [35]. It can also result from undesirable ionic interactions between the analyte and the stationary phase, especially for basic or acidic compounds [2].
How can I prevent tailing when using minimal solvent volumes? Preventing tailing involves optimizing the sample solution and mobile phase. For basic compounds, add 2-3 drops of triethylamine per 100 mL of mobile phase. For acidic compounds, add 2-3 drops of acetic acid. This suppresses ionization and minimizes undesirable interactions with the stationary phase [2].
My analytes are too close to the solvent front or baseline. How do I fix this? If compounds are near the solvent front, your eluent is too polar; decrease the proportion of polar solvent. If they are near the baseline, your eluent is not polar enough; increase the proportion of polar solvent [35]. Target Rf values between 0.2 and 0.8 for reliable identification, with an optimal value around 0.4 for the compound of interest [2].
Why are my spots not visible after development? Your sample may be too diluted; concentrate it by spotting several times in the same location, letting it dry between applications [35]. The compound might not be UV-active; try a destructive visualization method like chemical staining [35]. Also, ensure the solvent level in the tank is lower than the spotting line to avoid sample dissolution [35].
What does it mean if I see spots with the same Rf values? Try "co-spotting"—apply the starting material (standard) and your sample in the same spot and compare the resulting separation [35]. If the Rf values remain identical, it may indicate the same compound. If separation occurs, consider changing your solvent system to a different class of mixtures (e.g., Polar/hydrocarbon, Polar/dichloromethane, Polar/toluene) [35].
Troubleshooting Guide
| Problem & Symptoms | Root Cause | Diagnostic Check | Corrective Action |
|---|---|---|---|
| Sample Streaking: Spots appear as vertical smears [35]. | Sample overloading [2] [35]; Ionic interactions with stationary phase [2]. | Check sample concentration and application volume. | Dilute sample; For acid/base-sensitive compounds, add 0.1-2.0% acid (e.g., acetic) or base (e.g., triethylamine) to mobile phase [2] [35]. |
| Spot Tailing: Spots have a comet-like appearance with a trailing edge [2]. | Strong, undesirable interactions with active sites on the stationary phase [2]. | Determine if analytes are acidic or basic. | Add mobile phase modifiers: triethylamine for basic compounds or acetic acid for acidic compounds [2]. |
| Invisible Spots: No spots are visible post-development. | Compound is not UV-active [35]; Sample is too diluted [35]. | Check under UV light at different wavelengths; Use a non-destructive method like iodine vapor [35]. | Use appropriate chemical stain (e.g., PMA, anisaldehyde) [35]; Concentrate sample solution and re-spot [35]. |
| Poor Resolution: Spots are too close together (Rf difference <0.15) or run to the plate's edges. | Incorrect mobile phase polarity [2] [35]. | Measure Rf values. | If Rf < 0.2, increase mobile phase polarity; If Rf > 0.8, decrease polarity [2] [35]. |
| Irregular Solvent Front: Solvent front is not straight, leading to unreliable Rf values. | Insufficient chamber saturation, causing edge effects [2]. | Check equilibration time and chamber preparation. | Equilibrate chamber for minimum of 20 minutes with a saturated atmosphere using a filter paper liner [2]. |
Experimental Protocols for Diagnosis and Correction
Protocol 1: Systematic Sample Dilution Test to Diagnose Overloading This protocol helps identify the optimal sample concentration to prevent streaking.
- Prepare Dilutions: Create a series of sample solutions with concentrations of 100%, 50%, 25%, and 10% of the original [35].
- Spot the Plate: Apply 1 µL of each dilution on the same HPTLC plate.
- Develop and Analyze: Develop the plate with your standard mobile phase. After development, identify the dilution that produces a sharp, well-defined spot without streaking. This concentration is your optimal loading level [2].
Protocol 2: Mobile Phase Modifier Screening for Acidic/Basic Compounds This protocol is used to suppress ionization and eliminate tailing.
- Prepare Modified Mobile Phases:
- Comparative Development: Spot the sample on two plates. Develop one with the unmodified mobile phase and the other with the modified mobile phase.
- Evaluate: Compare the spot shapes. A reduction or elimination of tailing confirms the need for the modifier.
Protocol 3: Chamber Saturation for Reproducibility This protocol ensures a saturated vapor atmosphere for a uniform and reproducible solvent front.
- Line Chamber: Place a filter paper liner on the inner wall of the twin-trough chamber to increase the vapor surface area [2].
- Add Mobile Phase: Pour the mobile phase to a depth of about 0.5 cm into one trough, ensuring the plate will not be immersed [2].
- Equilibrate: Close the chamber lid and allow it to equilibrate for at least 20 minutes at room temperature before introducing the plate [2].
The Scientist's Toolkit: Essential Research Reagents
| Item | Function | Application Note |
|---|---|---|
| Triethylamine | A basic modifier that deactivates acidic silanol sites on the silica gel surface. | Used at 0.1-2.0% in mobile phase to prevent tailing of basic compounds like amines [35]. |
| Acetic Acid / Formic Acid | Acidic modifiers that suppress the ionization of acidic analytes, reducing their interaction with the stationary phase. | Used at 0.1-2.0% in mobile phase to eliminate tailing of carboxylic acids and other acidic compounds [35]. |
| Phosphomolybdic Acid (PMA) | A universal chemical stain for visualizing a wide range of organic compounds. | Prepare as 10% solution in ethanol; requires heating for development; spots appear as shades of green [35]. |
| Anisaldehyde Stain | A versatile stain particularly effective for aldehydes, carbohydrates, and phenols. | Composition: 15 g anisaldehyde, 250 mL ethanol, 2.5 mL conc. sulfuric acid; requires heating [35]. |
| Silica Gel 60 F254 Plates | The standard stationary phase for normal-phase HPTLC, with a consistent particle size (10-12 µm) and fluorescent indicator. | Plates should be pre-washed and activated at 120°C for 20-30 minutes before use to ensure optimal performance [2]. |
| Pre-Saturation Filter Paper | A sheet of filter paper placed inside the development chamber to aid in vapor saturation. | Crucial for achieving a uniform solvent front and reproducible Rf values; used during the 20-minute chamber equilibration [2]. |
Diagnostic Workflow for Streaking and Tailing
The following diagram outlines a logical, step-by-step process to diagnose and resolve the common issues of streaking and tailing in your HPTLC analysis.
Managing Chamber Saturation for Reproducibility with Reduced Volumes
A technical guide to mastering your HPTLC chamber for consistent, eco-friendly results.
FAQs: Understanding Chamber Saturation
What is chamber saturation and why is it critical for HPTLC reproducibility?
Chamber saturation refers to the equilibrium state where the air space in a developing chamber is fully laden with vapor from the mobile phase solvent system. This process is fundamental for achieving reproducible High-Performance Thin-Layer Chromatography (HPTLC) results because it creates a uniform environment that prevents solvent evaporation from the plate surface during development. Without proper saturation, the solvent gradient across the plate becomes inconsistent, leading to irregular solvent fronts, varying retention factors (Rf values), and poor separation resolution. In the context of green chemistry, effective saturation allows for method development with minimal solvent volumes, as it ensures that every microliter of solvent is utilized efficiently for separation rather than lost to evaporation [7] [2].
How does chamber saturation impact solvent consumption in high-volume laboratories?
In laboratories performing numerous HPTLC analyses daily, the cumulative solvent consumption for chamber saturation represents a significant portion of overall chemical use. Traditional twin-trough chambers often require substantial solvent volumes to create adequate vapor pressure for saturation. By optimizing saturation protocols—such as using precisely sized filter papers, ensuring tight chamber seals, and determining the minimum effective saturation time—labs can dramatically reduce their environmental footprint and operational costs without compromising analytical performance. Research demonstrates that sustainable method development can align with robust performance, as seen in methods achieving excellent AGREE and NEMI greenness scores while maintaining precision and accuracy [5] [21].
What are the consequences of insufficient chamber saturation?
Insufficient saturation manifests through several chromatographic defects:
- Irregular solvent fronts: Instead of a straight horizontal line, the solvent front appears curved or wavy
- Edge effects: Solvent migrates faster along the edges of the plate than in the center
- Variable Rf values: The same compound shows different migration distances across the plate or between runs
- Poor resolution: Incomplete separation of closely migrating compounds due to inconsistent mobile phase velocity
- Streaking or tailing: Uneven solvent saturation can exacerbate analyte-stationary phase interactions
These artifacts directly compromise the quantitative reliability of HPTLC analysis and can lead to erroneous conclusions in pharmaceutical quality control and drug development applications [2] [51].
Can chamber saturation be too long? What are the risks of over-saturation?
While adequate saturation is essential, excessive saturation times (beyond what is necessary for equilibrium) do not typically improve separation quality and represent inefficient laboratory practice. In extremely prolonged saturation scenarios, there is a risk of pre-adsorption of mobile phase components onto the stationary phase, potentially altering its characteristics. More practically, over-saturation unnecessarily extends analysis time, reduces laboratory throughput, and may increase solvent loss through minor leaks or absorption. The optimal approach follows the principles of green chemistry by establishing the minimum saturation time required for reproducible results, thus conserving resources [2].
Troubleshooting Guides
Problem: Irregular Solvent Front
Observed Symptom: The solvent migration front appears curved, wavy, or angled rather than straight across the HPTLC plate.
| Possible Cause | Diagnostic Steps | Corrective Actions |
|---|---|---|
| Insufficient chamber saturation time | Time the saturation process; check for protocol deviations | Standardize saturation to minimum 20 minutes before plate development [2] [51] |
| Inadequate filter paper sizing | Inspect filter paper coverage; should line entire chamber rear wall | Ensure filter paper completely covers one trough and extends to chamber top [2] |
| Chamber lid seal leakage | Perform visual inspection; use sealing grease if applicable | Apply uniform pressure to lid; replace worn seals; verify chamber integrity |
| Uneven mobile phase distribution | Check chamber level surface; verify solvent volume consistency | Use standardized solvent depth (0.5 cm); ensure chamber on level surface [2] |
Problem: Inconsistent Rf Values Between Runs
Observed Symptom: The same compound shows significantly different retention factors (Rf > ±0.02 variation) when analyzed in separate runs.
| Possible Cause | Diagnostic Steps | Corrective Actions |
|---|---|---|
| Variable saturation timing | Review laboratory records for saturation time consistency | Implement strict timer-based protocol with documentation for each run |
| Ambient temperature fluctuations | Monitor laboratory temperature; note correlations with Rf variations | Maintain constant temperature (25±0.5°C ideal) in controlled environment [21] |
| Humidity variations | Track laboratory humidity levels against Rf variability | Control relative humidity (40±2% ideal); use desiccators for plate storage [21] |
| Mobile phase composition inconsistencies | Verify solvent measuring precision and mixing order | Use calibrated instruments; establish standard mixing procedures; validate with test mixture |
Problem: Streaking or Tailing Spots
Observed Symptom: Developed spots exhibit elongated vertical streaks or comet-like tails instead of compact, circular shapes.
| Possible Cause | Diagnostic Steps | Corrective Actions |
|---|---|---|
| Incomplete saturation causing multiple solvent fronts | Examine plate for subtle front irregularities; track development time | Optimize saturation protocol; ensure chamber sealed during entire equilibration |
| Mobile phase polarity mismatch | Calculate analyte Rf values; assess if outside optimal 0.2-0.8 range | Adjust mobile phase polarity using PRISMA optimization system [7] [2] |
| Acidic/basic compound interactions | Review analyte chemical properties; test with pH-modified mobile phases | Add 2-3 drops modifier per 100 mL mobile phase (amine for basics, acid for acids) [2] |
| Sample overloading | Perform dilution series; observe if streaking decreases with lower concentration | Reduce application volume; ensure 1-2 μL for analytical work [2] |
Experimental Protocols
Standardized Chamber Saturation Protocol for Reduced Solvent Consumption
This protocol establishes a consistent approach for achieving complete chamber saturation while minimizing solvent volume, specifically designed for twin-trough HPTLC chambers.
Materials and Equipment:
- Twin-trough developing chamber (20 × 10 cm standard)
- Filter paper (Whatman No. 1 or equivalent), cut to chamber dimensions
- Precision micropipettes or graduated cylinders for solvent measurement
- Timer
- Thermal jacket or environmental chamber (optional, for temperature control)
Procedure:
- Filter Paper Preparation: Cut filter paper to line the entire rear trough and back wall of the chamber, extending to the top edge to maximize vaporization surface area.
Solvent Addition: Precisely measure the optimized mobile phase volume using a graduated cylinder. For a standard 20 × 10 cm twin-trough chamber, add 25-30 mL to the rear trough containing the filter paper. This volume creates a 0.5 cm depth without immersing the plate position [2] [51].
Chamber Equilibration:
- Securely close the chamber lid to ensure an airtight seal.
- Start the timer and allow the chamber to equilibrate at constant temperature for 20-30 minutes [2] [51] [21].
- Note: The optimal time may require validation for specific solvent systems; highly volatile solvents may achieve saturation faster.
Plate Introduction:
- After equilibration, quickly introduce the spotted HPTLC plate into the front trough (which contains no solvent).
- Immediately reseal the chamber to prevent vapor escape.
- Begin development without delay.
Development and Documentation:
Miniaturized Chamber Approach for Ultra-Low Volume Applications
For laboratories prioritizing solvent reduction, this adaptation uses specialized equipment to minimize consumption while maintaining reproducibility.
Specialized Equipment:
- Horizontal developing chamber or mini-chamber design
- Small HPTLC plates (5 × 10 cm or 10 × 10 cm)
- High-precision syringe for solvent application
Procedure:
- Chamber Configuration: Set up the horizontal development chamber according to manufacturer instructions, ensuring level placement.
Miniaturized Saturation:
- Apply precisely 5-10 mL of mobile phase to the designated solvent reservoir.
- For very small chambers, even 3-5 mL may suffice.
- Seal the chamber and equilibrate for 15-20 minutes.
Efficient Development:
- Position the plate in contact with the minimal solvent volume.
- Proceed with development in the saturated microenvironment.
Validation: Compare Rf values and resolution achieved with the miniaturized system against standard methods using reference standards. The method demonstrated in recent research achieved excellent separation with mobile phases like ethyl acetate-ethanol (7:3, v/v) in minimal volumes [21].
Chamber Saturation Parameters Across Methodologies
Table summarizing optimized saturation parameters from recent HPTLC research and methodology guides:
| Application Context | Chamber Type | Saturation Time | Solvent Volume | Key Outcomes | Source Reference |
|---|---|---|---|---|---|
| Pharmaceutical analysis (multiple APIs) | Twin-trough | 20 minutes | Not specified | Sharp peaks, RSD <2% | [51] |
| Green method development | Twin-trough | 20-30 minutes | Minimal depth (0.5 cm) | Reproducible Rf values | [2] |
| Stability-indicating method | Standard | 20 minutes | Not specified | Validated per ICH guidelines | [5] |
| Mutagenic impurity monitoring | Automated ADC2 | 25 minutes | Optimized for small chamber | Baseline separation achieved | [21] |
Solvent Consumption Comparison: Traditional vs. Optimized Methods
Table demonstrating solvent reduction achievements through chamber saturation optimization:
| Method Aspect | Traditional Approach | Optimized Approach | Reduction Achieved | Impact on Reproducibility |
|---|---|---|---|---|
| Filter paper use | Optional or incomplete coverage | Full rear wall coverage | Improved efficiency with same volume | Enhanced reproducibility through better vapor equilibrium |
| Saturation time | Variable or undocumented | Standardized 20-30 minutes | More predictable results | Consistent inter-day Rf values (±0.02) |
| Chamber selection | Standard twin-trough | Horizontal or mini-chambers | Up to 70% solvent reduction | Equivalent separation quality with proper saturation |
| Mobile phase depth | Deep immersion (>1 cm) | Precise 0.5 cm depth | ~50% volume reduction | Maintained development distance 75-85 mm |
The Scientist's Toolkit
Essential Research Reagent Solutions
Table listing key materials and their functions in chamber saturation optimization for reproducible HPTLC:
| Item | Function in Chamber Saturation | Technical Specifications | Green Chemistry Benefit |
|---|---|---|---|
| Twin-trough chamber | Provides separate compartments for solvent and plate during saturation | 20 × 10 cm standard size; glass construction with ground glass lid | Enables saturation with minimal solvent volume |
| Filter paper | Increases solvent vaporization surface area for faster saturation | High-quality cellulose; cut to chamber dimensions | Improves saturation efficiency without additional solvent |
| Pre-coated HPTLC plates | Stationary phase for separation; sensitive to saturation conditions | Silica gel 60 F₂₅₄; 10 × 10 cm or 20 × 10 cm; 0.2 mm thickness | Consistent performance with optimized saturation |
| Precision solvent measuring tools | Accurate mobile phase volume delivery for reproducible saturation | Class A graduated cylinders; precision micropipettes | Prevents waste from volume inaccuracies |
| Environmental chamber | Maintains constant temperature during saturation and development | Temperature control ±0.5°C; humidity monitoring | Eliminates environmental variables affecting reproducibility |
Workflow Visualization
Optimized Chamber Saturation Workflow
The diagram above outlines the systematic procedure for achieving optimal chamber saturation in HPTLC, highlighting the critical steps that ensure reproducible results while maintaining minimal solvent consumption. This workflow emphasizes precise measurement, controlled timing, and thorough documentation—all essential elements for sustainable method development in pharmaceutical analysis.
Optimizing Sample Application Techniques to Prevent Overloading
In the pursuit of reducing solvent consumption in High-Performance Thin-Layer Chromatography (HPTLC) method development, optimizing sample application is a critical first step. Proper technique is the foundation for successful analytical separations, directly determining separation quality, resolution, and analytical reliability [2]. Sample overloading leads to a cascade of problems including streaking, tailing, and irreproducible results that compromise data integrity and necessitate method re-development, thereby increasing solvent waste [2]. This guide provides targeted troubleshooting and best practices to help researchers achieve optimal sample application, supporting both analytical excellence and greener laboratory practices.
Frequently Asked Questions (FAQs)
1. How does proper sample application contribute to solvent reduction in HPTLC? Optimal sample application prevents chromatographic defects like streaking and tailing, which often require repeated analyses and additional solvent consumption for method re-development and re-running samples. Efficient first-pass success minimizes solvent usage throughout the method development and quality control process [22] [2].
2. What are the immediate visual indicators of sample overloading on an HPTLC plate? The primary indicators include broad, diffuse spots instead of compact bands; significant streaking or tailing of spots; and overlapping zones that fail to separate cleanly [2]. These artifacts signal that the mobile phase cannot effectively transport all applied material.
3. Why must the sample be completely soluble in the application solvent? Incomplete solubilization creates precipitates that can clog application syringes and create irregular, concentrated spots on the plate, leading to poor resolution and uneven migration [17]. Always filter samples through a 0.22 µm syringe filter to remove particulates before application [17].
4. How does proper plate activation prevent application artifacts? Silica is hygroscopic and absorbs moisture from the air, which can deactivate the stationary phase. This moisture can cause unpredictable spot migration and shape. Heating plates at 120°C for 20-30 minutes before use activates them by removing adsorbed water, ensuring consistent analyte-stationary phase interactions [2] [17].
Troubleshooting Guide: Sample Application Issues
Table 1: Common Sample Application Problems and Solutions
| Problem | Primary Causes | Immediate Solutions | Preventive Measures |
|---|---|---|---|
| Streaking or Tailing Spots | Sample overloading (too concentrated or large volume) [2]; Acidic/basic compound interactions with stationary phase [2] | Dilute sample 1.5-2x; For basic compounds, add 2-3 drops triethylamine per 100 mL mobile phase; For acidic compounds, add 2-3 drops acetic acid [2] | Perform progressive dilution tests to find optimal concentration; Use pH modifiers in sample solvent [2] |
| Poor Resolution | Spot diameter too large at application (>2 mm) [2]; Insufficient spacing between application bands [2] | Reduce application volume; Slow application rate to allow solvent evaporation between additions [2] | Use automated applicators for band application; Maintain 2.5 cm spacing between spots [2] |
| Irregular Spot Shapes | Damaged silica surface from spotting capillary; Plate contamination from skin oils or dirt [17] | Re-spot on a fresh, properly handled plate | Always handle plates by edges only; Use pre-washed plates to remove impurities [2] [17] |
Detailed Experimental Protocols
Protocol 1: Determining Optimal Sample Concentration
This systematic approach helps identify the ideal loading capacity for your HPTLC system.
- Sample Preparation: Prepare a stock solution of your analyte. Create a serial dilution series (e.g., 1:1, 1:2, 1:4, 1:8) using an appropriate solvent [2].
- Plate Preparation: Use a silica gel 60 F₂₅₄ HPTLC plate. Activate by heating at 120°C for 20-30 minutes, then cool in a desiccator [2] [17].
- Sample Application: Apply 1 µL of each dilution as 8 mm bands on the baseline (1.0 cm from bottom), spaced 2.5 cm apart [2] [21]. Use an automated applicator for reproducibility.
- Chromatographic Development: Develop the plate in an optimized mobile phase within a saturated chamber [2].
- Visualization & Analysis: Detect spots under UV light or via appropriate derivatization. Analyze the chromatograms for spot compactness. The highest concentration that produces a sharp, well-defined band without streaking is the optimal loading capacity [2].
Protocol 2: Automated Band Application for Green HPTLC
Automated application significantly enhances reproducibility, reduces human error, and minimizes sample and solvent waste.
- Instrument Setup: Use a validated automated applicator (e.g., Camag Linomat 5) fitted with a 100 µL syringe [21].
- Software Configuration: Input application parameters into the control software (e.g., WinCATS). Standard settings include:
- Application: Execute the application sequence. The instrument will apply samples as narrow, uniform bands, which provide superior resolution to manual spotting [2] [8].
- Post-application: Proceed with chromatographic development in a mobile phase optimized for minimal solvent use and environmental impact, such as the ethyl acetate–ethanol system used in green profiling [22] [21].
The Scientist's Toolkit: Essential Research Reagents & Materials
Table 2: Key Materials for Optimized HPTLC Sample Application
| Item | Function | Technical Specifications & Examples |
|---|---|---|
| HPTLC Plates | High-efficiency stationary phase | Silica gel 60 F₂₅₄, 10x10 cm or 20x20 cm, 0.2 mm thickness; finer particle size (5-6 µm) provides greater resolution than standard TLC [17] [21] [8]. |
| Automated Applicator | Precise, reproducible sample application | e.g., Camag Linomat 5; applies samples as bands for better separation [21]. |
| Micro-syringes | Accurate sample dispensing | Hamilton syringe (e.g., 100 µL); ensure no air bubbles are present to guarantee correct volume [17]. |
| Sample Solvent | Dissolves analyte for application | Low polarity solvent that fully solubilizes sample (e.g., dichloromethane, ethyl acetate, acetone) to prevent spot spreading [2]. |
| Syringe Filters | Removes particulate matter | 0.22 µm pore size; prevents application system clogging and ensures clean, sharp bands [17]. |
Workflow and Relationship Diagrams
Balancing Analysis Time, Resolution, and Solvent Consumption
➤ Troubleshooting Guides
Common HPTLC Issues and Solutions
This table outlines frequent problems encountered during HPTLC method development and provides targeted solutions to balance analysis time, resolution, and solvent consumption.
| Problem | Possible Causes | Solutions & Optimization Strategies |
|---|---|---|
| Sample Streaking [35] [16] | - Sample overload [35] [16]- Inappropriate solvent polarity [16]- pH issues for sensitive compounds [35] | - Dilute the sample solution [35] [16]- For base-sensitive compounds: add 0.1–2.0% acetic or formic acid to mobile phase [35]- For acid-sensitive compounds: add 0.1–2.0% triethylamine or 1–10% ammonia in MeOH/DCM [35] |
| Spots Not Visible [35] [16] | - Low compound concentration [35] [16]- High solvent level dissolving spots [16]- Compound is not UV-active [35] | - Concentrate sample by multiple spotting in same location (dry between applications) [35]- Ensure solvent level is below spotting line [16]- Use alternative visualization (e.g., chemical staining) [35] |
| Spots Too Close to Baseline or Solvent Front [35] | - Eluent not polar enough (spots at baseline) [35]- Eluent too polar (spots at solvent front) [35] | - Increase proportion of polar solvent or choose a more polar solvent (if at baseline) [35]- Decrease proportion of polar solvent or choose a less polar solvent (if at front) [35] |
| Poor Resolution/Spots with Same Rf [35] | - Solvent system cannot distinguish compounds [35] | - Perform "co-spotting": apply standard and sample in same spot to compare Rf values [35]- Change solvent system class (e.g., Polar/hydrocarbon, Polar/dichloromethane, Polar/toluene) [35] |
| Uneven Solvent Front [16] | - Uneven TLC slurry thickness [16]- Plate touching container sides [16] | - Use commercially prepared HPTLC plates for consistency [12]- Ensure chamber is level and plate is properly positioned [16] |
HPTLC Method Optimization Workflow
This diagram illustrates the systematic approach to developing an HPTLC method that effectively balances key performance parameters.
➤ Frequently Asked Questions (FAQs)
Q1: How can I reduce solvent consumption in my HPTLC methods without sacrificing resolution? Adopt green solvent principles and modern techniques. Micellar Liquid Chromatography (MLC) uses surfactants like sodium dodecyl sulphate (SDS) in water-organic mobile phases, drastically reducing toxic organic solvent use [20] [52]. Furthermore, miniaturization and microextraction techniques (e.g., Solid Phase Microextraction) reduce both sample and solvent volume requirements at the sample preparation stage [20]. Always use standardized chamber saturation and development distances to ensure reproducibility, minimizing the need for repeated analyses [21] [12].
Q2: My analysis is taking too long. What factors most directly affect HPTLC development time? Development time is primarily a function of the mobile phase composition and development distance. Using a less viscous mobile phase can speed up development without changing the chemical outcome. The hallmark of HPTLC is its parallel processing capability; unlike HPLC which runs samples sequentially, HPTLC can run up to 20 samples on a single plate in 5-15 minutes, drastically reducing total analysis time per sample [15]. Optimizing the development distance to the minimum required for sufficient resolution also cuts down time.
Q3: What are the most effective strategies to improve resolution between closely migrating compounds? Resolution is improved by optimizing the interaction between the stationary phase, mobile phase, and analytes. Strategies include: fine-tuning the mobile phase composition by using multi-solvent systems (e.g., toluene-methanol-ethyl acetate-acetone mixtures) [53], modifying the silica gel surface with additives like surfactants or ionic liquids to alter selectivity [52], and using chemometrics like the Firefly Algorithm to intelligently select optimal separation factors [21]. Ensuring proper chamber saturation (typically 10-25 minutes) is also critical for reproducible and sharp bands [53] [21].
Q4: Are there green alternatives to traditional organic solvents for HPTLC? Yes, several green alternatives are emerging. Supercritical Fluid Chromatography (SFC), which uses carbon dioxide as the primary mobile phase, is a non-toxic and reusable option [20]. Natural Deep Eutectic Solvents (NADES), composed of natural primary metabolites, are biodegradable and low-toxicity options for extraction and sample preparation [20]. Additionally, using ethanol-water or ethanol-ethyl acetate mixtures instead of more toxic solvents like acetonitrile or chloroform aligns with green chemistry principles [12].
➤ Research Reagent Solutions
Essential Materials for Green HPTLC Method Development
| Reagent/Material | Function & Rationale |
|---|---|
| Silica Gel 60 F254 Plates [53] [12] | The standard stationary phase for normal-phase HPTLC. The F254 indicator fluoresces under 254 nm UV light, enabling visualization of UV-active compounds. |
| Ethyl Acetate / Ethanol Mixtures [21] [12] | A common and relatively green mobile phase combination. Less toxic than solvents like benzene or chlorinated hydrocarbons, and effective for a wide range of compounds. |
| Sodium Dodecyl Sulphate (SDS) [52] | A surfactant used in Micellar Liquid Chromatography (MLC). It forms micelles in the mobile phase, modifying the separation mechanism and allowing the use of aqueous-rich, low-organic solvent systems. |
| Triethylamine & Glacial Acetic Acid [35] [12] | Mobile phase additives used to control pH and suppress the ionization of acidic or basic compounds, reducing tailing and improving band shape for sharper resolution. |
| Natural Deep Eutectic Solvents (NADES) [20] | Green solvents formed from natural compounds (e.g., choline chloride and sugars). Used for environmentally friendly sample preparation and extraction, offering low toxicity and high biodegradability. |
➤ Detailed Experimental Protocols
This protocol is designed for the simultaneous analysis of multiple compounds, such as pharmaceuticals, and their degradation products.
Chromatographic Conditions:
- Stationary Phase: Pre-coated silica gel 60 F254 plates (e.g., 10x10 cm or 20x20 cm, 250 µm thickness from Merck).
- Sample Application: Using an automated applicator (e.g., Camag Linomat 5), apply samples as 6-8 mm bands, 10 mm from the bottom and 20 mm from the left edge. A nitrogen aspirator with a flow rate of 10 µL/s is typical.
- Mobile Phase: A typical multi-solvent system for complex separations is toluene : methanol : ethyl acetate : acetone (2.5 : 1 : 0.5 : 2, v/v/v/v). The chamber should be saturated with mobile phase vapor for 10-15 minutes at room temperature before development.
- Development: Develop the plate in a twin-trough chamber to a distance of 70-80 mm.
- Detection: After development, dry the plates in an oven at 60°C for 4 minutes. Perform densitometric scanning in reflectance/absorbance mode at the optimal wavelength (e.g., 258 nm) using a slit dimension of 2 x 0.1 mm and a scan rate of 4 mm/s.
Method Validation (as per ICH Guidelines):
- Linearity: Spot a series of concentrations in triplicate (e.g., 80–480 ng/band for drug A, 25–150 ng/band for drug B). Plot peak area vs. concentration to determine the correlation coefficient and linear range.
- Precision: Determine intra-day and inter-day precision by analyzing three different concentrations (low, medium, high) in triplicate. The Relative Standard Deviation (RSD) should typically be less than 2%.
- Accuracy: Perform a standard addition/recovery study by spiking a pre-analyzed sample with known quantities of the standard (e.g., 80, 160, 240 ng/band). The recovery should be between 98-102%.
- Robustness: Deliberately introduce small variations in method parameters (e.g., mobile phase composition ±0.1%, development distance ±5 mm) to demonstrate the method's reliability.
- Forced Degradation: Subject the drugs to stress conditions (acid, base, oxidation, heat, light) and confirm that the method can effectively separate the pure drugs from their degradation products.
This protocol emphasizes strategies for reducing environmental impact while maintaining analytical performance.
Green Method Setup:
- Mobile Phase Selection: Prioritize eco-friendly solvents. A mixture of ethyl acetate and ethanol (e.g., 7:3, v/v) is an excellent green alternative to more toxic solvents [21]. Another option is ethyl acetate : methanol : triethylamine : glacial acetic acid (9.00 : 1.00 : 0.10 : 0.05, by volume) [12].
- Plate Preparation: To enhance separation efficiency and reduce solvent use, standard 20x20 cm plates can be trimmed to 10x10 cm [21].
- Chromatography: Use an automated development chamber (e.g., Camag ADC2) with strict control of temperature (25 ± 0.5 °C) and relative humidity (40 ± 2%). A longer pre-saturation time (e.g., 25 minutes) is often used to ensure high reproducibility [21].
Detection and Analysis:
- Scanning: Use a TLC scanner (e.g., Camag TLC Scanner 3) in reflectance-absorbance mode. A scanning speed of 100 nm/s with an 8 x 0.1 mm slit is effective for optimizing the signal-to-noise ratio [21].
- Data Processing: Utilize specialized software (e.g., WinCATS) for data acquisition and processing.
Sustainability Assessment:
- Employ modern greenness assessment tools such as AGREE (Analytical GREEnness Metric), ComplexGAPI, and NEMI (National Environmental Methods Index) to quantitatively score the method's environmental impact [21]. These tools evaluate factors like waste generation, energy consumption, and toxicity of reagents. The goal is to achieve high scores, confirming the method's alignment with the principles of Green Analytical Chemistry (GAC).
Validating and Benchmarking Green HPTLC Methods
Incorporating Green Metrics into ICH Validation Protocols
Frequently Asked Questions (FAQs)
FAQ 1: Why is it necessary to incorporate green metrics into established ICH validation protocols? Integrating green metrics into ICH protocols aligns method validation with the principles of Green Analytical Chemistry (GAC), creating a unified framework that ensures both data reliability and environmental sustainability. This combination, sometimes termed "sustainable analytics," produces methods that are not only precise, accurate, and specific but also minimize environmental impact through reduced solvent consumption, waste generation, and energy use. This integrated approach is becoming a regulatory and industry expectation for modern, responsible analytical practices [54] [15].
FAQ 2: Which green assessment tools are most suitable for evaluating HPTLC methods? Multiple tools are available, each with strengths. A combination is often best for a comprehensive view:
- AGREE (Analytical GREEnness Metric): Employs a 0-1 scale and is highly recommended as it considers all 12 principles of GAC [55] [56] [57].
- Analytical Eco-Scale: A semi-quantitative tool where a higher score (closer to 100) indicates a greener method. It penalizes hazardous reagents, energy consumption, and waste [56].
- GAPI (Green Analytical Procedure Index) / ComplexGAPI: Provides a colored pictogram offering a visual profile of a method's environmental impact across its entire lifecycle [21].
- NEMI (National Environmental Method Index): Uses a simple pictogram to indicate whether a method is persistent, bioaccumulative, toxic, or corrosive [55].
The following table compares these commonly used green assessment tools:
Table 1: Comparison of Key Green Metric Assessment Tools
| Tool Name | Scoring System | Key Advantages | Reported Greenness Scores in HPTLC |
|---|---|---|---|
| AGREE | 0 to 1 (1=greenest) | Considers all 12 GAC principles; provides a comprehensive overall score [57]. | 0.88 for a reverse-phase HPTLC method for Ascorbic Acid [57]. |
| Analytical Eco-Scale | Score up to 100 (100=greenest) | Simple penalty system; easy to interpret and calculate [56]. | Excellent green score for a spectrophotometric method [56]. |
| GAPI/ComplexGAPI | Pictogram (Green/Yellow/Red) | Visualizes environmental impact across multiple steps of the analytical process [21]. | Perfect ComplexGAPI score for an HPTLC method [21]. |
| NEMI | Pictogram (Checkmarks) | Very simple and quick initial evaluation [55]. | Perfect NEMI score for an eco-friendly HPTLC method [21]. |
FAQ 3: A key step in my HPTLC method uses a large volume of chlorinated solvent in the mobile phase. How can I make this step greener? This is a common challenge. The primary strategy is solvent replacement with greener alternatives. Chlorinated solvents like chloroform are highly hazardous. You can systematically screen and optimize your mobile phase using mixtures of safer solvents.
- Eco-friendly Solvent Options: Ethyl acetate, ethanol, and water are among the preferred, greener solvents [21] [57]. For example, a validated HPTLC method for pharmaceutical analysis used a mobile phase of ethyl acetate-ethanol (7:3, v/v), which is significantly safer than chlorinated blends [21].
- Systematic Optimization: Utilize experimental design (e.g., Quality by Design, Taguchi Array) to efficiently find the optimal ratio of these greener solvents that maintains chromatographic resolution while improving the method's green profile [58].
FAQ 4: My green HPTLC method is not providing adequate resolution for the target analytes. What should I troubleshoot? Insufficient resolution in a greener method often stems from suboptimal mobile phase composition or chamber saturation.
- Action 1: Fine-tune the mobile phase. Adjust the ratio of your green solvents in small increments. You may also consider adding minute volumes of modifiers like triethylamine or glacial acetic acid to improve peak shape without drastically increasing toxicity [12] [59].
- Action 2: Optimize chamber saturation. Ensure consistent and adequate saturation of the TLC chamber with mobile phase vapor. A typical saturation time is 15-25 minutes at room temperature. Inconsistent saturation is a major cause of poor resolution and reproducibility [12] [57].
- Action 3: Re-evaluate the stationary phase. If normal-phase silica gel isn't working, switch to a reverse-phase (RP-18) plate. RP-HPTLC often allows the use of aqueous-ethanol mobile phases, which are highly green, and can provide superior separation for certain compounds [55] [57].
Troubleshooting Guides
Troubleshooting Chart: Common Issues in Green HPTLC Method Development
The following diagram outlines a logical workflow for diagnosing and resolving common problems.
Problem: High Solvent Consumption and Waste Generation
Root Cause: Traditional method development relies heavily on trial-and-error, leading to numerous chromatographic runs and high solvent use.
Solution: Implement Analytical Quality by Design (AQbD) and Lean Six Sigma principles.
- Step 1: Define your Analytical Target Profile (ATP). Identify the Critical Quality Attributes (CQAs) like resolution, retention factor, and tailing factor [60] [58].
- Step 2: Perform Risk Assessment. Use an Ishikawa (fishbone) diagram and Failure Mode and Effects Analysis (FMEA) to identify Critical Method Parameters (CMPs) such as mobile phase composition, flow rate (for HPLC), or chamber saturation time (for HPTLC) [60] [58].
- Step 3: Conduct Systematic Optimization. Employ experimental designs (e.g., Box-Behnken, Taguchi Orthogonal Array) to model the relationship between CMPs and CQAs. This finds the optimal method conditions with the fewest experiments, drastically reducing solvent waste [58].
- Step 4: Establish a Control Strategy. Define the method operable design region (MODR) to ensure method robustness while maintaining green credentials [60].
Problem: Method Lacks Adequate Sensitivity for Trace Analysis After Using Greener Solvents
Root Cause: Greener solvents like ethanol-water mixtures may have different elution strengths or detector compatibility compared to traditional solvents.
Solution:
- Strategy 1: Pre-concentration during Sample Preparation. If using Solid-Phase Extraction (SPE), omit the solvent evaporation and reconstitution step. Instead, elute your analytes in a smaller volume of a compatible green solvent to concentrate them [54].
- Strategy 2: Enhance Detection. For HPTLC, couple your method with more sensitive detection techniques like HPTLC-MS or HPTLC-SERS (Surface-Enhanced Raman Spectroscopy). These multimodal platforms provide the high sensitivity needed for trace analysis without compromising the greenness of the separation step [15].
- Strategy 3: Utilize Advanced Materials. Use HPTLC plates modified with materials like Metal-Organic Frameworks (MOFs) for selective analyte enrichment, which can lower detection limits [15].
Key Experimental Protocols
Protocol 1: Developing a Green HPTLC Method Using AQbD Principles
This protocol provides a structured approach to minimize solvent waste during development.
1. Define ATP and CQAs:
- ATP: A precise and accurate HPTLC method for simultaneous quantification of two drugs in a mixture.
- CQAs: Resolution (Rs > 2.0), retardation factor (Rf between 0.2-0.8), and peak symmetry (Tailing Factor < 1.5) [59].
2. Identify and Risk-Assess CMPs:
- Tools: Use an Ishikawa diagram to brainstorm factors. Then, use FMEA to calculate a Risk Priority Number (RPN) for each.
- Typical High-Risk CMPs: Mobile phase composition and ratio, chamber saturation time [60].
3. Execute Experimental Design and Optimization:
- Design: Apply a Box-Behnken Design (BBD) with three factors: Ethyl Acetate ratio (X1), Ethanol ratio (X2), and Saturation time (X3).
- Analysis: Model the data to generate response surfaces and identify the optimal working region that meets all CQAs [58].
4. Validate the Optimized Method per ICH Q2(R2):
- Validate for specificity, linearity, accuracy, precision, LOD, and LOQ using the optimized green conditions [12] [59].
Protocol 2: Validating a Green HPTLC Method with Integrated Sustainability Assessment
Once a method is developed, its performance and greenness must be formally validated.
1. Standard ICH Q2(R2) Validation [59] [57]:
- Linearity: Prepare calibration standards across the range (e.g., 0.50–9.00 µg/band). The correlation coefficient (r) should be ≥ 0.999 [12].
- Precision: Perform intra-day and inter-day assays (n=6). The relative standard deviation (RSD) should be < 2.0% [58].
- Accuracy: Conduct a recovery study via standard addition at three levels (low, medium, high). Recovery should be within 98–102% [59].
- Specificity: Demonstrate that the analyte peak is pure and resolved from other components, including excipients or degradation products [59].
2. Post-Validation Greenness Assessment:
- Calculate the AGREE Score: Input data on energy consumption, waste amount, toxicity of reagents, and other GAC principles into the AGREE calculator software to obtain a score between 0 and 1 [57].
- Perform a Complementary Assessment: Use the Analytical Eco-Scale or GAPI to get a multi-faceted view of the method's environmental performance [56].
The Scientist's Toolkit: Essential Reagents & Materials
Table 2: Key Research Reagent Solutions for Green HPTLC
| Item Name | Function / Purpose | Green Considerations & Examples |
|---|---|---|
| Green Mobile Phase Solvents | To dissolve and separate analytes on the HPTLC plate. | Replace hazardous solvents (e.g., chloroform, hexane) with safer ones like Ethyl Acetate, Ethanol, and Water [21] [57]. |
| Reverse-Phase HPTLC Plates | The stationary phase for separation. | RP-18 plates are often compatible with aqueous-ethanol mobile phases, facilitating greener method development [55] [57]. |
| Internal Standard (e.g., Esomeprazole) | To improve the accuracy and precision of quantification by correcting for procedural losses and instrumental fluctuations [12]. | Should be stable and well-resolved from all analytes under the chosen green mobile phase conditions. |
| Sample Diluent / Extraction Solvent | To dissolve and extract the analyte from the sample matrix. | Methanol or ethanol-water mixtures are common. Ultrasound-assisted extraction can improve efficiency with less solvent [57]. |
| Greenness Assessment Software (AGREE Calculator) | To quantitatively evaluate the method's environmental impact against all 12 GAC principles [57]. | Essential for providing a numerical score (0-1) to support claims of greenness in regulatory submissions and publications. |
The principles of Green Analytical Chemistry (GAC) have become fundamental to promoting sustainability in analytical and research laboratories. The core objective is to avoid the hazardous environmental impact of analytical techniques while simultaneously reducing analysis costs. GAC emphasizes using safer, less toxic, benign solvents, eliminating hazardous substances, and minimizing reagent consumption. Recognizing that a conventional HPLC instrument can generate approximately 0.5 L of organic waste daily, it is imperative to consider the type, amount, and ecological impact of this waste. GAC also aims to minimize hazardous waste and lower energy consumption by utilizing fewer sample preparation steps and low-energy instrumentation [61].
Within this context, High-Performance Thin-Layer Chromatography (HPTLC) is inherently positioned as a greener technique due to its lower solvent consumption per sample compared to other chromatographic methods. To systematically evaluate and validate the environmental friendliness of analytical methods, several standardized assessment tools have been developed. This technical support center provides troubleshooting and guidance for researchers using these tools to quantify and improve the greenness of their HPTLC methods, directly supporting the overarching thesis of reducing solvent consumption in analytical research.
Researchers employ multiple tools to evaluate the environmental impact of their analytical methods. The following table summarizes the primary greenness assessment tools cited in contemporary literature.
Table 1: Key Greenness and Sustainability Assessment Tools
| Tool Name | Full Name | Key Characteristics | Reported Output/Score |
|---|---|---|---|
| AGREE | Analytical GREEnness Metric Approach | A comprehensive software-based tool that evaluates 12 principles of GAC [62]. | A pictogram with a overall score from 0 to 1 [5] [62]. |
| Complex MoGAPI | Complementary Modified Green Analytical Procedure Index | An advanced version of GAPI, providing a more detailed evaluation of the analytical method's lifecycle [62]. | A colored pictogram [62]. |
| RGB 12 Model | Red-Green-Blue 12 Model | A newer algorithm that combines greenness assessment with method validation parameters for a "whiteness" evaluation [62]. | An integrated score evaluating both greenness and performance [62]. |
| NEMI | National Environmental Methods Index | A simpler tool that uses a pictogram with four quadrants to indicate whether certain criteria are met [5]. | A pass/fail pictogram [5]. |
| Analytic Eco-Scale | - | A semi-quantitative tool that penalizes methods for hazardous reagents, energy consumption, and waste [61]. | A numerical score; a higher score indicates a greener method [61]. |
| GAPI | Green Analytical Procedure Index | A widely used pictogram that assesses the environmental impact across the entire analytical process [5]. | A multi-stage colored pictogram [5]. |
The relationship between these tools and their role in a comprehensive sustainability assessment is visualized in the following workflow.
Troubleshooting Common Greenness Assessment Issues
FAQ 1: Why does my HPTLC method receive a low AGREE score even though I use less solvent than an HPLC method?
- Potential Cause: The AGREE tool evaluates 12 principles of Green Analytical Chemistry, not just solvent volume. A low score could be due to the toxicity of the solvents used (Principles 3 and 4), high energy consumption from lengthy procedures (Principle 6), or inadequate waste treatment (Principle 11) [61] [62].
- Solution:
- Replace hazardous solvents: Systematically replace Class 3 solvents (e.g., toluene, chloroform) with greener alternatives like ethanol or ethyl acetate [5].
- Optimize the mobile phase: Reduce the number of components and use solvent-free additives where possible. For example, one study used a micellar mobile phase for HPLC that was entirely organic-solvent free, a principle that can be adapted to HPTLC [61].
- Shorten the development distance on the HPTLC plate to reduce solvent use and analysis time, thereby lowering energy consumption.
FAQ 2: How can I improve the "blueness" or "whiteness" score of my method in the RGB 12 model?
- Potential Cause: The RGB model assesses not only greenness (environmental impact) but also the functional and practical viability of the method ("redness" and "blueness"). A poor overall "whiteness" score might indicate a method that is green but lacks robustness, is too expensive, or has poor accuracy [62].
- Solution:
- Balance performance with greenness. A method must be analytically valid to be truly sustainable.
- Use an internal standard (e.g., Esomeprazole) to improve accuracy and precision, which addresses functional criteria, as demonstrated in a method for veterinary drugs [12].
- Validate the method comprehensively according to ICH guidelines (linearity, accuracy, precision, specificity) to ensure its practical utility and improve its "blueness" score [12] [63].
FAQ 3: My HPTLC method uses a derivatization reagent with sulfuric acid. How severely will this impact my greenness scores?
- Potential Cause: The use of corrosive, hazardous reagents like concentrated sulfuric acid is a significant penalty in all greenness assessment metrics. It violates the principles of using safer chemicals and generating less hazardous waste [61] [17].
- Solution:
- Explore alternative detection methods. First, see if the compound can be detected under UV light at 254 nm or 366 nm without derivatization.
- Investigate milder reagents. If derivatization is unavoidable, research less toxic alternatives to sulfuric acid for the charring process.
- If no alternative exists, ensure the process is meticulously controlled to use the minimal necessary quantity of reagent. All waste must be neutralized and disposed of according to strict safety and environmental protocols [17].
FAQ 4: What are the most common mistakes when preparing an HPTLC method for greenness assessment?
- Mistake 1: Inaccurate quantification of solvent and energy use. Estimates are used instead of precise measurements.
- Mistake 2: Overlooking sample preparation. The assessment focuses only on the chromatographic step.
- Mistake 3: Not using a standardized checklist.
- Correction: Use the criteria from assessment tools like NEMI or the Analytical Eco-Scale as a pre-assessment checklist during method development to proactively identify and mitigate greenness issues [5].
Experimental Protocols for Green HPTLC Method Development and Assessment
Protocol: Developing a Green HPTLC Method
This protocol is adapted from validated methods for drugs like carvedilol and tenoxicam, with a focus on solvent reduction [5] [13].
- Stationary Phase Selection: Use pre-coated HPTLC silica gel 60 F~254~ plates. These plates offer greater resolving power per unit distance and faster development, leading to reduced solvent consumption [17].
- Mobile Phase Optimization (The Key to Greenness):
- Start with a water-ethanol mixture as the baseline green mobile phase.
- If needed, adjust the ratio or add minimal amounts of ethyl acetate or ammonia to achieve separation. Avoid toluene, chloroform, and other hazardous solvents [61] [5].
- Use a micro-scale TLC chamber to test various mobile phase compositions with minimal solvent volume.
- Sample Application:
- Use an automatic applicator (e.g., Camag Linomat) to apply samples as narrow bands. Consistent band width and position are crucial for reproducible R~f~ values and accurate quantification [17] [13].
- Ensure samples are completely solubilized in a green solvent (e.g., ethanol) and filtered (0.22 µm) to prevent syringe clogging and application errors [17].
- Plate Development and Derivatization:
- Develop the plate in a pre-saturated twin-trough chamber. A saturated chamber improves separation efficiency and reproducibility.
- After development, dry the plate thoroughly with a blow-dryer or in a fume hood before any derivatization to prevent spot dissolution [17].
- If derivatization is essential, dip the plate for only a few seconds and use the least hazardous reagent possible. Keep heating time and temperature strictly constant if heat is required [17].
Protocol: Applying the AGREE Assessment Tool
The following workflow outlines the specific steps for evaluating your HPTLC method using the AGREE tool.
- Gather Data: Collect all parameters from your HPTLC method, including the type and volume of all solvents, energy consumption of equipment (e.g., heater, scanner), analysis time, and amount of waste generated.
- Download the Tool: The AGREE calculator is typically available as open-source software [5] [62].
- Input Parameters: Enter the collected data into the software, answering the prompts related to the 12 principles of GAC.
- Interpret Results: The tool generates a circular pictogram with a score from 0 (not green) to 1 (ideal green). Use this to identify weak points (e.g., a red segment in Principle 7 indicates issues with derivatization) and guide optimization [5] [62].
Essential Research Reagent Solutions for Green HPTLC
This table lists key materials and their optimized, green functions for developing sustainable HPTLC methods.
Table 2: Research Reagent Solutions for Green HPTLC Method Development
| Item | Traditional/Hazardous Choice | Greener Alternative & Function |
|---|---|---|
| HPTLC Plates | Conventional TLC plates | HPTLC silica gel 60 F~254~ plates: Thinner layers with smaller, uniform particles provide greater resolving power, faster development, and lower solvent consumption per analysis [17]. |
| Development Solvents | Toluene, Chloroform, Hexane | Ethanol, Ethyl Acetate, Ethanol-Water/Ammonia Mixtures: These are biodegradable, less toxic, and renewable solvents that can effectively separate a wide range of compounds [61] [5] [63]. |
| Sample Solvents | Acetonitrile, Chloroform | Ethanol or Methanol: Can solubilize many pharmaceuticals and natural products with lower toxicity and better environmental profiles [17] [12]. |
| Derivatization Agents | Concentrated Sulfuric Acid | Milder Reagents (e.g., Anisaldehyde), or UV/VIS detection: Using less corrosive reagents or avoiding derivatization altogether significantly improves safety and reduces hazardous waste [17] [65]. |
| Internal Standards | (Compound-dependent) | Esomeprazole or other stable compounds: Used to improve accuracy and precision, which supports the method's practical viability ("blueness" in the RGB model) and reduces the need for repeat analyses, saving reagents [12]. |
High-Performance Liquid Chromatography (HPLC) and High-Performance Thin-Layer Chromatography (HPTLC) are both foundational techniques in analytical chemistry, yet they differ significantly in their solvent consumption profiles. HPLC relies on pressurized flow of mobile phase through a packed column, typically consuming between 50-1000 mL of solvent per day of operation depending on analysis time and flow rate [66] [67]. In contrast, HPTLC utilizes a passive development chamber where mobile phase migrates via capillary action, consuming approximately 5-25 mL of solvent per plate regardless of the number of samples analyzed [15] [7]. This fundamental difference in operational principles creates a substantial divergence in their environmental impact and operational costs, particularly relevant for laboratories pursuing green analytical chemistry objectives.
The movement toward sustainable laboratory practices has elevated solvent consumption as a critical metric in method selection. Modern HPTLC systems have evolved into versatile platforms offering "multimodal and green solutions for food and herbal quality assurance" [15]. The technique's inherent efficiency aligns with core Green Analytical Chemistry (GAC) principles, including waste prevention, minimization of hazardous chemicals, and reduced energy consumption [15]. Quantitative assessment tools like the Modified Green Analytical Procedure Index (MoGAPI) and Analytical GREEnness Metric (AGREE) consistently demonstrate high greenness ratings for HPTLC due to its inherently low solvent volumes and minimal energy requirements [15].
Quantitative Comparison of Solvent Usage
Direct Consumption Metrics
Table 1: Direct Solvent Consumption Comparison Between HPLC and HPTLC
| Parameter | HPLC | HPTLC | Notes |
|---|---|---|---|
| Typical Solvent Volume per Analysis | 5-50 mL per sample [66] [67] | 5-25 mL per plate (multiple samples) [15] [7] | HPLC consumption is sample-dependent; HPTLC consumption is plate-dependent |
| Analysis Time | 30+ minutes per sample [15] | 5-15 minutes for multiple samples [15] | HPTLC processes samples in parallel |
| Daily Operational Consumption | 50-1000 mL [66] [67] | 5-50 mL [15] | Depends on sample volume and operational hours |
| Sample Throughput per Solvent Unit | Lower (sequential analysis) [15] [66] | Higher (parallel processing) [15] [7] | HPTLC can run 15-20 samples on one plate with ~25 mL solvent |
Environmental Impact Assessment
Table 2: Environmental Impact and Sustainability Metrics
| Assessment Metric | HPLC | HPTLC | Implications |
|---|---|---|---|
| Green Analytical Chemistry Alignment | Moderate [15] | High [15] | HPTLC more closely follows GAC principles |
| Waste Generation | Higher [15] [66] | Lower [15] | HPLC generates more hazardous waste |
| Energy Consumption | Higher (pumps, column ovens) [66] [67] | Lower (minimal instrumentation) [15] | HPTLC often operates at ambient pressure/temperature |
| Solvent Reduction Potential | Limited by system requirements [67] | Significant (inherent design) [15] [7] | HPTLC's capillary action is intrinsically efficient |
Experimental Protocols for Solvent-Efficient Analysis
HPTLC Method for Veterinary Drug Residue Analysis
Recent research demonstrates HPTLC's capabilities in pharmaceutical analysis with minimal solvent consumption. A 2025 study developed an FDA-validated eco-friendly HPTLC method for quantification of Florfenicol and Meloxicam in bovine tissues [12]:
Mobile Phase Composition:
- Glacial acetic acid, methanol, triethylamine, and ethyl acetate (0.05:1.00:0.10:9.00, by volume) [12]
- Total volume required: ~10-15 mL per plate
- Development distance: 70 mm
- Development time: 15-20 minutes
- Samples per plate: 10-15
Chromatographic Conditions:
- Stationary phase: Aluminum HPTLC plates coated with 5 μm particle size silica gel 60 F254
- Sample application: CAMAG Linomat IV applicator with 100 μL syringe
- Detection: Densitometric scanning at 230 nm
- Validation: Linear ranges of 0.03-3.00 μg/band for meloxicam and 0.50-9.00 μg/band for Florfenicol [12]
This method exemplifies how HPTLC achieves precise quantitative analysis while consuming minimal solvent volumes compared to equivalent HPLC methods.
Lipophilicity Determination Methods
A 2024 study comparing HPLC, HPTLC, and in silico methods for determining lipophilicity of 5-heterocyclic 2-(2,4-dihydroxyphenyl)-1,3,4-thiadiazoles revealed significant solvent efficiency advantages for HPTLC [68]:
HPTLC Protocol:
- Stationary phases: C8 and C18 modified plates
- Mobile phases: Methanol, acetonitrile, acetone, and dioxane with water
- Consumption: ~10 mL per plate for 15 samples
- Analysis: Multiple samples developed simultaneously
HPLC Protocol:
- Stationary phases: C8, C18, IAM, and cholesterol columns
- Mobile phases: Similar composition but higher volumes
- Consumption: ~20-50 mL for 15 samples (analyzed sequentially)
- Flow rates: 1-2 mL/min [68]
The study concluded that for lipophilicity estimation, "dioxane and MeOH seem to be particularly beneficial as organic modifiers" in HPTLC, highlighting the method's versatility in solvent selection for optimization [68].
HPTLC Experimental Workflow
Troubleshooting Guides for Solvent Reduction
HPTLC-Specific Troubleshooting
Problem: Inconsistent Retention Factors (Rf)
- Cause: Improper chamber saturation or mobile phase composition [7] [17]
- Solution: Ensure consistent saturation time (15-20 minutes) and precise mobile phase preparation [17]
- Solvent Saving Tip: Use twin-trough chambers with minimal mobile phase volume (5-10 mL) [7]
Problem: Spot Tailing or Streaking
- Cause: Sample overload or improper plate activation [17]
- Solution: Activate plates by heating before use; optimize sample concentration [17]
- Solvent Saving Tip: Use band application instead of spotting for better separation efficiency [7]
Problem: Irregular Solvent Front
- Cause: Chamber imbalance or plate surface contamination [17]
- Solution: Handle plates by edges only; ensure level development platform [17]
- Solvent Saving Tip: Implement multiple development technique with same mobile phase [7]
HPLC-Specific Troubleshooting for Solvent Reduction
Problem: Retention Time Drift
- Cause: Mobile phase composition changes or evaporation [69]
- Solution: Prepare fresh mobile phase daily; use sealed containers [69]
- Solvent Saving Tip: Implement micro-flow HPLC to reduce consumption by 60-80% [67]
Problem: High Backpressure
- Cause: Column blockage or viscous mobile phases [69]
- Solution: Filter mobile phases and samples; use less viscous solvents [69]
- Solvent Saving Tip: Shift to UHPLC with smaller particle columns for lower flow rates [67]
Problem: Poor Peak Resolution
- Cause: Suboptimal gradient program or column degradation [69]
- Solution: Optimize gradient profile; replace aged columns [69]
- Solvent Saving Tip: Use computer modeling to optimize methods before solvent consumption [15]
Frequently Asked Questions
Q1: Can HPTLC truly provide quantitative results comparable to HPLC? Yes, modern HPTLC with densitometric detection provides quantitative results comparable to HPLC for many applications. Recent studies demonstrate validated methods for pharmaceutical analysis with precision of 1-2% RSD [12]. The key advantage is that this quantitative data is obtained with significantly lower solvent consumption - typically 10-25 mL per plate for multiple samples versus 5-50 mL per single sample in HPLC [15] [12].
Q2: What specific solvent reduction percentages can be achieved with HPTLC versus HPLC? HPTLC typically reduces solvent consumption by 80-95% compared to conventional HPLC methods [15]. For example, where an HPLC method might consume 500 mL for 10 samples, HPTLC can analyze the same number of samples using only 10-25 mL of solvent [15] [7]. This reduction factor increases with sample throughput due to HPTLC's parallel processing capability.
Q3: How does the greenness of HPTLC compare to HPLC using modern assessment tools? When evaluated using standardized greenness assessment tools like AGREE and MoGAPI, HPTLC consistently demonstrates superior environmental performance [15]. A 2025 study of veterinary drug analysis scored the HPTLC method highly across multiple green metrics due to its minimal solvent consumption, reduced waste generation, and lower energy requirements [12].
Q4: Are there applications where HPLC remains preferable despite higher solvent consumption? Yes, HPLC maintains advantages for applications requiring very high sensitivity (trace analysis at ppb levels), complex multi-dimensional separations, or when coupled with specific detectors like mass spectrometers [66] [67]. However, even in these cases, emerging HPTLC-MS hybrid systems are bridging the gap while maintaining lower solvent consumption [15].
Q5: What are the key methodological considerations when transitioning from HPLC to HPTLC? Critical considerations include: (1) selecting appropriate stationary phases (normal phase vs. reversed phase), (2) optimizing sample application techniques to ensure narrow bands, (3) controlling chamber saturation for reproducibility, and (4) implementing proper detection and derivatization protocols [7] [17]. Method validation should follow ICH guidelines to ensure comparable data quality [12].
Research Reagent Solutions
Table 3: Essential Materials for Solvent-Efficient Chromatography
| Item | Function | HPTLC-Specific Notes | HPLC-Specific Alternatives |
|---|---|---|---|
| HPTLC Plates (5 μm silica) | Stationary phase for separation | Superior to conventional TLC plates; thinner layers with narrower particle distribution [17] | HPLC columns (3-5 μm particles) [67] |
| Automated Sample Applicator | Precise sample deposition | Enables band application for better resolution; critical for quantification [7] | Autosamplers with minimal carryover [67] |
| Twin-Trough Development Chamber | Mobile phase containment | Enables chamber saturation with minimal solvent (5-25 mL) [7] | Gradient pumps with low dwell volume [67] |
| Densitometer Scanner | Quantitative detection | Enables multiple detection modes without additional solvent [7] [12] | Multiple detectors (UV, MS, CAD) [67] |
| Microsyringes (100 μL) | Sample application | Precision syringes for reproducible application [17] [12] | Injection valves with fixed loops [67] |
Solvent Flow Paths: HPLC vs HPTLC
The comparative analysis unequivocally demonstrates HPTLC's superior efficiency in solvent consumption compared to HPLC, with typical reductions of 80-95% while maintaining robust analytical performance [15] [12]. This advantage stems from HPTLC's fundamental operational principle of parallel sample processing via capillary action rather than sequential pressurized elution [7].
Future developments in chromatographic science continue to enhance solvent reduction strategies. Emerging trends include the development of "HPTLC+" multimodal platforms that combine the solvent efficiency of planar chromatography with advanced detection methods like mass spectrometry [15]. Similarly, HPLC technology is evolving toward miniaturized systems (nano-LC, capillary LC) that reduce solvent consumption while maintaining the technique's distinctive advantages for specific applications [67].
The choice between HPTLC and HPLC should be guided by specific analytical requirements, but for laboratories prioritizing sustainability and cost-efficiency, HPTLC represents a compelling alternative that aligns with Green Analytical Chemistry principles without compromising analytical rigor [15] [12]. As solvent waste disposal costs continue to rise and environmental regulations tighten, HPTLC's minimal consumption profile positions it as an increasingly attractive option for routine analytical applications across pharmaceutical, food safety, and environmental monitoring domains.
Experimental Protocol: HPTLC Method for Florfenicol and Meloxicam
This section details the specific methodology for the simultaneous quantification of Florfenicol (FLR) and Meloxicam (MEL) in spiked bovine muscle tissue, as derived from the cited research [70] [12].
Materials and Reagents
- Analytical Standards: Florfenicol (FLR, 98% purity) and Meloxicam (MEL, 99.95% purity).
- Internal Standard (IS): Esomeprazole (ESO, 100.05% purity).
- Solvents: Methanol (HPLC grade), glacial acetic acid, ethyl acetate, triethylamine.
- Sample: Bovine muscle tissue, confirmed to be free of pharmaceutical agents prior to slaughter.
- HPTLC Plates: Aluminum-backed silica gel 60 F₂₅₄ plates (20x20 cm, 0.25 mm thickness).
- Equipment: CAMAG Linomat V autosampler, CAMAG TLC Scanner 3, dual-trough development chamber.
Sample Preparation Protocol
- Homogenization: Thoroughly homogenize 2 grams of bovine muscle tissue in a mortar.
- Spiking: Transfer the homogenate to a sample tube and spike with known quantities of FLR and MEL working standards.
- Add Internal Standard and Reagents: To the spiked tissue, add 300 µL of 0.10 N EDTA and 0.50 mL of the Esomeprazole (ESO) internal standard solution (1000 µg/mL).
- Extraction and Dilution: Bring the final volume to 10 mL with methanol and filter the sample [12].
Chromatographic Conditions
- Application: Samples were applied as 8 mm bands onto the HPTLC plate using an autosampler.
- Mobile Phase: Glacial acetic acid, methanol, triethylamine, and ethyl acetate in a ratio of 0.05:1.00:0.10:9.00 (by volume) [70] [12].
- Development: Ascending development in a dual-trough chamber pre-saturated with mobile phase vapor for 15 minutes at room temperature.
- Detection: Densitometric scanning at 230 nm in reflectance-absorbance mode.
The method was validated per ICH guidelines. Key quantitative parameters are summarized in the table below [12].
Table 1: Validation Parameters for Florfenicol and Meloxicam
| Parameter | Florfenicol (FLR) | Meloxicam (MEL) |
|---|---|---|
| Linearity Range | 0.50 – 9.00 µg/band | 0.03 – 3.00 µg/band |
| Correlation Coefficient (R²) | Not explicitly stated (Excellent correlation confirmed) [70] | Not explicitly stated (Excellent correlation confirmed) [70] |
| Precision (RSD) | ≤ 2% | ≤ 2% |
| Accuracy (Recovery) | Satisfactory results in marketed formulations [70] | Satisfactory results in marketed formulations [70] |
| Detection Mode | Densitometry at 230 nm | Densitometry at 230 nm |
The Scientist's Toolkit: Essential Research Reagents and Materials
Table 2: Key Materials and Equipment for HPTLC Analysis
| Item | Function / Specification | Importance |
|---|---|---|
| Silica Gel 60 F₂₅₄ HPTLC Plates | Stationary phase with 0.25 mm thickness and 10 µm particle size for high-resolution separation [17]. | Superior to conventional TLC plates, providing greater resolving power, faster development, and more reproducible results. |
| Methanol, Ethyl Acetate, Glacial Acetic Acid | Components of the optimized, eco-friendly mobile phase. | A greener solvent system that reduces the environmental impact of the analysis compared to traditional toxic solvents [22] [70]. |
| CAMAG Linomat Autosampler | Automated instrument for applying samples as precise, narrow bands onto the HPTLC plate. | Critical for achieving high reproducibility in both band position and width, which directly impacts the accuracy of Rf values and quantitative results [12] [17]. |
| CAMAG TLC Scanner 3 | Densitometer for quantifying the separated analyte bands in reflectance-absorbance mode. | Enables precise and accurate quantification of the drugs directly on the plate [12]. |
| 0.22 µm Syringe Filter | For filtering prepared samples prior to application on the HPTLC plate. | Removes particulate matter that could clog the autosampler syringe or damage the HPTLC plate surface [2] [17]. |
Experimental Workflow
The following diagram illustrates the logical flow of the HPTLC analysis, from sample preparation to final quantification.
Troubleshooting Guides & FAQs
Poor Separation or Irregular Spot Shape
- Problem: Spots are streaked or show tailing instead of being compact and round.
- Solution:
- Ensure complete sample solubilization. The solvent must completely dissolve the sample to form a homogenous mixture. Always filter the sample through a 0.22 µm syringe filter to remove any particulates that could clog the syringe or cause streaking [17].
- Avoid overloading the plate. Reduce the sample concentration or application volume if streaks appear. A progressive dilution test can help identify the optimal loading [2].
- Activate the plate before use. Silica is hygroscopic and absorbs moisture from the air, which can reduce separation efficiency. Activate plates by heating in an oven (e.g., 120°C for 20-30 minutes) and cool in a desiccator before use [2] [17].
- Ensure proper chamber saturation. Pre-saturate the development chamber with mobile phase vapor for the recommended time (e.g., 15-25 minutes) to prevent edge effects and ensure reproducible solvent fronts [2] [71].
Inconsistent Rf Values Between Runs
- Problem: The migration distance (Rf value) of the same compound varies from one experiment to another.
- Solution:
- Maintain consistent plate activation. Always activate plates using the same time and temperature protocol to ensure a consistent stationary phase activity level [17].
- Control chamber saturation. Strictly adhere to the pre-saturation time and ensure the chamber is properly sealed. Inconsistent vapor equilibrium is a common cause of Rf variation [2].
- Standardize sample application. Keep the starting position and width of the application bands constant. Use an autosampler to ensure application is aligned with the plate's axes and applied at a consistent, slow rate to prevent spot broadening [17].
- Maintain consistent development distance. Develop the plate to the same distance from the origin every time [2].
System Errors and Hardware Issues
- Problem: The HPTLC instrument (e.g., CAMAG system) shows a critical error or fails to initialize.
- Solution:
- Perform a module reset. If a specific module has a critical error (marked in red), first try a "HPTLC PRO Module reset" on that specific unit. This can often resolve the issue without interrupting runs on other modules [64].
- Initiate a system reinitialization. For issues like detecting an unwanted carrier or initialization failure, a "HPTLC PRO SYSTEM reinit" is recommended. The system will reinitialize, which is useful after an external change like manually removing a carrier [64].
- Execute a full system reset. If the error persists, a "HPTLC PRO SYSTEM reset" may be necessary. Note: this will interrupt any running steps and remove in-progress sequences. Before restarting, check the state of the HPTLC plate, as it may be in an unusable state, requiring a fresh start to the analysis [64].
Low Intensity or No Detection of Spots After Derivatization
- Problem: Spots are not visible or have low intensity after applying a derivatization reagent.
- Solution:
- Dry the plate completely after development. Before dipping the plate in the derivatization reagent, ensure it is completely dry using a blow-dryer or air drying. Wet bands can dissolve in the reagent, leading to loss of analyte [17].
- Control dipping time. Do not immerse the plate in the derivatization agent for too long, as this can also dissolve the compounds. A few seconds is usually sufficient to soak the plate evenly [17].
- Standardize heating conditions. If heating is required for detection (e.g., charring), keep the time and temperature of heating constant for every analysis. Use an oven with controlled temperature instead of a hot plate to ensure even heat distribution across the plate [17].
Demonstrating Robustness and Transferability of Eco-Friendly Methods
Troubleshooting Guide: Common HPTLC Issues and Solutions
Why are my sample bands streaking or elongated instead of forming compact spots?
Solution: Streaking often indicates sample overload or improper mobile phase composition.
- Dilute your sample: Prepare a more diluted sample solution and re-run the separation [35]
- Modify mobile phase: For base-sensitive compounds, add 0.1–2.0% acetic or formic acid to the mobile phase. For acid-sensitive compounds, add 0.1–2.0% triethylamine or 1–10% ammonia in methanol/dichloromethane [35]
- Consider stationary phase: For highly polar compounds, use specialized silica TLC plates such as C18 for reversed-phase separation [35]
Why are spots not visible on my developed HPTLC plate?
Solution: This common issue has multiple potential causes and remedies.
- Check detection method: Your compound may not be UV-sensitive. Try alternative visualization methods such as chemical stains [35]
- Concentrate your sample: Spot the sample multiple times in the same location, allowing the solvent to dry between applications [35] [16]
- Verify solvent level: Ensure the solvent level in the development chamber is lower than the spotting line to prevent sample dissolution [35]
- Consider compound volatility: Volatile compounds may evaporate from the plate, making visualization difficult [35]
Why do my compounds migrate too close to the baseline or solvent front?
Solution: This indicates improper mobile phase polarity.
- Compounds at baseline: Your eluent is not polar enough. Increase the proportion of polar solvent or choose a more polar solvent [35]
- Compounds at solvent front: Your eluent is too polar. Decrease the proportion of polar solvent or choose a less polar solvent [35]
- Change stationary phase: In some cases, the only solution may be to change to a different stationary phase (e.g., use reversed-phase) [35]
How can I distinguish between compounds with similar Rf values?
Solution: Use co-spotting technique and optimize solvent systems.
- Co-spotting: Apply the starting material (standard) and the sample in the same spot and compare the resulting Rf values [35]
- Change solvent system: Try different solvent mixture classes: polar/hydrocarbon (e.g., ethyl acetate/hexane), polar/dichloromethane, or polar/benzene (or toluene) [35]
Why is the solvent front running unevenly or crookedly?
Solution: This indicates physical issues with the plate or development chamber.
- Check plate quality: The thickness of the TLC slurry may be uneven, or silica may have fallen off the plate [16]
- Inspect chamber setup: Ensure the plate does not touch the sides of the container, chamber, or filter paper [16]
Experimental Protocols for Robust Eco-Friendly HPTLC
Green HPTLC Method Development for Pharmaceutical Analysis
Reference Protocol: Simultaneous analysis of Levodropropizine and Chlorpheniramine Maleate [72]
Materials and Instruments:
- Stationary phase: TLC Silica Gel 60F254 aluminum sheets (20 × 20 cm, 0.1 mm thickness)
- Mobile phase: Triethylamine:Toluene:Methanol (0.5:3:16 v/v/v)
- Detection wavelength: 270 nm (isoabsorptive point)
- Instrumentation: CAMAG TLC Scanner 3 with winCATS software, Linomat 5 applicator
Methodology:
- Sample preparation: Dissolve 10 mg of each drug in methanol, sonicate for 5 minutes, and dilute to 10 mL (1000 μg/mL)
- Further dilution: Dilute 1 mL to 10 mL with methanol (final concentration 100 μg/mL)
- Application: Apply samples as 6 mm bands 10 mm from bottom edge
- Chromatographic development: Use ascending technique in twin-trough chambers with 30 min saturation time at 25 ± 2°C
- Densitometric analysis: Scan at 270 nm with scanning speed of 20 mm/s
Validation Parameters:
- Linearity: 1500–7500 ng/band for Levodropropizine (r²=0.9959), 100–500 ng/band for Chlorpheniramine Maleate (r²=0.9943)
- Accuracy: 97.07% for Levodropropizine, 96.12% for Chlorpheniramine Maleate
- Robustness assessment: Conducted using 2⁴⁻¹ fractional factorial design evaluating chamber saturation time, solvent front, wavelength, and methanol volume
Sustainability-Focused HPTLC Protocol for Natural Products
Reference Protocol: Green HPTLC method for caffeine determination in energy drinks [73]
Eco-Friendly Materials:
- Stationary phase: Reverse-phase silica gel 60 F254S plates
- Mobile phase: Ethanol-water (55:45 v/v) - classified as green solvents
- Detection: 275 nm
Methodology:
- Sample preparation: Degas energy drinks via ultrasonication, lyophilize for five days
- Extraction: Liquid-liquid extraction using chloroform, concentrate using rotary evaporator at 40°C
- Chromatography: Spot samples as 6 mm bands using automated applicator (150 nL/s application rate)
- Development: Develop in Automatic Developing Chamber to 80 mm distance with 30 min vapor saturation at 22°C
- Detection: Scan at 275 nm with 20 mm/s scanning speed
Greenness Assessment:
- AGREE score: 0.80/1.0 indicating excellent greener profile
- Solvent consumption: Significantly reduced compared to conventional HPLC
Quantitative Data Comparison for Eco-Friendly HPTLC Methods
Solvent Consumption and Sustainability Metrics
Table 1: Solvent Consumption Comparison Between Chromatographic Techniques
| Technique | Solvent Volume per Analysis | Analysis Time | Sample Throughput | Greenness Score (AGREE) |
|---|---|---|---|---|
| HPTLC | <10 mL [15] | 5–15 min [15] | Multiple samples parallel | 0.80–0.83 [22] [73] |
| HPLC | 500–1000 mL [21] | 30+ min [15] | Single sample sequential | Lower due to high solvent use [21] |
| UHPLC | 200–500 mL [21] | 10–20 min [15] | Single sample sequential | Moderate [21] |
Table 2: Performance Metrics of Eco-Friendly HPTLC Methods
| Application | Compounds Analyzed | Mobile Phase | Linearity Range | Rf Values | Reference |
|---|---|---|---|---|---|
| Pharmaceutical | Levodropropizine & Chlorpheniramine | Triethylamine:Toluene:Methanol (0.5:3:16) | 1500–7500 ng/band (LDP)100–500 ng/band (CPM) | 0.39 (LDP)0.59 (CPM) | [72] |
| Mutagenic Impurities | Bisoprolol, Amlodipine, 4-hydroxybenzaldehyde | Ethyl acetate–ethanol (7:3) | - | 0.29 ± 0.02 (HBZ)0.72 ± 0.01 (AML)0.83 ± 0.01 (BIP) | [21] |
| Anticancer Drug | Sorafenib | IPA:water:glacial acetic acid (RP)n-butanol:ethyl acetate (NP) | 200–1000 ng/spot (RP)200–1200 ng/spot (NP) | 0.54 ± 0.2 (RP)0.7 ± 0.2 (NP) | [22] |
| Natural Products | Caffeine | Ethanol-water (55:45) | 50–800 ng/band | - | [73] |
The Scientist's Toolkit: Essential Research Reagents and Materials
Table 3: Key Research Reagent Solutions for Eco-Friendly HPTLC
| Reagent/Material | Function | Eco-Friendly Considerations | Example Applications |
|---|---|---|---|
| Ethanol-Water Mixtures | Green mobile phase | Renewable, biodegradable, low toxicity [73] | Caffeine analysis in energy drinks [73] |
| Ethyl Acetate-Ethanol | Eco-friendly solvent system | Reduced environmental impact vs. acetonitrile [21] | Pharmaceutical impurity testing [21] |
| Silica Gel 60 F₂₅₄ Plates | Stationary phase | Reusable with proper treatment, minimal waste | Universal application [72] [21] |
| Triethylamine | Modifier for basic compounds | Minimal usage (0.1–2.0%) reduces environmental impact [72] [35] | Method for Levodropropizine [72] |
| Acetic/Formic Acid | Modifier for acidic compounds | Biodegradable, less hazardous alternatives | Problem-solving for streaking [35] |
| Metal-Organic Frameworks (MOFs) | Stationary phase modification | Enhanced selectivity enabling greener methods | Trace contaminant detection [15] |
Workflow Visualization
Eco-Friendly HPTLC Workflow
Troubleshooting Decision Guide
Frequently Asked Questions (FAQs)
Method Development Questions
What makes an HPTLC method "eco-friendly"? Eco-friendly HPTLC methods prioritize reduced solvent consumption (<10 mL per analysis), use of green solvents (ethanol, water, ethyl acetate), minimal energy requirements, and reduced waste generation. These methods typically achieve high scores on greenness assessment tools like AGREE, with demonstrated scores of 0.80–0.83 compared to conventional methods [15] [20] [22].
How do I assess the greenness of my HPTLC method? Use established metrics like the AGREE (Analytical GREEnness) tool, which evaluates methods against all 12 principles of green analytical chemistry. Additional assessment tools include ComplexGAPI, GEMAM, and carbon footprint calculation. These tools provide comprehensive sustainability scores for objective comparison between methods [21] [22].
Can HPTLC really replace HPLC for quantitative analysis? Yes, modern HPTLC provides comparable validation parameters to HPLC, with demonstrated linearity (r² ≥ 0.999), precision (RSD ≤ 2%), and accuracy (96–98%) meeting ICH Q2(R2) requirements. HPTLC offers additional advantages including lower solvent consumption, higher sample throughput, and faster analysis times [72] [21].
Technical Implementation Questions
Why is plate activation necessary and how does it affect results? Silica is hygroscopic and absorbs water when exposed to air, which can affect Rf values, particularly for polar compounds. Activation by heating removes absorbed water, ensuring consistent stationary phase activity. Unactivated plates may cause polar compounds to remain tightly bound to silica or affect solvent penetration, especially with non-polar mobile phases [17].
How can I ensure method robustness during transfer between laboratories? Implement robustness testing using experimental design (e.g., fractional factorial design) to identify critical parameters. Studies show that methanol volume in mobile phase, chamber saturation time, and wavelength have minor effects on Rf values, while factors like application position and band width should be standardized. Document all critical parameters and their acceptable ranges [72] [17].
What are the best practices for sample application? Maintain constant band position (aligned with X and Y axes) and width, as these directly affect Rf values and quantitative results. Use filtered samples (0.22 µm) to prevent syringe clogging, ensure complete solubilization, and check for air bubbles in syringes that can cause volume inaccuracies and false positives [17].
Sustainability Questions
Which mobile phases are considered most environmentally friendly? Ethanol-water and ethyl acetate-ethanol mixtures are preferred green solvent systems. Ethanol is renewable, biodegradable, and low in toxicity, while water is inherently safe. These systems have replaced more hazardous solvents like acetonitrile and chlorinated hydrocarbons in many applications while maintaining analytical performance [20] [73].
How does HPTLC compare to other techniques in terms of environmental impact? HPTLC demonstrates superior environmental profiles compared to HPLC/UHPLC, with perfect NEMI scores, high AGREE indices, minimal carbon footprints (0.021–0.037 kg CO₂/sample), and alignment with multiple UN Sustainable Development Goals (SDG 3, 9, 12). The technique consumes significantly less solvent and energy while maintaining high analytical performance [15] [21].
Conclusion
The strategic reduction of solvent consumption in HPTLC method development is not merely an environmental consideration but a cornerstone of modern, efficient, and cost-effective analytical science. By leveraging HPTLC's inherent advantages—including minimal mobile phase volumes (often under 10 mL per run), parallel sample processing, and integration with green assessment tools—researchers can develop methods that are both analytically rigorous and sustainable. The future of HPTLC in biomedical and clinical research is intrinsically linked to its green credentials, with emerging trends pointing towards deeper integration with effect-directed analysis (bioautography), advanced hyphenated techniques like HPTLC-MS, and the adoption of standardized sustainability metrics. Embracing these solvent-reduction strategies will be crucial for laboratories aiming to meet evolving regulatory standards, reduce operational costs, and contribute to greener pharmaceutical and clinical research practices.
References
- 1. Quality by Design in HPTLC: A Review of Method ... [https://www.ijsrtjournal.com/article/Quality-by-Design-in-HPTLC-A-Review-of-Method-Development-Approaches]
- 2. Complete Guide to Thin Layer Chromatography Sample ... [https://www.organomation.com/complete-guide-to-thin-layer-chromatography-sample-preparation]
- 3. 2.3E: Step-by-Step Procedures for Thin Layer ... [https://chem.libretexts.org/Bookshelves/Organic_Chemistry/Organic_Chemistry_Lab_Techniques_(Nichols)/02%3A_Chromatography/2.03%3A_Thin_Layer_Chromatography_(TLC)/2.3E%3A_Step-by-Step_Procedures_for_Thin_Layer_Chromatography]
- 4. LC Troubleshooting Essentials: A Guide to Common ... [https://www.chromatographyonline.com/view/lc-troubleshooting-essentials-a-guide-to-common-problems-and-solutions-for-peak-tailing-ghost-peaks-and-pressure-spikes]
- 5. Eco-friendly and stability-indicating HPTLC method for the ... [https://www.sciencedirect.com/science/article/pii/S2772577425000333]
- 6. An eco-friendly and cost-effective HPTLC method for ... [https://pmc.ncbi.nlm.nih.gov/articles/PMC11063142/]
- 7. High-performance thin-layer chromatography [https://en.wikipedia.org/wiki/High-performance_thin-layer_chromatography]
- 8. High-Performance Thin-Layer Chromatography (HPTLC) [https://ctlatesting.com/blogs/articles/high-performance-thin-layer-chromatography-hptlc]
- 9. How HPTLC Works: A Guide for Researchers at the Bench [https://bitesizebio.com/47784/hptlc-basics-and-instrumentation/]
- 10. Stationary Phases for Modern Thin-Layer Chromatography [https://www.chromatographyonline.com/view/stationary-phases-modern-thin-layer-chromatography]
- 11. Discover the Key Benefits of HPTLC Analysis [https://camag.com/industries-and-application/benefits-of-hptlc/]
- 12. FDA validated ecofriendly HPTLC method for quantification ... [https://www.nature.com/articles/s41598-025-18548-z]
- 13. Development and Validation of HPTLC Method for ... [https://pmc.ncbi.nlm.nih.gov/articles/PMC3507343/]
- 14. Development of validated HPTLC method for quantification ... [https://www.sciencedirect.com/science/article/pii/S1878535213003468]
- 15. Versatile platforms based on HPTLC: Multimodal and ... [https://www.sciencedirect.com/science/article/abs/pii/S0924224425004467]
- 16. Troubleshooting Thin Layer Chromatography: Some TLC ... [https://bitesizebio.com/28553/troubleshooting-thin-layer-chromatography-tlc-tlc/]
- 17. The Do's and Don'ts of HPTLC [https://bitesizebio.com/47838/the-dos-and-donts-of-hptlc/]
- 18. Quality by Design in HPTLC: A Review of Method ... [https://www.ijsrtjournal.com/article/Quality+by+Design+in+HPTLC+A+Review+of+Method+Development+Approaches]
- 19. High Performance Thin Layer Chromatography Plates [https://www.sigmaaldrich.com/US/en/technical-documents/technical-article/analytical-chemistry/thin-layer-chromatography/high-performance-thin-layer-chromatography-plates?srsltid=AfmBOoqR0LLSe2_gUhFQIzNchDuNNVe3guCmECeHlfjziVAfRlwQtdLY]
- 20. Recent Advances In Green Chromatography Techniques ... [https://www.sciencedirect.com/science/article/pii/S2772391725000830]
- 21. Dual-platform integration of HPTLC and firefly algorithm ... [https://pmc.ncbi.nlm.nih.gov/articles/PMC12345108/]
- 22. Ecofriendly densitometric (RP and NP) HPTLC for... methods [https://pubs.rsc.org/en/content/articlelanding/2025/ay/d5ay01031d]
- 23. Residual Solvent Testing in United States: USP & FDA ... [https://resolvemass.ca/residual-solvent-testing-in-united-states-usp-fda-compliance/]
- 24. Pharmeuropa: Revision of Residual Solvents Chapter 2.4. ... [https://www.gmp-compliance.org/gmp-news/pharmeuropa-revision-of-residual-solvents-chapter-2-4-24-published-for-comments]
- 25. Development of techno-economic models for assessment ... [https://www.sciencedirect.com/science/article/abs/pii/S0196890421013182]
- 26. Tips & Tricks for Thin-Layer Chromatography [https://www.sigmaaldrich.com/US/en/technical-documents/technical-article/analytical-chemistry/thin-layer-chromatography/tips-n-tricks-for-thin-layer-chromatography?srsltid=AfmBOoq4Nffx3fCMV912aJcvCqF5bvy8Gr4yh9BVbip22FHtBYZqWuGh]
- 27. High Performance Thin Layer Chromatography - an overview [https://www.sciencedirect.com/topics/agricultural-and-biological-sciences/high-performance-thin-layer-chromatography]
- 28. Stationary phase optimized selectivity liquid chromatography [https://www.sciencedirect.com/science/article/abs/pii/S0021967307007467]
- 29. PRİSMA Model | PDF | Chromatography [https://www.scribd.com/document/626278932/PR%C4%B0SMA-Model]
- 30. High performance thin layer chromatography with eluents ... [https://www.nature.com/articles/s41598-025-99617-1]
- 31. Optimization of high-performance thin-layer ... [https://www.sciencedirect.com/science/article/abs/pii/S0003267025009584]
- 32. Optimization of high-performance thin-layer ... [https://pubmed.ncbi.nlm.nih.gov/41022501/]
- 33. Troubleshooting HPLC Mobile Phase Issues [https://www.chromatographyonline.com/view/troubleshooting-hplc-mobile-phase-issues]
- 34. Troubleshooting — visionCATS 4.1 documentation [https://visioncats-doc.camag.com/401/RegularUserDocumentation/hptlcpro/execution/troubleshooting.html]
- 35. Troubleshooting for Thin Layer Chromatography [https://www.silicycle.com/articles/troubleshooting-for-thin-layer-chromatography/]
- 36. Comparison of TLC and Different Micro TLC Techniques in ... [https://pmc.ncbi.nlm.nih.gov/articles/PMC3779793/]
- 37. CAMAG® HPTLC PRO SYSTEM [https://raystechno.com/product/camag-hptlc-pro-system/]
- 38. HPTLC PRO – Fully Automated Analytical System for ... [https://camag.com/products/hptlc-pro/]
- 39. Online coupling of miniaturized HPLC and high ... [https://www.sciencedirect.com/science/article/pii/S2772582024000019]
- 40. CAMAG® AMD 2 System Automated Multiple Development [https://camag.com/product/camag-amd-2-system-automated-multiple-development/]
- 41. AMD2 Service Manual Guide | PDF | Chromatography [https://www.scribd.com/document/658974781/Service-Manual-AMD2]
- 42. E21: HPTLC - The Other High-Performance Chromatography [https://eas.org/?page_id=5975]
- 43. Method Validation in High-Performance Thin Layer ... [https://www.eurofinsus.com/food-testing/resources/method-validation-in-hptlc-methods-for-food-and-supplements/]
- 44. Troubleshooting — visionCATS 3.1 documentation [https://visioncats-doc.camag.com/301/RegularUserDocumentation/hptlcpro/execution/troubleshooting.html]
- 45. Versatile Platforms based on HPTLC: Multimodal and ... [https://www.sciencedirect.com/science/article/pii/S0924224425004467?dgcid=rss_sd_all]
- 46. Green stability-indicating RP-HPTLC approach for ... [https://pmc.ncbi.nlm.nih.gov/articles/PMC11871598/]
- 47. Tips & Tricks for Thin-Layer Chromatography [https://www.sigmaaldrich.com/US/en/technical-documents/technical-article/analytical-chemistry/thin-layer-chromatography/tips-n-tricks-for-thin-layer-chromatography?srsltid=AfmBOoqTVCexJIryw5TLcDRQIRYeGwOSzkQFLpbnMnAO60V81vD6_BIQ]
- 48. Development of HPTLC method for the simultaneous ... [https://pmc.ncbi.nlm.nih.gov/articles/PMC9148195/]
- 49. Causes Of Poor Resolution in High-Performance Liquid ... [https://www.alwsci.com/news/causes-of-poor-resolution-in-high-performance-85306834.html]
- 50. Tips & Tricks for Thin-Layer Chromatography [https://www.sigmaaldrich.com/US/en/technical-documents/technical-article/analytical-chemistry/thin-layer-chromatography/tips-n-tricks-for-thin-layer-chromatography?srsltid=AfmBOoo6caiStiM_ues0pvJAn5Xe-IpRgrQAghzNgvQK3zp0b-ThtzpA]
- 51. Validated high-performance thin-layer chromatographic ... [https://pmc.ncbi.nlm.nih.gov/articles/PMC9336651/]
- 52. High performance thin layer chromatography with eluents ... [https://pmc.ncbi.nlm.nih.gov/articles/PMC12038010/]
- 53. Application of a Stability-Indicating HPTLC Method ... [https://pmc.ncbi.nlm.nih.gov/articles/PMC3835193/]
- 54. Development and validation of a green/blue UHPLC-MS ... [https://www.nature.com/articles/s41598-025-15614-4]
- 55. Comparing the Greenness and Validation Metrics of ... [https://pmc.ncbi.nlm.nih.gov/articles/PMC11137692/]
- 56. Sustainable eco-friendly ratio-based spectrophotometric and ... [https://bmcchem.biomedcentral.com/articles/10.1186/s13065-023-01020-2]
- 57. A Simple, Cost-Effective, and Green HPTLC Method for the ... [https://www.mdpi.com/2073-4395/12/5/1016]
- 58. Green RP-HPLC method for simultaneous quantification of ... [https://www.sciencedirect.com/science/article/pii/S2772577424000624]
- 59. ICH and US-FDA validated HPTLC methods with ... [https://link.springer.com/article/10.1007/s00764-022-00201-4]
- 60. Green UHPLC approach for the quantitative determination of ... [https://bmcchem.biomedcentral.com/articles/10.1186/s13065-025-01656-2]
- 61. Novel green HPTLC and organic solvent-free micellar LC ... [https://www.sciencedirect.com/science/article/pii/S235255412300311X]
- 62. AGREE, Complex MoGAPI, and RGB 12-model assessments [https://pmc.ncbi.nlm.nih.gov/articles/PMC11568669/]
- 63. a comparative study with HPTLC densitometry [https://www.nature.com/articles/s41598-025-26418-x]
- 64. Troubleshooting — visionCATS 4.0 documentation [https://visioncats-doc.camag.com/400/RegularUserDocumentation/hptlcpro/execution/troubleshooting.html]
- 65. High-performance thin-layer chromatography combined ... [https://www.sciencedirect.com/science/article/pii/S0003267021004700]
- 66. High-performance liquid chromatography [https://en.wikipedia.org/wiki/High-performance_liquid_chromatography]
- 67. HPLC Basics | Thermo Fisher Scientific - US [https://www.thermofisher.com/us/en/home/industrial/chromatography/chromatography-learning-center/liquid-chromatography-information/hplc-basics.html]
- 68. Comparison of HPLC, HPTLC, and In Silico Lipophilicity ... [https://www.mdpi.com/1420-3049/29/11/2478]
- 69. HPLC Troubleshooting Guide [https://scioninstruments.com/us/blog/hplc-troubleshooting-guide-2/]
- 70. FDA validated ecofriendly HPTLC method for quantification ... [https://pubmed.ncbi.nlm.nih.gov/40954163/]
- 71. Dual-platform integration of HPTLC and firefly algorithm-optimized... [https://bmcchem.biomedcentral.com/articles/10.1186/s13065-025-01598-9]
- 72. Stability indicating HPTLC method development and ... [https://link.springer.com/article/10.1007/s44371-025-00124-z]
- 73. A Green High-Performance Thin-Layer Chromatography ... [https://www.mdpi.com/1996-1944/15/9/2965]