Development and Validation of a Green HPTLC Method for Apremilast Analysis Using Ethanol-Water Mobile Phase
This article presents a comprehensive guide to the development, optimization, and validation of a green reversed-phase high-performance thin-layer chromatography (RP-HPTLC) method for the analysis of Apremilast in pharmaceutical products and...
Development and Validation of a Green HPTLC Method for Apremilast Analysis Using Ethanol-Water Mobile Phase
Abstract
This article presents a comprehensive guide to the development, optimization, and validation of a green reversed-phase high-performance thin-layer chromatography (RP-HPTLC) method for the analysis of Apremilast in pharmaceutical products and nanoformulations. Tailored for researchers and drug development professionals, the content covers foundational principles of HPTLC, a detailed step-by-step methodological protocol utilizing an eco-friendly ethanol-water (65:35, v/v) mobile phase, systematic troubleshooting and optimization based on Analytical Quality by Design (AQbD) principles, and rigorous validation as per ICH guidelines. The method demonstrates excellent linearity (100–700 ng/band), precision, and a superior greenness profile, offering a sustainable and robust alternative for routine quality control and stability testing.
Apremilast and Green HPTLC: Principles, Solvent Selection, and Industry Need
Therapeutic Profile and Clinical Applications
Apremilast is an oral, small-molecule inhibitor of phosphodiesterase 4 (PDE4) that has established itself as an important therapeutic option for several inflammatory conditions [1]. It is marketed under the brand name Otezla (immediate-release) and Otezla XR (extended-release) in the United States [2] [3].
FDA-Approved Indications
| Condition | Patient Population | Formulation |
|---|---|---|
| Psoriatic Arthritis | Adults and pediatric patients ≥6 years weighing ≥20 kg | Otezla |
| Adults and pediatric patients ≥6 years weighing ≥50 kg | Otezla XR | |
| Plaque Psoriasis | Adults candidates for phototherapy or systemic therapy | Otezla/Otezla XR |
| Pediatric patients ≥6 years weighing ≥20 kg | Otezla | |
| Pediatric patients ≥6 years weighing ≥50 kg | Otezla XR | |
| Oral Ulcers associated with Behçet's Disease | Adult patients | Otezla/Otezla XR |
Table 1: FDA-approved indications for apremilast [3] [4]
Off-Label Applications
Beyond its approved indications, apremilast shows therapeutic potential for various dermatologic disorders that prove unresponsive to conventional therapy, including hidradenitis suppurativa (acne inversa), atopic dermatitis (eczema), and alopecia areata [1].
Mechanism of Action
Apremilast exerts its therapeutic effects through selective inhibition of phosphodiesterase 4 (PDE4), an enzyme predominantly found in immune cells [1]. This inhibition hinders the breakdown of intracellular cyclic adenosine monophosphate (cAMP), leading to increased cAMP levels [1] [5]. The elevated cAMP levels subsequently modulate key inflammatory pathways by reducing the production of pro-inflammatory mediators such as tumor necrosis factor-alpha (TNF-α), interleukin (IL)-23, IL-12, IL-8, IL-2, interferon-gamma (IFN-γ), CX-CL9, and CX-CL10, while potentially increasing anti-inflammatory mediators like IL-10 [1] [5]. It is important to note that while this mechanism is understood, the exact way in which apremilast provides clinical improvement in various conditions is not completely defined [4].
Diagram 1: Apremilast mechanism of action targeting PDE4 enzyme
Physicochemical and Pharmacological Properties
Fundamental Physicochemical Characteristics
| Property | Specification |
|---|---|
| Chemical Name | N-[2-[(1S)-1-(3-ethoxy-4-methoxyphenyl)-2-methylsulfonylethyl]-1,3-dioxoisoindol-4-yl]acetamide |
| CAS Number | 608141-41-9 |
| Molecular Formula | C₂₃H₂₅N₂O₇S |
| Molecular Weight | 460.51 g/mol |
| Purity | ≥98% |
| Melting Point | 156.1°C |
| Solubility | Insoluble in water; slightly soluble in ethanol; soluble in acetone (20 mg/mL) and DMSO (80 mg/mL) |
| Appearance | White to off-white powder |
Table 2: Physicochemical properties of apremilast [5]
Pharmacokinetic and Metabolic Profile
Apremilast is administered orally and undergoes extensive hepatic metabolism primarily via the cytochrome P450 system, specifically the CYP3A4 enzyme, with a terminal half-life of 6 to 9 hours [1]. The drug is eliminated predominantly by renal excretion (58% in urine) and fecal elimination (39%) [1]. Notably, moderate to severe hepatic impairment does not require dosing adjustments, while severe renal impairment (CrCl <30 mL/min) necessitates dosage reduction [1].
Analytical Method Development: HPTLC Protocol
The development of robust analytical methods is crucial for pharmaceutical analysis. A green reversed-phase high-performance thin-layer chromatography (RP-HPTLC) method has been established for the quantification of apremilast in various formulations [6] [7].
Research Reagent Solutions
| Reagent/Material | Function in Analysis | Specification |
|---|---|---|
| RP-18 silica gel 60 F₂₅₄S HPTLC plates | Stationary phase | Pre-coated plates (20 × 10 cm) |
| Ethanol/Water mobile phase | Greener solvent system | 65:35 (v/v) ratio |
| Apremilast standard | Reference standard | ≥98% purity |
| Nanoparticle formulations | Experimental samples | Prepared using PLGA polymer |
| Nanoemulsion | Experimental samples | Self-emulsifying drug delivery system |
| Commercial tablets | Marketed product analysis | Otezla 30 mg tablets |
Table 3: Essential research reagents for apremilast HPTLC analysis [6]
Detailed HPTLC Methodology
Instrumentation and Conditions
The analysis employs HPTLC instrumentation including a sample applicator (Linomat 5), twin-trough developing chamber, TLC scanner, and WINCATS software. Detection is performed at λmax = 238 nm using a deuterium lamp [6].
Sample Preparation Protocol
- Standard Solution: Prepare apremilast standard stock solution in ethanol
- Tablet Formulation: Weigh and powder tablets, then extract equivalent to 10 mg apremilast
- Nanoformulations: Accurately weigh equivalent to 10 mg apremilast from NP formulation and nanoemulsion
- Serial Dilutions: Prepare working standards in concentration range of 100-700 ng/band
Chromatographic Procedure
- Application: Apply samples as 6 mm bands on RP-HPTLC plates
- Development: Develop in ethanol/water (65:35, v/v) mobile phase saturated for 20 minutes
- Migration Distance: Allow mobile phase to migrate 80 mm in ascending mode
- Drying: Air-dry developed plates completely
- Detection: Scan at 238 nm using densitometry
Method Validation Parameters
The method demonstrates excellent linearity in the 100-700 ng/band range with Rf value of 0.61 ± 0.01. Validation according to ICH Q2(R1) guidelines confirms accuracy (98.40-101.60% recovery), precision, robustness, sensitivity, and specificity for pharmaceutical analysis [6].
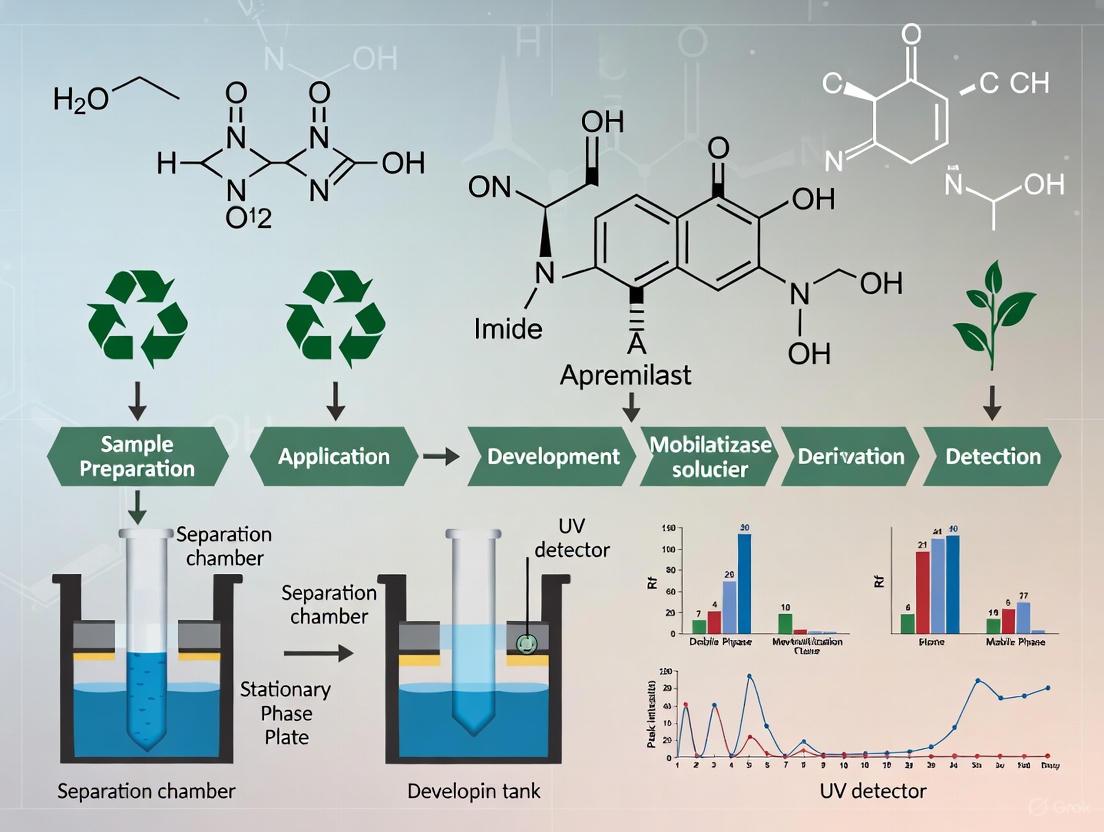
Diagram 2: HPTLC workflow for apremilast analysis
Greenness Assessment
The ethanol/water mobile phase system represents a significant advancement in green analytical chemistry. Assessment using three different metrics confirms its environmental superiority:
- Analytical Eco-Scale (AES): Score of 93 (excellent)
- ChlorTox: 0.66 g (favorable)
- AGREE: 0.89 (outstanding green profile)
This green profile is attributed to the use of ethanol/water instead of traditional acetonitrile-based mobile phases, reducing environmental impact and toxicity while maintaining analytical performance [6] [7].
Apremilast represents an important therapeutic advancement in the management of psoriatic arthritis, plaque psoriasis, and oral ulcers associated with Behçet's disease. Its well-characterized physicochemical properties, particularly solubility profile, have facilitated the development of advanced analytical methods such as the RP-HPTLC technique using ethanol-water mobile phase. The green analytical methodology presented provides researchers with a robust, environmentally friendly tool for pharmaceutical analysis of apremilast in various formulations, supporting ongoing drug development and quality control efforts. The integration of therapeutic understanding with analytical innovation creates a comprehensive framework for advancing apremilast research and application in clinical practice.
High-Performance Thin-Layer Chromatography (HPTLC) has emerged as a sophisticated, automated, and powerful analytical technique that represents a significant advancement over traditional Thin-Layer Chromatography (TLC). As a planar chromatography method, HPTLC provides superior resolution, higher detection sensitivity, and better reproducibility, making it particularly valuable for modern pharmaceutical analysis [8]. This technique operates on the same fundamental principle of adsorption chromatography as TLC, where components in a mixture separate based on their differential affinities toward the stationary phase, with the mobile phase moving via capillary action [8].
In contemporary drug development and quality control laboratories, HPTLC offers a compelling alternative to the more widely established High-Performance Liquid Chromatography (HPLC), particularly when analytical efficiency, cost-effectiveness, and environmental impact are significant considerations. While HPLC remains the gold standard for many applications due to its detector versatility and widespread availability, HPTLC excels as a more economic, eco-compatible, simpler, and faster alternative, especially avoiding the cost and complexity of HPLC-MS systems [9]. The technique's unique capability for parallel rather than sequential analysis of multiple samples on the same plate enables substantially greater analytical throughput, positioning HPTLC as a valuable tool in the modern analytical chemistry landscape [9].
Key Advantages of HPTLC Versus HPLC
Operational and Economic Efficiency
HPTLC demonstrates significant advantages over HPLC in terms of operational efficiency and cost-effectiveness. The ability to process multiple samples simultaneously on a single HPTLC plate dramatically increases throughput and reduces analysis time compared to HPLC's sequential sample processing [9]. Where HPLC analyzes samples one after another, HPTLC can separate up to 20 samples or standards side-by-side on the same plate under identical conditions, effectively condensing hours of HPLC analysis into minutes [8] [9].
The economic benefits of HPTLC extend beyond faster analysis times. The technique requires considerably less solvent consumption due to the minimal mobile phase volume needed for development, resulting in reduced operational costs and environmental impact from solvent waste [9]. Additionally, HPTLC systems have lower maintenance requirements and operating costs compared to HPLC, which demands high-pressure pumps, specialized columns, and more sophisticated instrumentation [9].
Analytical Performance and Flexibility
From an analytical perspective, HPTLC offers several unique advantages. The technique provides a visual chromatogram that allows direct observation of the separation, enabling analysts to quickly assess sample composition and detect unexpected components [8]. All sample components remain on the plate after development, permitting multiple consecutive detection methods on the same separation and enabling post-chromatographic derivatization to enhance detection specificity or sensitivity [10].
HPTLC also demonstrates remarkable flexibility in detection options. A single HPTLC separation can be evaluated using various detection methods including UV/Visible spectroscopy, fluorescence, and mass spectrometry [10]. This hyphenation capability allows for comprehensive analysis, as demonstrated in the identification of cannabinoids in Cannabis sativa, where HPTLC separation combined with mass detection provided higher selectivity for co-eluting compounds than UV detection alone [10].
Table 1: Comparative Analysis of HPTLC versus HPLC for Pharmaceutical Applications
| Parameter | HPTLC | HPLC |
|---|---|---|
| Sample Throughput | High (parallel analysis of multiple samples) [9] | Lower (sequential analysis) [9] |
| Analysis Time | Greatly reduced [8] [9] | Longer per sample |
| Solvent Consumption | Minimal [9] | Significant [9] |
| Cost per Analysis | Low [9] [11] | High [9] |
| Sample Preparation | Minimal requirements [11] | Often extensive |
| Visualization | Visual chromatogram available [8] | No direct visualization |
| Detection Options | Multiple detection methods possible on same plate [10] | Limited to connected detectors |
| Hyphenation Potential | UV/Vis, fluorescence, MS [10] | PDA, MS, others |
Application Note: Quantitative Analysis of Apremilast Using Green RP-HPTLC Methodology
Background and Rationale
Apremilast (APM), a small-molecule phosphodiesterase-4 inhibitor approved for plaque psoriasis and psoriatic arthritis, presents analytical challenges due to its poor solubility and permeability characteristics [12]. While various analytical methods have been reported for APM quantification, including UV spectrophotometry, HPLC, LC-MS, and conventional HPTLC, these methods typically employ toxic solvents in their mobile phases, creating environmental concerns [12]. The development of a greener HPTLC method addresses this limitation while leveraging the technique's inherent advantages for pharmaceutical analysis.
This application note details a validated reversed-phase HPTLC (RP-HPTLC) method for quantifying apremilast in nanoformulations and commercial tablets using an environmentally friendly ethanol-water mobile phase, demonstrating HPTLC's applicability in modern pharmaceutical quality control [12].
Experimental Protocol
Materials and Instrumentation
The analysis utilized the following key materials and instruments, representing essential components of the HPTLC workflow:
Table 2: Research Reagent Solutions and Essential Materials
| Item | Specification | Function/Purpose |
|---|---|---|
| Stationary Phase | RP-18 silica gel 60 F254S HPTLC plates [12] | Separation matrix with fluorescent indicator |
| Mobile Phase | Ethanol/water (65:35, v/v) [12] | Green solvent system for compound separation |
| Standard Solution | Apremilast reference standard [12] | Quantitative calibration and method validation |
| Sample Preparation Solvent | Methanol [12] | Extraction and dissolution of samples |
| Detection System | Densitometer with UV detection at 238 nm [12] | Quantitative measurement of separated compounds |
| Application Device | Automatic TLC Sampler or microsyringe [12] | Precise sample deposition on HPTLC plate |
Sample Preparation
For pharmaceutical formulations, prepare test solutions as follows:
Tablet Formulations: Accurately weigh and powder tablets. Transfer an amount equivalent to 10 mg of APM to a 10 mL volumetric flask. Add approximately 7 mL of methanol, sonicate for 10 minutes, and dilute to volume with methanol. Filter through a 0.45 μm membrane filter [12].
Nanoformulations: Disperse nanoparticles or nanoemulsion equivalent to 10 mg of APM in 10 mL of methanol. Sonicate for 10 minutes and centrifuge at 2750 RCF for 5 minutes. Collect the supernatant for analysis [12].
Standard Solution: Prepare APM standard stock solution at a concentration of 1 mg/mL in methanol. Dilute appropriately to working concentrations ranging from 100-700 ng/band for calibration [12].
Chromatographic Procedure
The HPTLC analysis follows a systematic workflow:
Step-by-Step Methodology:
Plate Pre-washing: Purify HPTLC plates using methanol to remove impurities, including iron present in silica-based sorbents. Use ascending method in a glass chamber [8].
Plate Activation: Activate pre-coated plates by heating in an oven at 110-120°C for 30 minutes to remove absorbed moisture, unless using freshly opened plates [8].
Sample Application: Apply samples and standards as bands (5-8 mm wide) using an automatic sample applicator or microsyringe. Maintain application rate of 150 nL/s. The typical application volume is 2-8 μL, with sample spot diameter not exceeding 1 mm for optimal resolution [8] [12].
Chromatographic Development: Develop the applied plate in a twin-trough chamber pre-saturated with mobile phase (ethanol:water, 65:35 v/v) for 30 minutes. Use ascending development mode at room temperature (25±2°C) with a migration distance of 80 mm [8] [12].
Plate Drying: After development, remove the plate and dry in a vacuum desiccator to completely remove mobile phase, protecting from heat and light [8].
Detection and Visualization: Scan the dried plate at 238 nm using a densitometer equipped with a deuterium lamp. Confirm the identity of APM by comparing the Rf value (0.61±0.01) with that of the reference standard [12].
Quantification: Perform densitometric scanning in absorbance mode at 238 nm using a slit dimension of 5.00×0.45 mm. Quantify APM peaks based on peak area against the calibration curve [12].
Method Validation
The developed RP-HPTLC method was validated according to International Council for Harmonisation (ICH) Q2(R1) guidelines, demonstrating excellent analytical performance [12]:
- Linearity: The method was linear over the concentration range of 100-700 ng/band with correlation coefficient (r²) ≥0.999
- Precision: Expressed as %RSD for intra-day and inter-day precision was <2%
- Accuracy: Determined by recovery studies at three different levels ranged from 98.40-101.60%
- Robustness: Unaffected by small deliberate variations in mobile phase composition and development time
- Specificity: The method successfully distinguished APM from pharmaceutical excipients
Greenness Assessment
The environmental profile of the developed method was evaluated using three different greenness assessment tools, confirming its sustainability credentials [12]:
- Analytical Eco-Scale (AES): Score of 93 (excellent greenness)
- ChlorTox: 0.66 g (low environmental toxicity)
- AGREE: Score of 0.89 (high environmental friendliness)
HPTLC-MS Hyphenation: Advanced Confirmation Capabilities
A significant advancement in HPTLC technology is its hyphenation with mass spectrometry, providing powerful confirmation capabilities comparable to HPLC-MS but with greater flexibility. The direct interface of HPTLC plates with mass detectors enables absolute confirmation of separated compounds, as demonstrated in the analysis of cannabinoids in Cannabis sativa [10].
In HPTLC-MS systems, target zones are directly eluted from the HPTLC plate using a specialized interface with an oval elution head into the mass detector. This configuration allows for higher selectivity in detecting co-eluting compounds compared to UV detection alone, providing greater confidence in analysis [10]. For compounds with poor UV absorbance, mass detection bypasses the need for derivatization steps required in conventional TLC or HPTLC-UV methods, streamlining the analytical process [10].
The HPTLC-MS interface represents a powerful combination where the high-throughput separation capability of HPTLC is enhanced by the definitive identification power of mass spectrometry, creating a comprehensive analytical system that maintains the advantages of planar chromatography while addressing its traditional limitations in compound identification.
HPTLC has firmly established its role as a sophisticated, reliable, and efficient analytical technique in modern pharmaceutical analysis. Its advantages over HPLC—including higher sample throughput, lower operational costs, minimal solvent consumption, and greater analytical flexibility—make it particularly valuable for quality control laboratories, method development, and routine analysis of pharmaceutical formulations.
The application of HPTLC for apremilast quantification using a green ethanol-water mobile phase demonstrates the technique's capability to deliver accurate, precise, and environmentally friendly analytical methods. The successful validation of this RP-HPTLC method according to ICH guidelines confirms its suitability for pharmaceutical analysis, while greenness assessment using multiple metrics highlights its alignment with the principles of sustainable analytical chemistry.
As the pharmaceutical industry continues to seek more efficient, cost-effective, and environmentally responsible analytical approaches, HPTLC offers a compelling alternative to established techniques like HPLC. Its unique combination of visual evaluation capability, parallel processing, method flexibility, and advanced hyphenation potential positions HPTLC as a powerful tool that complements and in some applications surpasses the capabilities of HPLC, particularly for high-throughput qualitative and quantitative analysis in pharmaceutical quality control and drug development.
The Imperative for Green Analytical Chemistry in Pharma
The pharmaceutical industry is increasingly adopting Green Analytical Chemistry (GAC) to mitigate the environmental impact of analytical activities while maintaining the quality and reliability of results [13]. GAC principles provide a framework for developing analytical methods that reduce hazardous waste, minimize energy consumption, and enhance operator safety [14]. This shift is particularly crucial in techniques like High-Performance Thin-Layer Chromatography (HPTLC), where traditional solvent-intensive methods can generate significant waste. The application of GAC principles to HPTLC method development for pharmaceutical compounds such as apremilast represents a significant advancement toward sustainable pharmaceutical analysis. By focusing on ethanol-water mobile phases, researchers can maintain analytical performance while substantially reducing environmental impact compared to conventional organic solvents.
The 12 principles of GAC serve as crucial guidelines for implementing greener practices in analytical procedures [13]. These principles emphasize direct analysis techniques, miniaturization of systems, and the replacement of hazardous solvents with safer alternatives. In pharmaceutical quality control, HPTLC has emerged as an excellent platform for implementing GAC principles due to its relatively low solvent consumption, capacity for parallel sample processing, and minimal energy requirements compared to other chromatographic techniques [15] [14].
GAC Principles and Application to HPTLC
Core Principles for Green HPTLC Methods
The development of green HPTLC methods aligns with several key GAC principles, particularly when applied to pharmaceutical analysis of compounds like apremilast. The most relevant principles include:
Principle 1: Direct analytical techniques should be applied to eliminate sample preparation steps that often consume significant solvents and generate waste [14]. While some sample preparation is typically necessary for pharmaceutical compounds, simplified procedures like direct dilution can be employed.
Principle 5: Automated and miniaturized methods should be selected to reduce reagent consumption and waste generation. HPTLC inherently supports this principle through its minimal mobile phase requirements.
Principle 6: Derivatization should be avoided where possible to reduce additional chemical usage. When necessary, non-toxic reagents should be selected.
Principle 9: Green solvents should be prioritized over hazardous alternatives. The selection of ethanol-water mobile phases directly supports this principle, as ethanol presents significantly lower toxicity and environmental impact compared to acetonitrile or methanol [14].
Green Solvent Selection for HPTLC
The choice of mobile phase constituents critically determines the greenness of an HPTLC method. Ethanol-water systems offer an optimal balance of environmental compatibility, safety profile, and chromatographic performance for pharmaceutical applications. Ethanol is classified as a Class 3 solvent with low toxic potential according to ICH guidelines, making it preferable to Class 2 solvents like methanol or acetonitrile. Additionally, ethanol is biodegradable, readily available, and can be produced from renewable resources, further enhancing its green credentials.
Table 1: Comparison of Solvent Properties for HPTLC Mobile Phases
| Solvent | Safety Profile | Environmental Impact | Chromatographic Utility | GAC Classification |
|---|---|---|---|---|
| Ethanol | Low toxicity, Class 3 solvent | Biodegradable, renewable | Moderate polarity, good for various compound classes | Preferred |
| Water | Non-toxic | No environmental hazard | Polar modifier, adjusts retention | Ideal |
| Methanol | Toxic, Class 2 solvent | High environmental impact | Strong eluting power | Undesirable |
| Acetonitrile | Toxic, Class 2 solvent | Persistent in environment | Strong eluting power, low viscosity | Undesirable |
| Chloroform | Highly toxic, carcinogenic | Environmental hazard | Non-polar solvent | To be avoided |
Experimental Protocols for Green HPTLC Method Development
Development of HPTLC Method for Apremilast Using Ethanol-Water Mobile Phase
Materials and Equipment:
- HPTLC silica gel 60 F254 plates (10 × 10 cm or 20 × 10 cm)
- Apremilast reference standard (purity ≥98%)
- Ethanol (HPLC grade)
- Deionized water
- HPTLC sample applicator (Linomat 5 or equivalent)
- HPTLC development chamber (twin-through or horizontal)
- HPTLC densitometer with UV detector
- Data evaluation software
Standard Solution Preparation:
- Prepare stock solution of apremilast by accurately weighing 10 mg of reference standard and dissolving in 10 mL of ethanol to obtain a concentration of 1 mg/mL.
- Prepare working standard solutions by appropriate dilution of the stock solution with ethanol to obtain concentrations ranging from 10-500 ng/μL for calibration curve construction.
- For sample analysis, extract powdered tablet equivalent to 10 mg of apremilast in 10 mL of ethanol by sonication for 15 minutes. Filter through 0.45 μm membrane filter before application.
Chromatographic Conditions:
- Stationary phase: HPTLC silica gel 60 F254 plates
- Mobile phase: Ethanol-water in optimized ratio (e.g., 85:15, v/v)
- Application volume: 2-8 μL as bands (band length: 6-8 mm)
- Development distance: 70-80 mm in twin-through chamber
- Development mode: Ascending, at room temperature (25°C ± 2)
- Saturation time: 20 minutes with mobile phase
- Detection: Densitometric scanning at 260 nm
Method Optimization Procedure:
- Mobile phase optimization: Systematically evaluate different ratios of ethanol-water (from 70:30 to 90:10) to achieve optimal resolution of apremilast (Rf value between 0.3-0.7).
- Chamber saturation: Optimize chamber saturation time (10-30 minutes) to ensure reproducible Rf values.
- Detection wavelength: Record spectrum of apremilast standard between 200-400 nm and select wavelength of maximum absorption (approximately 260 nm).
Method Validation Protocol
The HPTLC method must be validated according to ICH guidelines to ensure reliability, accuracy, and reproducibility for pharmaceutical analysis [16]. Key validation parameters and procedures include:
Specificity:
- Apply apremilast standard, sample solution, and placebo solution on same HPTLC plate.
- Develop plate using optimized ethanol-water mobile phase.
- Confirm that the apremilast peak in the sample solution is identical in Rf value to the standard and that there is no interference from excipients at the same Rf.
Linearity and Range:
- Apply a series of standard solutions (e.g., 20, 40, 60, 80, 100 ng/band) in triplicate.
- After development and scanning, record peak areas and prepare calibration curve (peak area vs. concentration).
- Calculate correlation coefficient, which should be not less than 0.998.
Precision:
- Intra-day precision: Analyze six replicates of sample solution at three concentration levels (50, 100, 150 ng/band) on the same day.
- Inter-day precision: Repeat the analysis on three different days.
- Calculate %RSD for peak areas, which should be not more than 2%.
Accuracy (Recovery Studies):
- Perform standard addition method at three concentration levels (80%, 100%, 120% of target concentration).
- Add known amounts of apremilast standard to pre-analyzed sample solution.
- Calculate percentage recovery, which should be between 98-102%.
Robustness:
- Deliberately vary method parameters including mobile phase composition (±2%), development distance (±5 mm), and saturation time (±5 minutes).
- Evaluate impact on Rf values and peak areas.
- System suitability criteria should be met under all varied conditions.
Table 2: Method Validation Parameters for Apremilast HPTLC Analysis
| Validation Parameter | Experimental Design | Acceptance Criteria |
|---|---|---|
| Specificity | Compare standard, sample, and placebo chromatograms | No interference at apremilast Rf |
| Linearity | 5 concentrations in triplicate (20-100 ng/band) | R² ≥ 0.998 |
| Precision (Repeatability) | 6 replicates at 100% concentration | RSD ≤ 2% |
| Intermediate Precision | Different analyst/different day | RSD ≤ 2% |
| Accuracy | Recovery at 3 levels (80%, 100%, 120%) | 98-102% recovery |
| Robustness | Deliberate small changes in parameters | RSD ≤ 2% for system suitability |
| LOD | Signal-to-noise ratio 3:1 | Approximately 5 ng/band |
| LOQ | Signal-to-noise ratio 10:1 | Approximately 15 ng/band |
Greenness Assessment of Analytical Methods
GAC Metrics for Method Evaluation
The greenness of the developed HPTLC method should be quantitatively evaluated using established GAC metrics [13]. Multiple tools are available for comprehensive assessment:
Analytical Eco-Scale: This semi-quantitative tool assigns penalty points to hazardous reagents, energy consumption, and waste generation [13]. An ideal green analysis scores 100 points, with penalties subtracted for each non-green parameter. The HPTLC method with ethanol-water mobile phase would receive minimal penalty points due to the low toxicity of solvents and minimal waste generation.
AGREE (Analytical Greenness Calculator): This metric uses the 12 GAC principles as criteria, providing a score between 0-1, with 1 representing ideal greenness [13]. The tool considers factors like sample preparation, derivatization, and reagent toxicity, offering a pictogram for visual communication of environmental impact.
NEMI (National Environmental Methods Index): This simple pictogram-based tool evaluates four criteria: PBT (persistent, bioaccumulative, toxic) chemicals, hazardous waste, corrosivity, and waste amount [13]. A method receives a green checkmark for each criterion met.
Table 3: Comparison of GAC Assessment Tools for HPTLC Method
| GAC Metric | Scoring System | Key Assessment Criteria | Advantages |
|---|---|---|---|
| Analytical Eco-Scale | Points system (0-100); higher score = greener | Reagent toxicity, energy, waste | Semi-quantitative, easy calculation |
| AGREE | 0-1 scale; 1 = ideal greenness | 12 GAC principles | Comprehensive, visual output |
| NEMI | Pictogram with 4 quadrants | PBT, hazardous waste, corrosivity, waste amount | Simple, quick visual assessment |
| GAPI | Pictogram with 5 pentagrams | Entire method lifecycle | Detailed, includes sample prep to detection |
| BAGI | Numerical score with color code | Applicability, practicality | Focuses on practical implementation |
Research Reagent Solutions for Green HPTLC
Table 4: Essential Materials for Green HPTLC Analysis of Apremilast
| Research Reagent/Material | Function in HPTLC Analysis | Green Alternative/Rationale |
|---|---|---|
| HPTLC Silica Gel 60 F254 Plates | Stationary phase for compound separation | Reusable with appropriate cleaning (for pre-cleaning evaluation) |
| Ethanol (95%) | Major mobile phase component | Green solvent: low toxicity, biodegradable, renewable source |
| Deionized Water | Mobile phase modifier | Ideal green solvent: non-toxic, readily available |
| Apremilast Reference Standard | Method development and quantification | Accurate weighing minimizes waste generation |
| Microsyringe (Linomat) | Sample application as precise bands | Automated application reduces human error and solvent contact |
| Twin-Trough Development Chamber | Controlled mobile phase development | Minimal mobile phase volume required (10-20 mL) |
| UV-Densitometer | Quantitative scanning of separated bands | Non-destructive detection enables documentation and re-evaluation |
Workflow and Signaling Pathways
The following workflow diagrams illustrate the key processes in green HPTLC method development and the relationship between GAC principles and analytical practices.
Green HPTLC Method Development Workflow
GAC Principles Driving Method Development
The implementation of Green Analytical Chemistry principles in pharmaceutical HPTLC analysis represents an essential step toward sustainable laboratory practices. The development of HPTLC methods for apremilast using ethanol-water mobile phases demonstrates that satisfactory analytical performance can be maintained while significantly reducing environmental impact. This approach aligns with the broader pharmaceutical industry goals of reducing ecological footprint while maintaining rigorous quality control standards. As GAC metrics continue to evolve, the quantitative assessment of method greenness will become increasingly standardized, enabling more objective comparisons between conventional and green analytical methods. The protocols and applications presented herein provide a practical framework for researchers to develop environmentally conscious HPTLC methods without compromising analytical validity.
The principles of Green Analytical Chemistry (GAC) are driving a paradigm shift in pharmaceutical analysis, compelling researchers to seek alternatives to hazardous solvents without compromising analytical performance. Within this framework, ethanol-water mixtures have emerged as a superior green mobile phase for chromatographic techniques, including Reversed-Phase High-Performance Thin-Layer Chromatography (RP-HPTLC). This application note delineates the scientific, environmental, and practical rationales for selecting ethanol-water as an ideal mobile phase, contextualized within method development for apremilast. The convergence of renewable sourcing, favorable physicochemical properties, and excellent chromatographic performance establishes this solvent system as a cornerstone for sustainable analytical practices in drug development.
The Green Chemistry Imperative in Chromatography
Traditional chromatographic methods, particularly in pharmaceutical quality control, have historically depended on large volumes of hazardous organic solvents. Conventional Reversed-Phase High-Performance Liquid Chromatography (RP-HPLC) processes, for instance, can generate approximately 1.5 liters of waste daily, a significant portion of which comprises toxic solvents like acetonitrile and methanol [17]. These solvents are problematic from both safety and environmental perspectives; acetonitrile is toxic through multiple exposure routes and can produce hydrogen cyanide upon improper disposal, while methanol is highly toxic to aquatic organisms [18].
The twelve principles of GAC provide a structured framework for evaluating and improving the environmental footprint of analytical methods. Key principles relevant to mobile phase selection include:
- Prevention of Waste: Minimizing or eliminating waste generation.
- Safer Solvents and Auxiliaries: Using substances with minimal environmental toxicity and human health impacts.
- Design for Energy Efficiency: Reducing overall energy requirements.
- Inherently Safer Chemistry for Accident Prevention: Choosing solvents with lower volatility and flammability risks [19] [14].
Ethanol-water mobile phases align robustly with these principles, offering a pathway to more sustainable pharmaceutical analysis without sacrificing the rigorous validation standards required for drug quantification and impurity profiling.
Ethanol as a Green Solvent: Properties and Advantages
Environmental and Safety Profile
Ethanol possesses an outstanding environmental and safety profile compared to traditional chromatographic solvents, as detailed in the table below:
Table 1: Comparison of Ethanol with Traditional Chromatographic Solvents
| Property | Ethanol | Acetonitrile | Methanol | Chloroform |
|---|---|---|---|---|
| Toxicity to Humans | Low (safer for inhalation and dermal exposure) | High (toxic via ingestion, inhalation, skin absorption) | High (toxic if inhaled, absorbed, or ingested) | High (suspected carcinogen) |
| Environmental Impact | Biodegradable, lesser ecological impact | Toxic to aquatic life, can persist in environment | Highly toxic to aquatic organisms | Toxic, environmental persistent |
| UV Cutoff (nm) | ~210 [18] | ~190 | ~205 | ~245 |
| Disposal Concerns | Lower toxicity reduces waste management costs | Requires specialized treatment; produces hydrogen cyanide if improperly combusted | Requires careful waste management | Requires specialized hazardous waste disposal |
| Flammability | Flammable but lower vapor pressure reduces inhalation risk [18] | Flammable | Flammable | Non-flammable |
| Green Chemistry Score | Preferred in solvent selection guides [17] | Problematic (CHEM21 classification) [17] | Problematic | Avoid |
Renewable Sourcing and Economic Benefits
A pivotal advantage of ethanol is its production from renewable biomass rather than petrochemical feedstocks. Bioethanol is derived from the fermentation of plant materials such as sugarcane, corn, cassava, and agricultural residues [19] [18]. This renewable origin significantly reduces reliance on fossil fuels and contributes to a lower carbon footprint over the solvent's lifecycle. Furthermore, the utilization of locally produced bioethanol supports bio-circular-green economies, stimulates agricultural investment, creates jobs, and enhances rural incomes [18]. Research has demonstrated that fuel-grade bioethanol (>99.5% purity) can perform equivalently to imported HPLC-grade ethanol in pharmaceutical analysis, offering a cost-effective and sustainable sourcing strategy [18].
Physicochemical and Chromatographic Properties
Despite a higher viscosity that can increase backpressure, ethanol's favorable elution strength and adjustable selectivity make it highly effective in reversed-phase systems. This challenge is readily mitigated by using slightly elevated column temperatures or reduced flow rates [17] [18]. Ethanol's UV cutoff of approximately 210 nm is acceptable for many analyses, permitting detection at low wavelengths for a broad range of pharmaceuticals, although it may require careful method optimization for applications needing detection below this threshold [17].
Figure 1: Key Advantages of Ethanol-Water Mobile Phase. This diagram illustrates the dual benefits of using ethanol-water mixtures in chromatographic methods, highlighting both environmental/economic and technical advantages.
Application in HPTLC for Apremilast Analysis
The development of a greener RP-HPTLC-densitometry method for apremilast (APM) quantification in nanoformulations and commercial tablets exemplifies the practical application of ethanol-water mobile phases. This method successfully replaces traditional normal-phase HPTLC systems that often employ chlorinated solvents like chloroform or other hazardous organic mixtures [6]. The RP-HPTLC method utilizes RP-18 silica gel 60 F254S HPTLC plates with a green eluent system of ethanol-water (65:35, v/v), achieving well-defined separation of APM at Rf = 0.61 ± 0.01 with detection at 238 nm [6].
Experimental Protocol
Materials:
- Standard and Samples: Apremilast reference standard, pharmaceutical tablets, or nanoformulations.
- Stationary Phase: RP-18 silica gel 60 F254S HPTLC plates (e.g., from Merck).
- Mobile Phase: Ethanol-water (65:35, v/v). Use HPLC-grade or high-purity bioethanol (>99.5%) and purified water (e.g., Milli-Q).
- Instrumentation: CAMAG HPTLC system or equivalent, including sample applicator, automated developing chamber, and TLC scanner with winCATS software.
Chromatographic Procedure:
- Sample Preparation: Prepare stock solutions of APM standard and sample formulations in ethanol or ethanol-water mixture. For tablet analysis, powder tablets and extract an equivalent weight of APM (e.g., 100 mg) in diluent, sonicate, and dilute to volume. Filter through a 0.45-μm membrane before application.
- Plate Application: Apply samples and standards as bands (e.g., 6 mm width) onto the RP-18 HPTLC plates using an automatic applicator (e.g., CAMAG ATS4). Application rate: 150 nL/s.
- Chromatogram Development: Develop the plate in an automated developing chamber (ADC2) pre-saturated with mobile phase vapor for 20 min. Development distance: 80 mm.
- Densitometric Analysis: Scan the developed plate at λ = 238 nm using a TLC scanner. Set slit dimensions to 4.00 × 0.30 mm and scanning speed to 20 mm/s.
- Quantification: Construct a calibration curve by plotting peak areas against concentrations of APM standard (e.g., 100-700 ng/band). Determine APM content in unknown samples from the calibration curve.
Method Validation: The method should be validated for linearity, accuracy, precision, specificity, robustness, and sensitivity (LOD and LOQ) per ICH Q2(R1) guidelines [6].
Greenness Assessment
The green profile of the APM method was quantitatively evaluated using multiple assessment tools:
- Analytical Eco-Scale (AES): Score of 93, indicating excellent greenness (ideal is 100).
- ChlorTox: Score of 0.66 g, reflecting minimal environmental impact.
- AGREE Metric: Score of 0.89, demonstrating high alignment with all 12 GAC principles [6].
Similar greenness assessments comparing normal-phase (chloroform-methanol) and reversed-phase (ethanol-water) HPTLC methods for ertugliflozin confirmed the superior environmental profile of ethanol-water systems, with RP-HPTLC demonstrating better scores across all greenness metrics [20].
The Scientist's Toolkit: Essential Research Reagents
Table 2: Essential Materials for Greener HPTLC Method Development
| Item | Specification/Example | Function/Role in Analysis |
|---|---|---|
| Green Solvent | Ethanol (HPLC-grade or high-purity bioethanol) | Primary organic modifier in mobile phase; less toxic alternative to acetonitrile/methanol. |
| Stationary Phase | RP-18 silica gel 60 F254S HPTLC plates | Reversed-phase plates for separation; F254S indicates fluorescence indicator for UV detection. |
| Standard | Apremilast reference standard (e.g., >98% purity) | Method development, calibration, and quantification. |
| Water | Milli-Q or HPLC-grade water | Aqueous component of mobile phase; minimizes interference and baseline noise. |
| HPTLC Instrumentation | CAMAG system (e.g., ATS4, ADC2, TLC Scanner 3) | Precise sample application, controlled development, and accurate densitometric detection. |
| Data Analysis Software | winCATS (version 1.4.3) | Data acquisition, peak integration, and calibration curve generation. |
The compelling body of evidence from pharmaceutical analysis demonstrates that ethanol-water mobile phases represent an ideal green chromatographic system that successfully balances analytical performance with environmental responsibility. The method for apremilast, utilizing ethanol-water (65:35, v/v) in RP-HPTLC, exemplifies this approach, providing a validated, stability-indicating, and eco-friendly alternative to traditional methods. As the pharmaceutical industry increasingly prioritizes sustainability, adopting ethanol-water mobile phases, particularly those incorporating locally sourced bioethanol, offers a viable pathway toward reducing the environmental footprint of analytical quality control while maintaining rigorous performance standards. This strategy aligns with global sustainability initiatives and supports the development of circular bioeconomies, marking a significant step forward in green pharmaceutical analysis.
Review of Existing Analytical Methods for Apremilast and Identifying the Research Gap
Apremilast (APM) is an oral, selective phosphodiesterase-4 (PDE4) inhibitor approved for the treatment of moderate-to-severe plaque psoriasis and other immune-mediated inflammatory conditions [21] [22]. The growing therapeutic use of apremilast has increased the demand for robust, reliable, and environmentally sustainable analytical methods for its quantification in pharmaceutical dosage forms, biological fluids, and novel drug delivery systems. This review comprehensively evaluates existing analytical methodologies for apremilast, with particular focus on the emergence of green analytical chemistry principles in method development. A critical assessment of the literature reveals that while various techniques have been established, a significant research gap exists in the development and validation of greener high-performance thin-layer chromatography (HPTLC) methods utilizing ethanol-water mobile phases, which offer substantial environmental and practical advantages over conventional approaches.
Chromatographic Methods
Various chromatographic techniques have been developed and validated for the quantification of apremilast in bulk drug, pharmaceutical formulations, and biological matrices. These methods differ in their separation mechanisms, detection systems, and applications.
Table 1: Chromatographic Methods for Apremilast Analysis
| Method Type | Stationary Phase | Mobile Phase | Detection | Linear Range | Key Applications | Reference |
|---|---|---|---|---|---|---|
| HPLC (Impurity Profiling) | Cosmosil C-18 (250 mm × 4.6 mm, 5 μm) | 0.05% TFA, Methanol, Acetonitrile (Gradient) | PDA | Not Specified | Separation and determination of potential related impurities (starting materials, by-products, degradants) | [23] |
| Greener RP-HPTLC | RP-18 silica gel 60 F254S HPTLC plates | Ethanol/Water (65:35, v/v) | Densitometry λmax = 238 nm | 100–700 ng/band | Nanoformulations, commercial tablets | [6] [7] |
| Characterization Method | Not Specified | Not Specified | NMR Spectroscopy, Mass Spectrometry | Not Specified | Structure elucidation of synthesized impurities | [23] |
Spectrophotometric Methods
Traditional spectrophotometric methods have been developed for the estimation of apremilast in bulk and formulations. A review by Pagar et al. summarizes several analytical methods, including spectrophotometric approaches, though specific methodological details for spectrophotometry were not provided in the available search results [24]. Another study by Badhe et al. mentions the development and validation of spectrophotometric methods alongside chromatographic techniques, but similarly lacks specific parameters for the spectrophotometric methods in the available abstract [23].
Detailed Experimental Protocols for Key Analytical Methods
Protocol for Greener Reversed-Phase HPTLC-Densitometry Method
The following detailed protocol is adapted from the greener RP-HPTLC method developed for the quantification of apremilast in nanoformulations and commercial tablets [6] [7].
Materials and Equipment
- Analytical Standard: Apremilast pure reference standard
- Samples: Marketed tablets, self-made nanoparticles (NPs), and nanoemulsions
- Stationary Phase: RP-18 silica gel 60 F254S HPTLC plates
- Mobile Phase: Ethanol/Water in the ratio of 65:35 (v/v)
- Equipment: HPTLC system equipped with automatic sample applicator, development chamber, and TLC scanner
Preparation of Standard Solutions
- Prepare stock solution of pure apremilast in an appropriate solvent.
- Prepare working standard solutions by serial dilution to obtain concentrations within the linear range of 100-700 ng/band.
Sample Preparation
- For Tablets: Weigh and powder tablets. Extract an equivalent amount of apremilast from the powder using an appropriate solvent through sonication and filtration.
- For Nanoformulations: Dilute the NP formulation or nanoemulsion with solvent to obtain a concentration within the linear range.
Chromatographic Conditions and Procedure
- Application: Apply standard and sample solutions as bands (e.g., 6 mm width) on the HPTLC plate using an automatic applicator.
- Development: Develop the plate in a twin-trough glass chamber previously saturated with mobile phase vapor for 20 minutes at room temperature.
- Migration Distance: Allow the mobile phase to migrate over an appropriate distance (e.g., 80 mm).
- Drying: Dry the developed plate at room temperature.
- Detection: Scan the bands at 238 nm using a TLC scanner in densitometry mode.
- Rf Value: Apremilast typically shows a single band at Rf = 0.61 ± 0.01.
Method Validation
The method should be validated according to ICH Q2(R1) guidelines for the following parameters:
- Linearity: Over the range of 100-700 ng/band with correlation coefficient >0.999
- Accuracy: Through recovery studies at multiple levels (e.g., 80%, 100%, 120%)
- Precision: Both intra-day and inter-day precision with %RSD <2%
- Specificity: Confirmed by analyzing standard and sample bands, with no interference from excipients
- Robustness: Evaluated by deliberate variations in mobile phase composition, development distance, etc.
Protocol for HPLC Method for Related Impurities
This protocol summarizes the HPLC method developed for separation and determination of potential related impurities in apremilast drug substance [23].
Chromatographic Conditions
- Column: Cosmosil C-18 (250 mm × 4.6 mm, 5 μm)
- Mobile Phase: Optimized mixture of 0.05% trifluoroacetic acid, methanol, and acetonitrile under gradient elution
- Detection: Photodiode array (PDA) detector
- Flow Rate: Typically 1.0 mL/min (specific value to be optimized)
- Injection Volume: 10-20 μL (to be optimized)
- Column Temperature: Ambient or controlled (e.g., 30°C)
Forced Degradation Studies
- Acidic Degradation: Treat apremilast solution with 0.1N HCl at room temperature or under heating.
- Basic Degradation: Treat with 0.1N NaOH at room temperature or under heating.
- Oxidative Degradation: Treat with hydrogen peroxide (e.g., 3% or 30%).
- Thermal Degradation: Expose solid apremilast to dry heat (e.g., 70°C).
- Photolytic Degradation: Expose to UV light as per ICH conditions.
The method successfully separated two major degradant impurities found in forced degradation studies, which were characterized by HPLC-MS studies and synthesized in the laboratory [23].
Greenness Assessment of Analytical Methods
Greenness Evaluation Tools
The environmental impact of analytical methods can be systematically evaluated using multiple assessment tools:
- Analytical Eco-Scale (AES): A semi-quantitative tool that assigns penalty points to hazardous reagents and procedures; a higher score (closer to 100) indicates a greener method [6] [7].
- ChlorTox: Assesses the toxicity and environmental impact of chlorinated solvents, reporting results in grams of equivalent chlorinated solvents [6].
- Analytical GREENness (AGREE): A comprehensive metric that evaluates methods against all 12 principles of green analytical chemistry, providing a score from 0-1 (with 1 being ideal) [6] [14].
Greenness Profile of the Greener RP-HPTLC Method
The greener RP-HPTLC method utilizing ethanol-water mobile phase demonstrated excellent environmental credentials based on multiple assessment tools [6] [7]:
Table 2: Greenness Assessment of the RP-HPTLC Method for Apremilast
| Assessment Tool | Score | Interpretation |
|---|---|---|
| Analytical Eco-Scale (AES) | 93 | Excellent green profile (closer to 100 indicates greener method) |
| ChlorTox | 0.66 g | Low environmental impact equivalent to 0.66g chlorinated solvents |
| AGREE | 0.89 | Excellent alignment with green analytical chemistry principles |
The method's exceptional green profile primarily stems from the use of ethanol-water as the mobile phase, which replaces more hazardous organic solvents typically used in chromatographic methods [6] [7] [14]. This aligns with the principles of green analytical chemistry, which advocate for replacing toxic solvents with safer alternatives, reducing waste generation, and minimizing energy consumption [14].
The Scientist's Toolkit: Essential Research Reagents and Materials
Table 3: Key Research Reagents and Materials for Apremilast Analysis
| Item | Function/Application | Specific Examples/Notes |
|---|---|---|
| Apremilast Reference Standard | Qualitative and quantitative analysis; method development and validation | High-purity material for preparing calibration standards [6] [23] |
| RP-18 HPTLC Plates | Stationary phase for reversed-phase separation | RP-18 silica gel 60 F254S plates; F254S indicates fluorescent indicator for UV detection at 254 nm [6] |
| Ethanol (Green Solvent) | Mobile phase component; extraction solvent | Replaces more hazardous solvents like methanol or acetonitrile; used in ethanol/water (65:35, v/v) ratio [6] [7] |
| Water (HPLC Grade) | Mobile phase component; solvent | Used in combination with ethanol in greener mobile phase [6] |
| Methanol, Acetonitrile | Mobile phase for HPLC methods | Used in conventional HPLC methods for impurity profiling [23] |
| Trifluoroacetic Acid | Mobile phase additive for HPLC | Used at 0.05% concentration in HPLC method for impurity profiling to improve peak shape [23] |
| Poly(lactic-co-glycolic acid) (PLGA) | Polymer for nanoparticle formulations | Used in preparation of apremilast-loaded nanoparticles for enhanced delivery [6] [7] |
Visualization of Research Gap and Methodological Relationships
Research Gap in Apremilast Analytical Methods
Workflow for Greener RP-HPTLC Method Development
Critical Analysis and Identification of Research Gaps
The comprehensive review of existing analytical methods for apremilast reveals several significant research gaps, particularly in the domain of green analytical chemistry:
Limited Green Method Development: While various analytical methods exist for apremilast quantification, the majority of conventional approaches utilize hazardous organic solvents such as acetonitrile, methanol, and chlorinated solvents [23]. These methods generate substantial waste and pose environmental and safety concerns. The recently developed greener RP-HPTLC method addresses this gap by implementing ethanol-water mobile phase, but this represents a relatively new direction in apremilast analysis that requires further exploration and optimization [6] [7].
Limited Applications in Novel Formulations: As apremilast faces challenges related to poor solubility, permeability, and bioavailability, research into novel drug delivery systems such as nanoparticles and nanoemulsions has increased [6] [7]. However, validated analytical methods specifically tailored for these innovative formulations remain limited. The greener RP-HPTLC method has been successfully applied to nanoformulations, demonstrating 101.60% and 99.37% recovery in NP formulation and nanoemulsion respectively, but more work is needed to establish comprehensive analytical protocols for these advanced delivery systems [6].
Incomplete Method Greenness Assessment: Although the greener RP-HPTLC method has been evaluated using multiple greenness assessment tools (AES, ChlorTox, AGREE), comprehensive lifecycle assessment of analytical methods for apremilast is still lacking [6]. Future research should incorporate more holistic environmental impact assessments that consider energy consumption, waste management, and overall environmental footprint across the entire method lifecycle.
Limited Methodologies for Biological Matrices: The available literature primarily focuses on pharmaceutical dosage forms, with limited validated methods for therapeutic drug monitoring in biological fluids [6] [25]. As apremilast gains wider clinical use, including potential applications for alcohol use disorder [25], there is a growing need for sensitive and selective methods for quantifying apremilast in plasma, blood, and other biological matrices.
The greener RP-HPTLC method with ethanol-water mobile phase represents a significant advancement in addressing these research gaps, particularly in aligning analytical practices with the principles of green chemistry while maintaining analytical performance comparable to conventional methods [6] [7] [14].
Step-by-Step Protocol: HPTLC Analysis of Apremilast in Tablets and Nanoformulations
The Scientist's Toolkit: Key Research Reagent Solutions
The successful development and application of a green Reverse-Phase High-Performance Thin-Layer Chromatography (RP-HPTLC) method for pharmaceutical analysis relies on a specific set of reagents and materials. The table below details the essential components used in the analysis of apremilast, serving as a reference for method replication and adaptation.
Table 1: Essential Reagents and Materials for Green RP-HPTLC Analysis
| Item | Function / Role | Specification / Notes |
|---|---|---|
| RP-18 Silica Gel 60 F₂₅₄S Plates [6] [12] | Stationary phase for chromatographic separation. | Glass-backed, 10 x 20 cm or 10 x 10 cm; 0.2 mm thickness. The F₂₅₄S indicator allows for UV visualization at 254 nm [26]. |
| Ethanol [6] [12] | Green organic modifier in the mobile phase. | Serves as a greener, less toxic alternative to traditional solvents like acetonitrile [27]. |
| Water [6] [12] | Aqueous component in the mobile phase. | Purified water (e.g., from a Milli-Q system) is recommended [28]. |
| Apremilast (APM) Reference Standard [12] | Primary standard for method development, calibration, and identification. | Used to prepare stock and working standard solutions for the calibration curve. |
| Commercial Tablet Formulations / Nanoformulations [6] | Target samples for pharmaceutical analysis. | The method is designed for quality control in marketed tablets and complex nanoformulations (e.g., nanoparticles, nanoemulsions). |
Instrumentation and Analytical Conditions
The RP-HPTLC method requires a specific instrument configuration to achieve high precision and accuracy. The following setup, as used in the analysis of apremilast, is detailed below [6] [12] [28].
Table 2: Instrumentation and Optimized Analytical Conditions for Apremilast
| Parameter | Description / Specification |
|---|---|
| HPTLC Instrument | CAMAG system (Muttenz, Switzerland) |
| Sample Applicator | Automatic TLC Sampler 4 (ATS4) or Linomat 5 with a 100 µL syringe [26] [28]. |
| Application Band Width | 6-8 mm [26] [28]. |
| Development Chamber | Automated Developing Chamber 2 (ADC2) with glass twin-trough chamber [26]. |
| Stationary Phase | RP-18 Silica Gel 60 F₂₅₄S HPTLC plates [6] [12]. |
| Mobile Phase | Ethanol/Water (65:35, v/v) [6] [12]. |
| Development Distance | 8 cm [28]. |
| Saturation Time | 25 minutes at room temperature [26]. |
| Detection | TLC Scanner 3 in reflectance-absorbance mode [26]. |
| Detection Wavelength | 238 nm for apremilast [6] [12]. |
| Scanner Slit Dimensions | 4 x 0.45 mm or 8 x 0.1 mm [26] [28]. |
| Scanning Speed | 20 mm/s [28]. |
| Data Acquisition Software | WinCATS Planar Chromatography Manager (version 1.4.3 or 3.15) [26] [28]. |
Experimental Protocol for Apremilast Analysis
Standard and Sample Preparation
- Standard Stock Solution (100 µg/mL): Accurately weigh 10 mg of pure apremilast reference standard and dissolve it in 100 mL of a mixture of ethanol and water (65:35, v/v) in a volumetric flask [28].
- Calibration Curve Working Solutions: Dilute the stock solution appropriately with the ethanol/water mobile phase to obtain a concentration series. For apremilast, a range of 100–700 ng/band has been established as linear [6] [12]. For example, apply 1 µL of a 0.1 mg/mL solution to achieve a 100 ng/band concentration.
- Sample Solution (Tablets):
- Weigh and finely powder not less than 20 tablets.
- Transfer an amount of powder equivalent to 10 mg of apremilast to a volumetric flask.
- Add about 70 mL of the ethanol/water (65:35, v/v) solvent, sonicate for 15 minutes with intermittent shaking, and dilute to volume with the same solvent.
- Filter the solution through a 0.45 µm membrane filter [28].
- Sample Solution (Nanoformulations): Dilute the prepared nanoparticle (NP) or nanoemulsion formulations with the ethanol/water solvent to a nominal concentration within the linear range of the calibration curve [6] [12].
Chromatographic Procedure
- Plate Pre-washing (Optional): Pre-wash the RP-18 F₂₅₄S plates with methanol and activate by drying in an oven at 60°C for 5 minutes before sample application to minimize background noise [26].
- Sample Application: Using an automated applicator, apply the standard and sample solutions as bands onto the HPTLC plate. The bands should be 8 mm wide, applied 10 mm from the bottom and 15 mm from the side of the plate, with a distance of at least 4 mm between bands [26].
- Chromatographic Development: Pour the mobile phase (ethanol/water, 65:35 v/v) into the development chamber and allow for a 25-minute vapor saturation period. Insert the prepared plate and develop linearly to a distance of 8 cm [28].
- Drying: After development, remove the plate and allow it to dry completely at room temperature in a fume hood.
- Detection and Quantification: Place the dried plate in the TLC scanner and scan at 238 nm in absorbance-reflection mode. The typical retardation factor (Rf) for apremilast under these conditions is 0.61 ± 0.01 [6] [12].
Method Validation
The developed method must be validated according to ICH Q2(R1) guidelines. Key parameters and typical results for apremilast are summarized below.
Table 3: Key Validation Parameters and Results for the Apremilast RP-HPTLC Method [6] [12]
| Validation Parameter | Result / Specification |
|---|---|
| Linearity Range | 100 - 700 ng/band |
| Retardation Factor (Rf) | 0.61 ± 0.01 |
| Accuracy (% Recovery) | 98.40 - 101.60% (across tablets and nanoformulations) |
| Precision (% RSD) | ≤ 2% (for both intra-day and inter-day precision) |
| Robustness | Deliberate small changes in mobile phase composition and development distance did not significantly affect results. |
| Limit of Detection (LOD) | In the low ng/band range (e.g., 3.32 ng/band for a similar drug, suvorexant) [28]. |
| Limit of Quantification (LOQ) | In the low ng/band range (e.g., 9.98 ng/band for a similar drug, suvorexant) [28]. |
Workflow and Greenness Assessment
The following diagram illustrates the integrated workflow for pharmaceutical analysis using a green RP-HPTLC method, from sample preparation to sustainability assessment.
Figure 1: Integrated workflow for green RP-HPTLC pharmaceutical analysis.
Greenness Assessment
The use of ethanol-water as a mobile phase significantly enhances the environmental friendliness of the analytical method. This green profile can be quantitatively assessed using multiple modern metrics [6] [12]:
- Analytical Eco-Scale (AES): A perfect green method scores 100. The apremilast method using ethanol/water scored 93, indicating an excellent green profile with minimal penalty points [6] [12].
- AGREE Metric: This tool uses a 0-1 scale, where 1 represents ideal greenness. The described method achieved a high score of 0.89 [6] [12].
- ChlorTox: This metric calculates the total mass of hazardous chlorinated solvents; the method resulted in only 0.66 g, confirming the avoidance of such toxins [6] [12].
The quantification of Apremilast (APM), an anti-inflammatory agent used for treating psoriatic arthritis and plaque psoriasis, in complex matrices such as nanoemulsions requires robust and reproducible sample preparation protocols [29]. This document provides detailed application notes and protocols for the preparation of standard and sample solutions of Apremilast, from bulk drug substance to formulated nanoemulsions and tablets, specifically within the context of a reversed-phase high-performance thin-layer chromatography (RP-HPTLC) method employing a greener ethanol-water mobile phase [6]. Proper sample preparation is a critical first step to ensure the accuracy, precision, and reliability of the subsequent chromatographic analysis.
Research Reagent Solutions and Essential Materials
The following table catalogues the key reagents, materials, and instrumentation essential for the sample preparation and analysis of Apremilast.
Table 1: Essential Research Reagents and Materials for Apremilast HPTLC Analysis
| Item | Function/Application | Exemplary Specifications/Notes |
|---|---|---|
| Apremilast Reference Standard | Primary standard for calibration curve; used to assess method accuracy via recovery studies [30]. | High-purity bulk drug substance. |
| Methanol | Solvent for dissolving bulk APM and for extracting APM from solid dosage forms and nanoformulations [31] [30]. | Analytical Reagent (AR) grade. |
| Ethanol | Greener organic modifier in the mobile phase for RP-HPTLC [6]. | AR grade. |
| Water | Second component of the greener mobile phase; also used for dilution and in forced degradation studies [6] [31]. | Deionized, HPTLC/MS grade. |
| Silica Gel 60 F254 RP-18 Plates | The stationary phase for reversed-phase HPTLC separation [6]. | Merck, 10 x 10 cm or 20 x 10 cm, aluminum-backed. |
| Volumetric Flasks | For precise preparation and dilution of standard and sample solutions [31] [30]. | Various capacities (e.g., 10 mL, 25 mL). |
| Ultrasonic Bath | To aid in the dissolution of the drug and the extraction from dosage forms [30]. | - |
| Microsyringe (e.g., Linomat Syringe) | For precise application of sample bands onto the HPTLC plate [30]. | Hamilton, 100 µL capacity. |
| HPTLC Instrumentation | Semi- or fully-automatic sample applicator, development chamber, TLC scanner, and documentation system [32] [30]. | e.g., CAMAG Linomat 5 or ATS 4, ADC 3, TLC Scanner 4. |
Standard Solution Preparation
A stable and accurately prepared standard stock solution is fundamental for generating a reliable calibration curve.
Protocol: Preparation of Apremilast Standard Stock Solution
- Weighing: Accurately weigh approximately 10 mg of pure Apremilast reference standard using an analytical balance [31].
- Transfer: Quantitatively transfer the powder to a 10 mL volumetric flask.
- Initial Dissolution: Add about 7-8 mL of methanol to the flask and swirl or sonicate until the drug is completely dissolved. An ultrasonic bath may be used for 5-10 minutes to ensure complete dissolution [30].
- Final Volume: Dilute the solution to the mark with methanol and mix thoroughly.
- Concentration: The resulting standard stock solution (Solution A) has a concentration of approximately 1000 µg/mL [31].
Protocol: Preparation of Apremilast Working Standard Solution
- Dilution: Pipette 1.0 mL of the standard stock solution (Solution A) into a 10 mL volumetric flask.
- Dilution to Mark: Dilute to the mark with methanol and mix well.
- Concentration: This primary working standard solution (Solution B) has a concentration of 100 µg/mL [31].
- Calibration Dilutions: For constructing a calibration curve in the range of 100-700 ng/band, further dilute Solution B appropriately with methanol. For example, aliquot 0.5 mL, 1.0 mL, 2.0 mL, 3.0 mL, and 3.5 mL of Solution B into a series of 5 mL volumetric flasks and dilute to the mark with methanol to obtain solutions of 10, 20, 40, 60, and 70 µg/mL, respectively [6]. Applying 10 µL of these solutions will deliver 100, 200, 400, 600, and 700 ng of APM per band.
Sample Preparation from Different Matrices
Sample preparation varies significantly based on the physical state and composition of the matrix. The following protocols are optimized for the specified formulations.
Protocol: Preparation from Bulk Drug Substance
The preparation of a sample from bulk APM directly assesses the purity of the drug substance.
- Weighing: Accurately weigh a quantity of bulk APM powder equivalent to about 10 mg.
- Dissolution: Transfer it to a 25 mL volumetric flask, add about 20 mL of methanol, and sonicate for 15 minutes to ensure complete dissolution.
- Final Volume: Dilute to the mark with methanol [30].
- Working Solution: A further dilution may be required to bring the concentration within the linear range of the calibration curve. For instance, dilute 3 mL of the above solution to 10 mL with methanol to achieve a final concentration suitable for application [30].
Protocol: Preparation from Tablet Dosage Form
This protocol is designed to extract APM from solid oral dosage forms, which include excipients.
- Powder Preparation: Take at least 20 tablets and accurately weigh them. Calculate the average weight. Crush the tablets into a homogeneous fine powder using a mortar and pestle [30].
- Weighing: Accurately weigh a portion of the powder equivalent to the average weight of one tablet (or equivalent to about 10 mg of APM).
- Transfer and Extract: Transfer the powder to a 25 mL volumetric flask. Add approximately 20 mL of methanol.
- Sonication: Sonicate the mixture for 15-20 minutes, occasionally shaking the flask to facilitate complete extraction of the active ingredient from the excipients [30].
- Filtration: Allow the solution to cool to room temperature. Dilute to the mark with methanol and mix. Filter the solution through a syringe filter (e.g., Whatman No. 42) to remove insoluble particulate matter [30].
- Dilution: Perform a subsequent dilution of the filtrate with methanol as needed to achieve a final concentration within the working range (e.g., 100 µg/mL) [31].
Protocol: Preparation from Nanoemulsions
The analysis of APM in nanoformulations, such as nanoemulsions or nanoparticles (NPs), is critical for formulation development and quality control.
- Weighing/Dispensing: Accurately weigh a quantity of the prepared APM-loaded nanoemulsion equivalent to about 10 mg of APM. For liquid nanoemulsions, a precise volume can be dispensed.
- Solubilization and Breaking: Transfer the sample to a 25 mL volumetric flask. Add 20-25 mL of methanol. The role of methanol is twofold: to dissolve the free drug and to "break" the nanoemulsion, causing the release of APM from the oil droplets or nanostructure into the continuous solvent phase.
- Sonication: Sonicate the mixture thoroughly for 15-30 minutes to ensure complete drug release and dissolution.
- Final Volume: Dilute the solution to the mark with methanol and mix well.
- Clarification: If any insoluble stabilizers or components remain, centrifuge the solution or pass it through a filter to obtain a clear supernatant/filtrate for analysis [6].
- Further Dilution: Dilute the clear solution with methanol as required to match the calibration curve concentrations. The amount of APM in the nanoemulsion can be found by comparing the sample response to the calibration curve, with reported recovery rates around 99.37% [6].
Forced Degradation Studies
Forced degradation (stress testing) is performed to establish the stability-indicating properties of the analytical method.
Stress a sample of APM (bulk or from formulation) under various conditions to generate degradation products. After stress, prepare the sample solution in methanol and analyze via HPTLC to demonstrate the separation of APM from its degradation products [31].
Table 2: Summary of Forced Degradation Conditions for Apremilast
| Stress Condition | Detailed Protocol | Sample Preparation Post-Stress | Observed Stability of Apremilast |
|---|---|---|---|
| Acidic Hydrolysis | Reflux with 0.1 M HCl at 60°C for 2 hours [31]. | Neutralize with 0.1 M NaOH, then dilute with methanol [31]. | Degrades under acid stress [31]. |
| Alkaline Hydrolysis | Treat with 0.05 M NaOH at room temperature for 15 minutes [31]. | Neutralize with 0.05 M HCl, then dilute with methanol [31]. | Degrades under alkaline stress [31]. |
| Oxidative Degradation | Reflux with 3% H2O2 at 80°C for 4 hours [31]. | Dilute directly with methanol [31]. | Degrades under oxidative stress [31]. |
| Thermal Degradation (Dry Heat) | Expose bulk drug to 110°C in an oven for 4 hours [31]. | Dissolve the stressed powder directly in methanol [31]. | Stable under dry heat [31]. |
| Photolytic Degradation | Expose solid drug to UV light (as per ICH Q1B) for 7 days [31]. | Dissolve the exposed powder directly in methanol [31]. | Stable under photolytic stress [31]. |
Integrated Experimental Workflow
The following diagram summarizes the logical flow of the standard and sample preparation protocols leading to HPTLC analysis.
Figure 1: Experimental workflow for sample preparation
The following table consolidates key quantitative data from the presented protocols and relevant literature for easy reference.
Table 3: Summary of Quantitative Data for Apremilast Analysis
| Parameter | Reported Value / Range | Notes / Context |
|---|---|---|
| Linear Range | 100 – 700 ng/band [6] | Calibration curve is established in this range. |
| Detection Wavelength (λmax) | 238 nm [6] | Used for densitometric scanning. |
| Typical Rf Value | 0.61 ± 0.01 [6] | In ethanol/water (65:35, v/v) mobile phase. |
| Recovery from Tablets | ~98.40% [6] | Indicates accuracy of the method for tablets. |
| Recovery from Nanoemulsion | ~99.37% [6] | Indicates accuracy for nanoformulations. |
| Recovery from NP Formulation | ~101.60% [6] | Indicates accuracy for nanoparticle formulations. |
| Standard Stock Solution | 1000 µg/mL [31] | In methanol. |
| Forced Degradation (Acid) | 2 hours at 60°C in 0.1M HCl [31] | Leads to degradation. |
| Forced Degradation (Oxidation) | 4 hours at 80°C in 3% H₂O₂ [31] | Leads to degradation. |
This application note details the development and validation of a green, reversed-phase High-Performance Thin-Layer Chromatography (RP-HPTLC) method for the quantification of Apremilast (APM) in pharmaceutical products. The method utilizes an ethanol-water mobile phase, aligning with the principles of Green Analytical Chemistry (GAC) by replacing hazardous solvents. The optimized conditions provide a rapid, simple, economical, and environmentally friendly alternative for routine analysis of Apremilast in marketed tablets and novel nanoformulations, without compromising analytical performance [6].
The substantially operated analytical methods in pharmaceutical analysis often rely on traditional solvents that can be harmful to the environment. These methods generate significant waste and use considerable energy [14]. There is a growing impetus within the scientific community to adopt eco-friendly solvents, such as ethanol or water, to mitigate these environmental impacts [14]. The method described herein was developed in this context, establishing a greener HPTLC technique for Apremilast, which was previously unavailable in the literature [6]. The method's greenness has been rigorously assessed and confirmed using multiple specialized tools, making it a superior choice for sustainable pharmaceutical analysis.
Optimized Chromatographic Conditions and Parameters
The following section outlines the specific, optimized parameters for the RP-HPTLC method.
Key Method Parameters
All parameters were optimized to ensure robustness, accuracy, and precision for the analysis of Apremilast.
Table 1: Optimized Chromatographic Conditions for Apremilast (APM) Analysis
| Parameter | Specification |
|---|---|
| Stationary Phase | RP-18 silica gel 60 F254S HPTLC plates [6] |
| Mobile Phase | Ethanol/Water (65:35, v/v) [6] |
| Detection Wavelength (λmax) | 238 nm [6] |
| Retention Factor (Rf) | 0.61 ± 0.01 [6] |
| Linear Range | 100–700 ng/band [6] |
| Application | Analysis of APM in marketed tablets, NP formulations, and nanoemulsion [6] |
Mobile Phase Preparation Protocol
The preparation of the mobile phase is critical for reproducibility. The following protocol is recommended.
Protocol 1: Preparation of Ethanol/Water (65:35, v/v) Mobile Phase
- Objective: To prepare 1 L of the mobile phase with high reproducibility.
- Principle: While solvent mixtures are often prepared by mixing volumes, the total volume of a mixture can differ from the sum of its parts (e.g., 50 mL water + 50 mL ethanol yields ~96 mL at room temperature). The procedure below using a volumetric flask ensures the final correct volume and concentration [33].
- Materials: Absolute ethanol (HPLC grade), purified water, 1 L volumetric flask, graduated cylinder, and stirring rod.
- Procedure:
- Measure Ethanol: Pour approximately 500 mL of water into the 1 L volumetric flask.
- Add Water: Add 650 mL of absolute ethanol to the flask using a graduated cylinder.
- Dilute to Volume: Carefully add water to the volumetric flask until the bottom of the meniscus reaches the 1 L mark.
- Mix Thoroughly: Cap the flask and invert it several times to ensure homogeneous mixing.
- Equilibrate Temperature: Allow the solution to stand until it returns to room temperature, as mixing can cause temperature changes that affect volume [33].
Method Validation Data
The developed method was validated as per International Council for Harmonisation (ICH) guidelines. The results confirm that the method is suitable for its intended use.
Table 2: Summary of Method Validation Parameters
| Validation Parameter | Result |
|---|---|
| Assay (Marketed Tablets) | 98.40% [6] |
| Assay (NP Formulation) | 101.60% [6] |
| Assay (Nanoemulsion) | 99.37% [6] |
| Greenness (Analytical Eco-Scale) | 93 (Excellent) [6] |
| Greenness (ChlorTox) | 0.66 g [6] |
| Greenness (AGREE) | 0.89 (Excellent) [6] |
Experimental Workflow
The entire process, from sample preparation to final analysis, can be visualized in the following workflow.
The Scientist's Toolkit: Essential Research Reagents and Materials
This section lists the key materials and instruments required to successfully implement this analytical method.
Table 3: Essential Reagents and Equipment for the RP-HPTLC Method
| Item | Function / Role in the Method |
|---|---|
| RP-18 silica gel 60 F254S HPTLC Plates | The stationary phase for reversed-phase separation of Apremilast from other components [6]. |
| Absolute Ethanol (HPLC Grade) | The organic modifier in the green mobile phase; serves as the strong solvent [6]. |
| HPTLC Densitometer Scanner | Instrument used to detect and quantify the bands on the HPTLC plate by measuring absorbance at 238 nm [6]. |
| Apremilast Reference Standard | High-purity substance used to prepare calibration standards for identifying and quantifying the analyte [6]. |
| Micro-syringe or Automatic Applicator | Precise application of sample and standard bands onto the HPTLC plate [6]. |
| Twin-Trough Glass Chamber | A sealed chamber for the development of the HPTLC plate in a saturated mobile phase atmosphere [6]. |
| Ultrasonic Bath | Used to aid in the dissolution and homogenization of samples and standards. |
Comparative Analysis with Alternative Methods
The green RP-HPTLC method presents a strong ecological and practical profile compared to other common techniques used for Apremilast analysis. For instance, a previously published RP-HPLC method for Apremilast utilized a mobile phase containing acetonitrile and a potassium dihydrogen orthophosphate buffer (pH-3.2) in a 60:40 ratio [34]. While effective, acetonitrile is more toxic and environmentally damaging than ethanol. Furthermore, the use of a buffer necessitates additional preparation steps and generates non-volatile waste, which is not MS-compatible and poses greater disposal challenges [35]. The described RP-HPTLC method eliminates the need for such additives, using only ethanol and water, which significantly reduces its environmental footprint as evidenced by its high AGREE and Analytical Eco-Scale scores [6].
In the development of a High-Performance Thin-Layer Chromatography (HPTLC) method for apremilast utilizing an ethanol-water mobile phase, the accurate determination of retardation factor (Rf) values and the strategic selection of the detection wavelength are critical pillars for ensuring the method's specificity, sensitivity, and reliability. Rf values serve as the primary identifier for compounds in a complex mixture, while the detection wavelength directly influences the accuracy and limit of quantification. This application note details standardized protocols and decision-making frameworks for these two fundamental parameters, providing a structured approach for researchers and drug development professionals engaged in pharmaceutical analysis. The focus on the ethanol-water system aligns with the growing demand for greener and more sustainable analytical techniques in modern laboratories [36].
Theoretical Foundations
The Retardation Factor (Rf) in HPTLC
The retardation factor (Rf) is a dimensionless constant that characterizes the migration of an analyte relative to the solvent front in a chromatographic system. It is calculated using the formula: Rf = Distance traveled by the analyte / Distance traveled by the solvent front
The value is influenced by a triad of factors: the chemical nature of the stationary phase, the composition and polarity of the mobile phase, and the intrinsic properties of the analyte itself, such as its polarity, size, and interaction capabilities [37]. In the context of an ethanol-water mobile phase, the relative proportions of these solvents will be a primary driver of the Rf value for apremilast, as they control the overall polarity of the system. A well-optimized method aims for an Rf value between 0.2 and 0.8 to ensure clear separation from the baseline and other components [38].
Principles of Wavelength Selection
Detection in HPTLC often relies on ultraviolet (UV) absorption. Selecting the optimal wavelength is paramount for achieving high sensitivity and a stable baseline. The process involves:
- Ultraviolet Spectrum Profiling: Analyzing the standard solution across a range of UV wavelengths (e.g., 200-400 nm) to identify the absorption maxima (λmax) of the target analyte(s).
- Signal-to-Noise Optimization: The chosen wavelength should maximize the analyte's signal while minimizing interference from the stationary phase background or formulation excipients.
- Specificity Verification: Confirming that at the selected wavelength, the band for the analyte of interest is pure and does not co-elute with any other substance [38] [39].
Experimental Protocols
Protocol for Determining Rf Values
This protocol outlines the steps to develop and optimize the chromatographic conditions for apremilast.
Materials
- HPTLC Plates: Silica gel 60 F254, 10 x 20 cm (e.g., Merck KGaA) [39] [36]
- Mobile Phase: Ethanol-water mixtures (e.g., 70:30, v/v) [36]. Note: Other ratios, such as 50:50 v/v, have also been reported as effective for extracting a wide range of compounds from complex matrices and can be investigated during optimization [40].
- Application Device: Semi-automated applicator (e.g., CAMAG Linomat 5) [39] [36]
- Development Chamber: Automated Developing Chamber (ADC) [39]
- Detection System: TLC Visualizer or Densitometer with UV capability [39]
Procedure
- Standard Solution Preparation: Prepare a standard solution of apremilast in a suitable solvent (e.g., ethanol or methanol) at a concentration of approximately 1 mg/mL [39].
- Sample Application: Using the semi-automated applicator, apply bands of the standard solution (e.g., 4-8 μL) onto the HPTLC plate, 8 mm from the bottom and 13 mm from the side edges [36].
- Chromatographic Development: Pour 10 mL of the ethanol-water mobile phase into the development chamber. Allow for saturation if required by the method. Develop the plate to a distance of 60-70 mm from the point of application [39] [36].
- Plate Drying: Air-dry the developed plate in a fume hood for 5-10 minutes to completely evaporate the mobile phase.
- Visualization and Documentation: Place the plate under the TLC Visualizer and capture the image under UV light at 254 nm or 366 nm.
- Rf Calculation: Using the HPTLC software (e.g., visionCATS), measure the distance from the application point to the center of the apremilast band and to the solvent front. Calculate the Rf value.
Protocol for Wavelength Selection and Optimization
This protocol guides the selection of the most appropriate wavelength for densitometric analysis.
Materials
- Developed and dried HPTLC plate from Protocol 3.1.
- TLC Densitometer with spectrum scanning capability (e.g., CAMAG TLC Scanner 4).
Procedure
- Spectral Scanning: Place the developed plate in the densitometer. Perform a spectrum scan of the apremilast standard band across a wavelength range of 200-400 nm.
- Identify Absorption Maxima: From the resulting spectrum, identify the wavelength(s) at which apremilast shows maximum absorption (λmax).
- Background Scan: Also, scan a clean area of the stationary phase (a blank) at the same Rf value to assess background noise and interference.
- Wavelength Selection: Compare the spectra of the standard and the blank. Choose the wavelength that offers the strongest absorption for the analyte with the least background interference. This is often, but not always, the λmax.
- Method Validation: Use the selected wavelength for subsequent densitometric scanning and quantification, confirming its suitability during method validation as per ICH guidelines [41] [39].
Data Presentation and Analysis
Quantitative Data on Rf and Wavelength
The following table summarizes data from published HPTLC methods for pharmaceuticals, illustrating typical Rf values and the wavelengths used for detection.
Table 1: Representative Rf Values and Detection Wavelengths from HPTLC Methods
| Analyte(s) | Mobile Phase Composition | Stationary Phase | Rf Value(s) | Detection Wavelength (nm) | Citation |
|---|---|---|---|---|---|
| Meloxicam & Piroxicam | Hexane:Ethyl Acetate:Glacial Acetic Acid (65:30:5 v/v/v) | Silica Gel 60 F254 | 0.81 (Meloxicam), 0.57 (Piroxicam) | 366 | [39] |
| Hydroxyzine HCl, Ephedrine HCl, Theophylline | Chloroform–Ammonium Acetate Buffer pH 6.5 (9.5:0.5 v/v) | Silica Gel 60 F254 | 0.15 (EPH), 0.40 (THP), 0.65 (HYX) | 220 | [38] |
| Five Water-Soluble Vitamins | Ethanol-Water (70:30, v/v) | Silica Gel 60 F254 | Method Reported | Variable (UV) | [36] |
Note: The Rf values are specific to the stated chromatographic conditions and cannot be directly extrapolated.
The Scientist's Toolkit: Essential Research Reagents and Materials
Table 2: Key Materials and Equipment for HPTLC Method Development
| Item | Specification / Example | Primary Function |
|---|---|---|
| HPTLC Plates | Silica gel 60 F254 on glass support, 200 μm layer thickness | The stationary phase for chromatographic separation. F254 indicates a fluorescent indicator for UV detection at 254 nm. |
| Mobile Phase Solvents | Absolute Ethanol, Deionized Water | The liquid phase that carries the analytes through the stationary phase. The ratio determines separation efficiency. |
| Standard | Apremilast Reference Standard (e.g., from Sigma-Aldrich) | Used for identification (Rf value) and quantification (calibration curve) of the target analyte. |
| Application Device | CAMAG Linomat 5 (semi-automatic) | Precisely applies samples as narrow bands onto the HPTLC plate, improving reproducibility. |
| Development Chamber | CAMAG Automatic Developing Chamber (ADC 2) | Provides a controlled, saturated environment for the reproducible development of the TLC plate. |
| Densitometer / Scanner | CAMAG TLC Scanner 4 | Quantifies the intensity of the analyte bands by scanning at a specific wavelength. |
| Documentation System | CAMAG TLC Visualizer 2 | Captures digital images of the developed HPTLC plate under white light and UV (254/366 nm). |
Visualization of Workflows
The following diagrams illustrate the logical workflows for method development and wavelength selection.
HPTLC Method Dev. Workflow
Wavelength Selection Process
High-Performance Thin-Layer Chromatography (HPTLC) is a sophisticated, automated form of thin-layer chromatography that provides enhanced resolution, reproducibility, and quantitative analysis capabilities for complex mixtures [42]. This technique is particularly valuable in pharmaceutical analysis for its ability to handle multiple samples simultaneously, reducing both analysis time and solvent consumption compared to methods like HPLC [43]. The application of HPTLC for the assay of pharmaceutical compounds in both commercial dosage forms and novel drug delivery systems represents a significant advancement in analytical methodology.
Within the broader context of research on HPTLC method development for apremilast using ethanol-water mobile phase, this application note demonstrates the practical implementation of a greener analytical approach. Apremilast, an important pharmaceutical agent, requires robust and environmentally conscious quantification methods for quality control in marketed tablets and emerging nanoformulations [6]. The methodology outlined herein utilizes a reversed-phase HPTLC system with an ethanol-water mobile phase, aligning with the principles of Green Analytical Chemistry (GAC) by replacing hazardous solvents with more environmentally friendly alternatives [14].
Key Research Reagent Solutions and Materials
The successful implementation of the HPTLC method for apremilast quantification requires specific reagents and materials. The table below summarizes the essential components and their functions in the analytical procedure.
Table 1: Essential Research Reagents and Materials for Apremilast HPTLC Analysis
| Item Name | Function/Application in the Assay |
|---|---|
| RP-18 silica gel 60 F₂₅₄S HPTLC plates | Stationary phase for reversed-phase chromatographic separation |
| Ethanol/Water (65:35, v/v) | Greener mobile phase for compound elution |
| Pure Apremilast Reference Standard | Qualification and quantification reference material |
| Apremilast Tablets | Commercial pharmaceutical product for analysis |
| Apremilast Nanoformulations | Laboratory-generated nanoparticles and nanoemulsion |
| Derivatization Reagent (if required) | For compound visualization (specific reagent depends on method) |
| Syringe Filters (0.45 μm) | Sample filtration prior to application on HPTLC plates [43] |
Summarized Quantitative Data
The developed HPTLC method for apremilast was rigorously validated according to standard analytical procedures. The following table summarizes the key quantitative performance data and assay results for the analyzed formulations.
Table 2: Quantitative Method Performance Data and Assay Results for Apremilast
| Parameter | Result/Value |
|---|---|
| Linear Range | 100–700 ng/band [6] |
| Detection Wavelength (λₘₐₓ) | 238 nm [6] |
| Retardation Factor (Rf) | 0.61 ± 0.01 [6] |
| Assay Result (Marketed Tablets) | 98.40% [6] |
| Assay Result (NP Formulation) | 101.60% [6] |
| Assay Result (Nanoemulsion) | 99.37% [6] |
| Greenness Score (AGREE) | 0.89 [6] |
| Greenness Score (Analytical Eco-Scale) | 93 [6] |
Experimental Protocols
Instrumentation and Software Configuration
HPTLC analysis is performed using an integrated system. Key instruments typically include an Auto-Sampler (e.g., ATS 4 or Linomat 5) for precise sample application, an Automatic Developing Chamber (ADC 2) for reproducible plate development, a Chromatogram Immersion Device for uniform derivatization, and a TLC Scanner for densitometric quantification [43]. The entire system is controlled by dedicated software such as visionCATS, which guides the user through the analytical workflow, manages data, and supports compliance with good manufacturing practice (GMP) guidelines [44]. The software should be configured to default pharmacopoeial standards (e.g., USP ‹203› or Ph. Eur. 2.8.25) for standardized procedures [44].
Sample Preparation Procedures
Standard Solution Preparation: Accurately weigh approximately 10 mg of pure apremilast reference standard and transfer it to a 10 mL volumetric flask. Dissolve and make up to volume with ethanol to obtain a primary stock solution of 1000 µg/mL. Serially dilute this solution with ethanol to prepare working standards in the concentration range of 100–700 ng/band.
Tablet Sample Preparation: Weigh and finely powder not less than 20 tablets. Transfer an amount of powder equivalent to about 10 mg of apremilast to a 10 mL volumetric flask. Add about 7 mL of ethanol, sonicate for 10-15 minutes with intermittent shaking, and dilute to volume with ethanol. Filter the solution through a 0.45 µm syringe filter [43]. Further dilute if necessary to bring the concentration within the linear range.
Nanoformulation Preparation: For laboratory-generated nanoparticles (NPs) and nanoemulsions, accurately measure a volume or weight equivalent to 10 mg of apremilast. Transfer to a 10 mL volumetric flask, disperse in ethanol, and sonicate to extract the drug. Dilute to volume with ethanol and filter through a 0.45 µm syringe filter. Make appropriate dilutions to achieve the required analytical concentration.
Chromatographic Procedure and Analysis
- Plate Pre-washing (Optional): Pre-wash the RP-18 HPTLC plates with methanol and dry in an oven to remove any impurities [42].
- Sample Application: Using the auto-sampler, apply the standard and sample solutions as bands (e.g., 6 mm wide) on the pre-washed RP-18 HPTLC plate. The application volume should be specified in the software method to deliver 100-700 ng of apremilast per band [44].
- Plate Development: Develop the applied plate in a twin-trough glass chamber or Automatic Developing Chamber (ADC) pre-saturated for 20-30 minutes with the mobile phase (ethanol/water, 65:35 v/v) [43] [42]. The development distance is typically 70-80 mm from the point of application.
- Drying and Documentation: After development, dry the plate completely in a fume hood. Capture an image of the developed plate under UV light at 238 nm using a documentation system.
- Derivatization (If Required): If needed for enhanced detection, derivatize the plate by uniformly immersing it in or spraying it with an appropriate reagent using a Chromatogram Immersion Device or Derivatizer [43] [44].
- Scanning and Quantification: Scan the developed and dried plate using a TLC Scanner in the densitometric mode at 238 nm [6]. Generate a calibration curve by plotting the peak area against the concentration of the apremilast standard. Quantify the amount of apremilast in tablet and nanoformulation samples by comparing their peak areas with the calibration curve.
System Suitability Testing
A System Suitability Test (SST) should be performed to ensure the analytical system is working correctly. This is typically based on the Rf value of a marker compound. The test is passed when the detected peaks are positioned within the predefined range established during method development [44]. For the apremilast method, the standard band should display a sharp peak at Rf = 0.61 ± 0.01 [6].
Workflow and Signaling Pathways
The following diagram illustrates the complete experimental workflow for the HPTLC analysis of apremilast in tablets and nanoformulations, from sample preparation to final quantification.
Diagram 1: HPTLC Analysis Workflow
The detailed application notes and protocols presented herein demonstrate the successful development and implementation of a greener RP-HPTLC-densitometry method for the quantification of apremilast in both marketed tablets and advanced laboratory-generated nanoformulations. The method, which utilizes an ethanol-water mobile phase, aligns with the principles of Green Analytical Chemistry. It has been validated to be linear over the range of 100-700 ng/band, precise, accurate, and specific, with excellent greenness metrics (Analytical Eco-Scale score of 93 and AGREE score of 0.89) [6]. This robust methodology provides a reliable, eco-friendly, and efficient solution for the routine quality control and analysis of apremilast in various pharmaceutical forms, supporting ongoing research and development in pharmaceutical sciences.
AQbD and Risk Management: Optimizing Robustness and Resolving Common Issues
Implementing Analytical Quality by Design (AQbD) in Method Development
Analytical Quality by Design (AQbD) is a systematic, risk-based approach to analytical method development that begins with predefined objectives and emphasizes method understanding and process control. As defined by the International Council for Harmonisation (ICH), AQbD is "a systematic approach to development that begins with predefined objectives and emphasizes product and process understanding and process control, based on sound science and quality risk management" [45]. This methodology ensures that quality is built into the analytical method rather than merely tested, resulting in robust, reproducible, and fit-for-purpose methods that consistently deliver the intended performance throughout their lifecycle.
The application of AQbD is particularly valuable in pharmaceutical analysis, where method robustness and reliability are critical for quality control. For the development of a High-Performance Thin-Layer Chromatography (HPTLC) method for apremilast using an ethanol-water mobile phase, the AQbD approach provides a structured framework to identify, evaluate, and control critical method parameters, ultimately ensuring accurate and reliable quantification in pharmaceutical products and nanoformulations [6] [31].
AQbD Principles and Framework
Core Components of AQbD
The AQbD framework comprises several key elements that guide the method development process from conception to implementation. These components create a comprehensive system for developing well-understood analytical methods.
Analytical Target Profile (ATP): The ATP defines the intended purpose of the analytical method by specifying the required quality attributes. For the apremilast HPTLC method, the ATP includes reliable quantification of the drug in pharmaceutical dosage forms and nanoformulations with specific accuracy, precision, and sensitivity requirements [45].
Critical Quality Attributes (CQAs): CQAs are the method performance characteristics that must be controlled to ensure the method meets the ATP. In chromatographic method development, typical CQAs include resolution, peak purity, tailing factor, and retention factor [31].
Risk Assessment: Systematic risk assessment tools, including Ishikawa diagrams and Failure Mode and Effects Analysis (FMEA), are employed to identify and prioritize method parameters that may impact CQAs. This risk-based approach focuses development efforts on the most critical factors [31] [45].
Method Operable Design Space (MODS): The MODS is the multidimensional combination and interaction of critical method parameters that have been demonstrated to provide assurance of quality. Operating within the MODS ensures method robustness, while changes within this space do not require revalidation [31].
Control Strategy: A control strategy defines the procedures for monitoring the method performance to ensure it remains within the MODS during routine use. This includes system suitability tests and control samples [31].
Implementation Workflow
The implementation of AQbD follows a logical sequence that transforms method development from an empirical exercise to a science-based systematic process. The workflow begins with defining the ATP based on the analytical needs, followed by identifying potential CQAs through prior knowledge and preliminary experiments. Risk assessment tools then help identify critical method parameters that significantly affect CQAs. Through structured design of experiments (DoE), the relationship between critical parameters and CQAs is modeled to establish the MODS. Finally, a control strategy is implemented to ensure the method remains in a state of control during routine operation [31] [45].
Application to HPTLC Method Development for Apremilast
Compound Background and Analytical Challenges
Apremilast (APM) is an oral small-molecule inhibitor of phosphodiesterase 4 (PDE4) used for the treatment of psoriatic arthritis and plaque psoriasis [46]. The chemical structure of apremilast, specifically N-(2-((1S)-1-(3-ethoxy-4-methoxyphenyl)-2-methylsulfonylethyl)-1,3-dioxoisoindol-4-yl)acetamide, presents specific analytical challenges that make AQbD particularly valuable for method development [46].
The molecule contains multiple functional groups and chiral centers, requiring selective analytical methods that can separate it from potential impurities and degradation products. Stress studies have revealed that apremilast undergoes degradation under various conditions, generating multiple degradation products that must be separated from the parent compound for accurate quantification [31] [46]. These factors necessitate a robust analytical method that can consistently provide reliable results despite variations in experimental conditions.
Green Analytical Chemistry Considerations
The development of a greener HPTLC method for apremilast using ethanol-water mobile phase aligns with the principles of Green Analytical Chemistry (GAC). Traditional chromatographic methods often employ hazardous organic solvents that generate significant waste, with conventional HPLC methods typically producing 1-1.5 L of waste per day [14].
The selection of ethanol as the organic modifier in the mobile phase represents a conscious green choice because ethanol is less toxic and more environmentally friendly than solvents such as methanol or acetonitrile [6] [14]. The simple ethanol-water mobile phase system (65:35, v/v) has demonstrated excellent performance for apremilast quantification while minimizing environmental impact [6]. The greenness of this method has been quantitatively assessed using multiple metrics, including Analytical Eco-Scale (AES), ChlorTox, and Analytical GREENness (AGREE) approaches, with scores of 93, 0.66 g, and 0.89 respectively, confirming its outstanding environmental profile [6].
Experimental Protocols
Materials and Reagents
The successful implementation of the AQbD-based HPTLC method requires careful selection of materials and reagents. The following table provides a comprehensive list of essential research reagents and their specific functions in the method development process.
Table 1: Essential Research Reagent Solutions for AQbD-Based HPTLC Method Development
| Reagent/Material | Specification | Function/Purpose | Green Considerations |
|---|---|---|---|
| Apremilast Reference Standard | Pharmaceutical secondary standard | Method development and calibration | High purity minimizes waste |
| Ethanol | HPLC grade | Green organic modifier in mobile phase | Low toxicity, biodegradable |
| Water | HPLC grade | Aqueous component of mobile phase | Environmentally benign |
| RP-18 Silica Gel 60 F254S HPTLC Plates | 10 × 10 cm or 20 × 10 cm | Stationary phase for reversed-phase separation | Reusable scanning reduces waste |
| Formic Acid | Analytical grade | pH adjustment in mobile phase (if required) | Minimal usage recommended |
| Methanol | HPLC grade | For standard and sample preparation | Use minimized per green principles |
| Hydrogen Peroxide | 3% solution | For oxidative degradation studies | - |
| Hydrochloric Acid | 0.1 M solution | For acid degradation studies | - |
| Sodium Hydroxide | 0.05 M solution | For alkaline degradation studies | - |
Instrumentation and Equipment
The HPTLC system configuration requires specific instruments to achieve automated, precise, and reproducible analysis. A typical system includes a Linomat V semiautomatic sample applicator equipped with a 100-μL Hamilton syringe for precise bandwise sample application, a twin-trough developing chamber (10 × 10 cm) for chromatographic separation, a TLC Scanner IV for densitometric analysis, and winCATS software for data acquisition and processing [31]. Additional equipment includes a UV cabinet with dual wavelength lamps for visual detection of bands and an electronic analytical balance (e.g., Shimadzu AUX-220) for accurate weighing of standards and samples [31].
Detailed Methodology for AQbD Implementation
Step 1: Defining the Analytical Target Profile (ATP)
The ATP for the apremilast HPTLC method should explicitly define the method requirements: "To quantify apremilast in pharmaceutical dosage forms and nanoformulations over a concentration range of 100-700 ng/band with accuracy of 98-102%, precision (RSD) less than 2%, and capability to separate apremilast from its degradation products (Rf = 0.61 ± 0.01) using a green ethanol-water mobile phase" [6] [31].
Step 2: Identifying Critical Quality Attributes (CQAs)
The CQAs for the HPTLC method include resolution between apremilast and nearest degradation product (should be >1.5), retardation factor (Rf value of 0.61 ± 0.01 for apremilast), peak purity (≥0.999), tailing factor (≤1.5), and calibration curve linearity (r² ≥ 0.999) [31]. These attributes collectively ensure that the method is specific, accurate, and precise for its intended purpose.
Step 3: Risk Assessment and Failure Mode Analysis
The risk assessment process begins with identifying potential failure modes using an Ishikawa diagram, categorizing them into factors related to mobile phase, stationary phase, sample application, development conditions, and detection parameters [31]. Each failure mode is then evaluated using Failure Mode and Effects Analysis (FMEA) with Risk Priority Numbers (RPN) calculated based on severity, occurrence, and detectability scores (each rated 2-10) [31]. Failure modes with high RPN scores (typically >100) are considered critical and selected for further investigation through experimental design.
Table 2: Risk Assessment and Control Strategy for Critical Method Parameters
| Critical Parameter | Risk Potential | Control Strategy | Acceptable Range |
|---|---|---|---|
| Volume of Methanol (in standard preparation) | High impact on resolution | DoE optimization and control in MODS | 1.0-2.0 mL [31] |
| Saturation Time | Affects reproducibility and Rf | Fixed within MODS with monitoring | 15-25 minutes [31] |
| Migration Distance | Impacts separation efficiency | Controlled through development conditions | 70-80 mm [31] |
| Mobile Phase Composition | Critical for selectivity | Standardized with qualification | Ethanol:Water (65:35, v/v) [6] |
| Detection Wavelength | Affects sensitivity and linearity | Verified during system suitability | 238 nm [6] |
Step 4: Screening Studies Using Taguchi Orthogonal Array Design
Screening experiments are conducted using Taguchi Orthogonal Array design to evaluate the main effects of multiple factors efficiently. The experimental design typically includes 7 method variables (e.g., volume of methanol, volume of mobile phase, migration distance, saturation time, band width, detection wavelength, and scanning speed) at two levels each, requiring 8 experimental runs performed in triplicate [31]. Responses (resolution values) are recorded for each experimental run and analyzed using ANOVA to identify factors with statistically significant effects (p < 0.05) on the CQAs [31].
Step 5: Response Surface Modeling with Box-Behnken Design
For in-depth optimization, a Box-Behnken design is employed to model the relationship between critical method variables and responses. This design typically investigates 3 critical factors (e.g., volume of methanol, saturation time, and migration distance) at 3 levels each, requiring 17 experimental runs [31]. Response surface methodology is applied to generate mathematical models and contour plots that visualize the relationship between factors and responses, enabling the identification of the Method Operable Design Space (MODS) where the method consistently meets all CQA requirements [31].
Method Validation Protocol
Following AQbD-based development, the method must be validated according to ICH Q2(R1) guidelines. The validation protocol includes the following experiments:
Linearity: Prepare standard solutions in the range of 50-150% of target concentration (100-700 ng/band for apremilast). Apply each concentration in triplicate, plot peak area versus concentration, and calculate correlation coefficient (r² ≥ 0.999) and regression equation [6] [31].
Precision: Conduct repeatability (intra-day precision) by analyzing six sample preparations at 100% concentration and intermediate precision (inter-day precision) by repeating the analysis on different days. Calculate %RSD for peak areas (acceptance criteria: %RSD ≤ 2.0%) [31].
Accuracy (Recovery Studies): Perform standard addition at three concentration levels (80%, 100%, 120%) in triplicate. Calculate percentage recovery for each level (acceptance criteria: 98-102%) [6] [31].
Specificity: Verify specificity by comparing chromatograms of standard apremilast, sample solutions, and forced degradation samples. Confirm that the apremilast band is pure and well-separated from degradation products [31].
Robustness: Deliberately introduce small variations in critical method parameters (mobile phase composition ±2%, saturation time ±5 minutes, development distance ±5 mm) and evaluate system suitability parameters. The method should remain unaffected by these variations [6] [31].
Case Study: AQbD for Apremilast HPTLC Method
Application of the AQbD Framework
In a practical implementation of AQbD for apremilast HPTLC method development, researchers followed the systematic approach outlined in this protocol [31]. The initial risk assessment identified seven high-risk failure modes that were further investigated through screening designs. The critical method variables identified were volume of methanol, saturation time, and migration distance, while the critical method attribute was resolution between apremilast and its acid degradation product [31].
Through Box-Behnken design and response surface methodology, the relationship between these critical parameters was modeled, and the Method Operable Design Space was established. The optimal conditions were determined as ethanol-water (65:35, v/v) mobile phase, 20 minutes saturation time, and 75 mm migration distance, resulting in compact apremilast bands at Rf = 0.61 ± 0.01 with excellent resolution from degradation products [6] [31].
Method Performance and Applications
The developed AQbD-based HPTLC method demonstrated excellent performance characteristics. The method showed linearity in the range of 100-700 ng/band with a correlation coefficient of 0.9999 [6]. The precision was confirmed with %RSD values less than 2% for both repeatability and intermediate precision [31]. The method successfully applied to the quantification of apremilast in tablet dosage forms, nanoparticle formulations, and nanoemulsions with percentage recoveries of 98.40%, 101.60%, and 99.37% respectively [6].
The method also proved to be stability-indicating, successfully separating apremilast from its degradation products formed under various stress conditions including acid, base, oxidative, thermal, and photolytic degradation [31]. This capability is crucial for assessing drug product stability and shelf-life.
Troubleshooting and Optimization Guidelines
During method development, several challenges may arise that require troubleshooting. If peak tailing is observed, consider adjusting the mobile phase pH with minimal formic acid (if necessary) or ensuring proper plate activation. If resolution is inadequate, optimize the ethanol-water ratio between 60:40 to 70:30 or adjust the saturation time between 15-25 minutes [6] [31]. For inconsistent Rf values, ensure complete chamber saturation and consistent temperature control. If spot diffusion occurs, reduce the sample application volume or use smaller band lengths (4-6 mm) [31].
The relationship between method parameters and outcomes can be visualized through the following optimization pathway:
The implementation of Analytical Quality by Design in HPTLC method development for apremilast represents a paradigm shift from traditional, empirical approaches to a systematic, science-based methodology. By defining the Analytical Target Profile, identifying Critical Quality Attributes, conducting risk assessments, and establishing a Method Operable Design Space through structured experimental designs, the AQbD approach delivers robust, reproducible, and fit-for-purpose analytical methods.
The case study of apremilast HPTLC method development demonstrates how AQbD principles can be successfully applied to create a green analytical method using ethanol-water mobile phase that not only meets all analytical requirements but also minimizes environmental impact. The resulting method shows excellent performance for quantifying apremilast in pharmaceutical dosage forms and nanoformulations, with the added benefit of being stability-indicating.
This protocol provides researchers, scientists, and drug development professionals with a comprehensive framework for implementing AQbD in their analytical method development activities, ultimately enhancing method reliability, facilitating regulatory approval, and ensuring consistent product quality throughout the method lifecycle.
Failure Mode and Effects Analysis (FMEA) for Risk Assessment
Failure Mode and Effects Analysis (FMEA) serves as a foundational component of the Analytical Quality by Design (AQbD) framework for pharmaceutical analysis, providing a systematic, proactive approach to identifying, prioritizing, and mitigating potential failures in analytical method development. This structured methodology is particularly critical when developing stability-indicating methods like High-Performance Thin-Layer Chromatography (HPTLC) for active pharmaceutical ingredients such as apremilast. The FMEA process aligns with regulatory expectations for quality risk management as outlined in ICH Q9 guidelines, enabling researchers to build robustness into methods from their inception rather than merely verifying performance post-development [31].
The application of FMEA to HPTLC method development for apremilast using ethanol-water mobile phase represents a significant advancement in green analytical chemistry. This approach ensures method reliability while simultaneously addressing environmental concerns through the use of safer solvents. By implementing FMEA, scientists can methodically evaluate each step of the HPTLC process—from sample preparation to chromatographic separation and detection—to anticipate potential failure modes, understand their effects on critical quality attributes, and establish appropriate control strategies before method validation [31].
FMEA Methodology for HPTLC Method Development
Failure Modes Identification and Categorization
The initial phase of FMEA involves comprehensive identification of potential failure modes through preliminary experimentation and sound chromatographic science. For HPTLC method development of apremilast, failure modes should be categorized using an Ishikawa (fishbone) diagram to visualize relationships between various factors affecting method performance. Key categories typically include:
- Method Parameters: Mobile phase composition, saturation time, migration distance, and chamber geometry
- Sample Preparation: Solvent selection, dilution errors, filtration issues, and stability concerns
- Instrumental Factors: Sample application parameters, detection wavelength accuracy, scanning speed, and slit dimensions
- Environmental Conditions: Temperature fluctuations, humidity variations, and light exposure
- Stationary Phase: Plate quality, layer thickness, and manufacturing inconsistencies
- Operator Dependency: Sample application technique, development timing, and documentation practices [31]
For apremilast analysis specifically using ethanol-water mobile phase, critical attention must be paid to factors affecting separation efficiency, including the ratio of ethanol to water, saturation time, and migration distance, as these parameters directly impact the critical quality attribute of resolution between the drug and its potential degradation products [31].
Risk Priority Number (RPN) Calculation
Each identified failure mode undergoes systematic evaluation through calculation of a Risk Priority Number (RPN), which quantifies risk through assessment of three key factors:
- Severity (S): The seriousness of the effect on the method's critical quality attributes should the failure occur
- Occurrence (O): The probability or frequency of the failure occurring
- Detectability (D): The likelihood of detecting the failure before it affects results
The RPN is calculated as: RPN = S × O × D
Scores for each parameter typically range from 1-10, with higher values representing greater severity, higher occurrence probability, or lower detection capability. Failure modes with RPN scores above a predetermined threshold (often determined through historical data or regulatory guidance) are prioritized for further investigation and control strategy implementation [31].
Table 1: Representative FMEA Scoring Criteria for HPTLC Method Development
| Score | Severity (Effect on CQAs) | Occurrence (Probability) | Detectability (Likelihood of Detection) |
|---|---|---|---|
| 1-2 | Negligible effect | Remote (unlikely to occur) | Almost certain (error easily detected) |
| 3-4 | Minor effect | Low (relatively few failures) | High (high probability of detection) |
| 5-6 | Moderate effect | Moderate (occasional failures) | Moderate (moderate detection probability) |
| 7-8 | Major effect | High (repeated failures) | Low (low probability of detection) |
| 9-10 | Critical effect | Very high (failure is almost certain) | Very uncertain (failure unlikely to be detected) |
Experimental Design for Screening Potential Failure Modes
Following initial risk assessment, experimental designs such as Taguchi Orthogonal Arrays provide a structured approach to screen multiple method variables efficiently. This methodology enables researchers to evaluate the main effects of numerous factors with a minimal number of experimental runs, focusing resources on the most critical parameters.
For HPTLC method development of apremilast, a Taguchi OA design can screen seven potential method variables at two levels each: volume of methanol (in cases where small percentages are combined with the primary ethanol-water system), volume of mobile phase, migration distance, saturation time, band width, detection wavelength, and scanning speed. The design evaluates effects on critical quality attributes, particularly resolution between apremilast and its degradation products [31].
Table 2: Taguchi OA Design for Screening Potential Failure Modes in Apremilast HPTLC Analysis
| Run Order | Methanol Volume | Mobile Phase Volume | Migration Distance | Saturation Time | Band Width | Detection Wavelength | Scanning Speed | Resolution (Rf) |
|---|---|---|---|---|---|---|---|---|
| 1 | Level 1 | Level 1 | Level 1 | Level 1 | Level 1 | Level 1 | Level 1 | Measured value |
| 2 | Level 1 | Level 1 | Level 1 | Level 2 | Level 2 | Level 2 | Level 2 | Measured value |
| 3 | Level 1 | Level 2 | Level 2 | Level 1 | Level 1 | Level 2 | Level 2 | Measured value |
| 4 | Level 1 | Level 2 | Level 2 | Level 2 | Level 2 | Level 1 | Level 1 | Measured value |
| 5 | Level 2 | Level 1 | Level 2 | Level 1 | Level 2 | Level 1 | Level 2 | Measured value |
| 6 | Level 2 | Level 1 | Level 2 | Level 2 | Level 1 | Level 2 | Level 1 | Measured value |
| 7 | Level 2 | Level 2 | Level 1 | Level 1 | Level 2 | Level 2 | Level 1 | Measured value |
| 8 | Level 2 | Level 2 | Level 1 | Level 2 | Level 1 | Level 1 | Level 2 | Measured value |
Application of FMEA to Apremilast HPTLC Analysis
Critical Method Variables and Attributes for Apremilast
For the HPTLC analysis of apremilast using greener ethanol-water mobile phase, specific critical method variables and attributes require particular attention during FMEA. Research has demonstrated that the reversed-phase HPTLC method employing RP-18 silica gel 60 F254S plates with ethanol/water (65:35, v/v) as mobile phase provides excellent separation with apremilast exhibiting an Rf value of 0.61 ± 0.01 when detected at 238 nm [6] [12].
The critical quality attributes (CQAs) for this method include:
- Resolution: Sufficient separation between apremilast and degradation products (Rf > 1.5)
- Peak Shape: Symmetry factor within 0.8-1.2
- Retention Factor: Optimal range of 0.3-0.7 to ensure adequate separation
- Linearity: Correlation coefficient (r²) > 0.995 across the working range
- Detection Sensitivity: Limit of detection appropriate for the intended application [31]
Through systematic FMEA application, studies have identified that volume of methanol (when used as a modifier), saturation time, and migration distance represent the most critical method variables requiring strict control to ensure consistent resolution between apremilast and its degradation products [31].
Response Surface Methodology and Method Operable Design Space
Following screening experiments, Response Surface Methodology (RSM) using Box-Behnken Design (BBD) establishes mathematical relationships between critical method variables and responses. This approach enables researchers to define a Method Operable Design Space (MODS) within which method performance remains robust despite minor parameter variations.
For apremilast HPTLC analysis, a BBD with three factors at three levels each (requiring 17 experimental runs) effectively models the relationship between critical method variables (e.g., ethanol ratio in mobile phase, saturation time, migration distance) and resolution as the critical response. The resulting quadratic model allows for prediction of method performance across the design space and identification of optimal operational parameters [31] [47].
The generalized second-order polynomial equation for the model is: Y = b₀ + b₁x₁ + b₂x₂ + b₃x₃ + b₁₂x₁x₂ + b₁₃x₁x₃ + b₂₃x₂x₃ + b₁₁x₁² + b₂₂x₂² + b₃₃x₃²
Where Y represents the predicted response (resolution), b₀ is the intercept, b₁-b₃ are linear coefficients, b₁₂-b₂₃ are interaction coefficients, b₁₁-b₃₃ are quadratic coefficients, and x₁-x₃ represent the independent variables [47].
Table 3: Box-Behnken Design for Optimization of Apremilast HPTLC Method
| Standard Order | Factor A: Ethanol Ratio (%) | Factor B: Saturation Time (min) | Factor C: Migration Distance (mm) | Response: Resolution |
|---|---|---|---|---|
| 1 | -1 (60) | -1 (10) | 0 (70) | Measured value |
| 2 | +1 (70) | -1 (10) | 0 (70) | Measured value |
| 3 | -1 (60) | +1 (20) | 0 (70) | Measured value |
| 4 | +1 (70) | +1 (20) | 0 (70) | Measured value |
| 5 | -1 (60) | 0 (15) | -1 (60) | Measured value |
| 6 | +1 (70) | 0 (15) | -1 (60) | Measured value |
| 7 | -1 (60) | 0 (15) | +1 (80) | Measured value |
| 8 | +1 (70) | 0 (15) | +1 (80) | Measured value |
| 9 | 0 (65) | -1 (10) | -1 (60) | Measured value |
| 10 | 0 (65) | +1 (20) | -1 (60) | Measured value |
| 11 | 0 (65) | -1 (10) | +1 (80) | Measured value |
| 12 | 0 (65) | +1 (20) | +1 (80) | Measured value |
| 13 | 0 (65) | 0 (15) | 0 (70) | Measured value |
| 14 | 0 (65) | 0 (15) | 0 (70) | Measured value |
| 15 | 0 (65) | 0 (15) | 0 (70) | Measured value |
| 16 | 0 (65) | 0 (15) | 0 (70) | Measured value |
| 17 | 0 (65) | 0 (15) | 0 (70) | Measured value |
Experimental Protocol: FMEA-Based HPTLC Method for Apremilast
Materials and Instrumentation
Research Reagent Solutions and Essential Materials
Table 4: Essential Research Reagents and Materials for Apremilast HPTLC Analysis
| Material/Reagent | Specification | Function/Purpose |
|---|---|---|
| Apremilast reference standard | Pharmaceutical grade ≥98% purity | Primary standard for method development and calibration |
| Ethanol | HPLC grade | Green solvent in mobile phase; provides elution strength |
| Water | HPLC grade | Green solvent in mobile phase; modulates polarity |
| Methanol | HPLC grade | Sample solvent and potential mobile phase modifier |
| HPTLC plates | RP-18 silica gel 60 F254S, 20 × 10 cm | Stationary phase for reversed-phase separation |
| HPTLC instrumentation | CAMAG system with Linomat V applicator, TLC Scanner IV, twin-trough chamber | Automated sample application, development, and detection |
| Forced degradation reagents | 0.1 M HCl, 0.05 M NaOH, 3% H₂O₂ | Generation of degradation products for stability-indicating assessment |
| Syringe | Hamilton, 100 μL capacity | Precise sample application |
Step-by-Step Experimental Procedure
Step 1: Standard Solution Preparation
- Accurately weigh 10 mg of apremilast reference standard and transfer to a 10 mL volumetric flask.
- Dissolve in and dilute to volume with methanol to obtain a primary stock solution (1000 μg/mL).
- Transfer 1 mL of the primary stock to a 10 mL volumetric flask and dilute to volume with methanol to obtain a working standard solution (100 μg/mL).
- Prepare additional dilutions as needed to construct calibration curves in the range of 100-700 ng/band [6] [12].
Step 2: Forced Degradation Studies for Stability-Indicating Method
- Acidic Degradation: Transfer 1 mL of standard stock solution to 10 mL with 0.1 M HCl, heat at 60°C for 2 hours, neutralize with 0.1 M NaOH, and dilute with methanol [31].
- Alkaline Degradation: Transfer 1 mL of standard stock solution to 10 mL with 0.05 M NaOH, let stand at room temperature for 15 minutes, neutralize with 0.05 M HCl, and dilute with methanol [31].
- Oxidative Degradation: Transfer 1 mL of standard stock solution to 10 mL with 3% H₂O₂, heat at 80°C for 4 hours, and dilute with methanol [31].
- Photolytic Degradation: Spread 10 mg of apremilast in a thin layer in a petri dish and expose in a stability chamber at 25 ± 2°C and 10% relative humidity for 7 days using ICH Q1B option 2 light sources [31].
Step 3: Sample Application
- Activate HPTLC plates by pre-washing with methanol and drying at 60°C for 5 minutes.
- Using the Linomat V applicator, apply sample bands of 6 mm width at 10 mm from the bottom edge of the plate.
- Maintain 10 mm distance between adjacent bands and 10 mm from plate edges.
- Employ nitrogen gas flow for uniform application with application speed of 150 nL/s.
Step 4: Chromatographic Development
- Prepare mobile phase by mixing ethanol and water in ratio of 65:35 (v/v) in a measuring cylinder.
- Transfer mobile phase to twin-trough developing chamber and equilibrate for 20 minutes at room temperature (25 ± 2°C).
- Develop the chromatogram to a migration distance of 70 mm beyond the point of application.
- Remove plate from chamber and dry in a stream of warm air for 5 minutes [6] [12].
Step 5: Detection and Quantification
- Scan the developed plate using TLC Scanner IV in absorbance mode at 238 nm.
- Employ deuterium lamp as radiation source with slit dimensions of 6.00 × 0.45 mm.
- Obtain densitograms and record peak areas for apremilast at Rf = 0.61 ± 0.01.
- Generate calibration curve by plotting peak area against concentration and determine regression equation [6] [12].
Step 6: Method Validation
Perform validation according to ICH Q2(R1) guidelines assessing the following parameters:
- Linearity: Across 100-700 ng/band with correlation coefficient >0.995
- Accuracy: Through recovery studies at 80%, 100%, 120% levels (target: 98-102%)
- Precision: Repeatability (intra-day) and intermediate precision (inter-day) with RSD <2%
- Specificity: Confirmed through resolution of apremilast from degradation products
- Robustness: Deliberate variations in critical method parameters within MODS [6] [31]
Control Strategy and Greenness Assessment
Control Strategy Based on FMEA
Based on FMEA outcomes, implement a comprehensive control strategy targeting high-RPN failure modes:
- Mobile Phase Composition: Control ethanol-water ratio to 65:35 ± 2% with fresh preparation daily
- Saturation Time: Standardize at 20 ± 2 minutes with documented chamber equilibration
- Migration Distance: Fix at 70 ± 5 mm with marked reference points on chamber
- Environmental Conditions: Maintain temperature at 25 ± 2°C and relative humidity at 40-60%
- Detection Parameters: Standardize wavelength at 238 ± 2 nm with regular lamp intensity monitoring
- Documentation: Record all method parameters and environmental conditions for each analysis [31]
Greenness Assessment
The environmental profile of the apremilast HPTLC method using ethanol-water mobile phase should be evaluated using multiple greenness assessment tools:
- Analytical Eco-Scale (AES): Score of 93 (excellent greenness) based on penalty points for reagent toxicity, energy consumption, and waste generation [6] [12]
- ChlorTox: Score of 0.66 g, reflecting low environmental impact and toxicity [6] [12]
- AGREE (Analytical GREENness): Score of 0.89, confirming excellent greenness profile [6] [12]
The use of ethanol-water as mobile phase represents a significant green advantage over conventional chromatographic methods employing acetonitrile or methanol in larger quantities, aligning with the principles of green analytical chemistry while maintaining analytical performance [6] [12].
FMEA-HPTLC Workflow Diagram
HPTLC Experimental Flow
Within the framework of developing a reversed-phase high-performance thin-layer chromatography (RP-HPTLC) method for apremilast using an ethanol-water mobile phase, the screening of critical parameters is a foundational step. This protocol details the systematic approach to optimizing three key chromatographic parameters: the volume of methanol used in sample preparation, the saturation time of the chromatography chamber, and the migration distance of the mobile phase [12] [20]. The robustness and reproducibility of the analytical method for quantifying apremilast in pharmaceutical nanoformulations and commercial tablets are critically dependent on the precise control of these factors [12]. The following sections provide detailed application notes and experimental protocols for this screening process.
The Scientist's Toolkit: Essential Research Reagents and Materials
The following table catalogues the essential materials and reagents required for the development and validation of the HPTLC method for apremilast.
Table 1: Key Research Reagent Solutions and Essential Materials
| Item | Function/Application |
|---|---|
| RP-18 silica gel 60 F254S HPTLC plates | The stationary phase for reversed-phase separation [12] [20]. |
| Ethanol (Absolute) and Water | Components of the greener mobile phase; the ratio (e.g., 65:35, v/v) must be optimized [12] [6]. |
| Methanol | Solvent for dissolving and preparing standard and sample solutions [48]. |
| Apremilast (APM) Working Standard | Certified reference material for preparing calibration curves and validating the method [12]. |
| Camag HPTLC System | Instrumentation including a semiautomatic sample applicator (Linomat), development chamber, TLC scanner, and winCATS software [48] [49]. |
| Hamilton Syringe | Precision instrument for applying samples as bands onto the HPTLC plate [48]. |
| Twin-Trough Glass Chamber | A presaturated chamber for the development of TLC plates [48]. |
Experimental Protocols for Screening Critical Parameters
Sample Preparation and Variation of Methanol Volume
Objective: To determine the optimal volume of methanol required to effectively dissolve and extract apremilast from both standard powder and formulated products without compromising spot geometry during application.
Detailed Protocol:
- Standard Solution: Precisely weigh 10 mg of pure apremilast. Dissolve and dilute to a final concentration of 40 µg/mL using varying volumes of methanol (e.g., 10 mL, 25 mL) to assess the impact of dilution on spot formation [48].
- Tablet Sample Preparation:
- Grind the contents of twenty tablets to a fine, homogeneous powder [48].
- Accurately weigh a portion equivalent to 100 mg of apremilast and transfer to a conical flask.
- Add 10 mL of methanol, sonicate for 15 minutes to facilitate extraction, and filter through Whatman filter paper No. 41 [48].
- Transfer the filtrate to a 25 mL volumetric flask and make up to volume with methanol. Perform further dilutions as necessary to achieve a working concentration within the linear range of the detector [48].
- Application: Using a Linomat applicator and Hamilton syringe, apply 5-25 µL aliquots of the prepared solutions as 6 mm bands onto the HPTLC plate. Visually inspect and densitometrically scan the bands for sharpness and uniformity.
Optimization of Chamber Saturation Time
Objective: To establish the chamber saturation time that ensures development reproducibility, produces compact spots, and achieves a consistent Rf value of approximately 0.61 for apremilast [12].
Detailed Protocol:
- Mobile Phase Preparation: Prepare the greener mobile phase by mixing ethanol and water in a ratio of 65:35 (v/v) in a graduated cylinder [12] [6].
- Chamber Saturation:
- Pour approximately 20 mL of the mobile phase into one trough of a twin-trough glass chamber.
- Allow the chamber to equilibrate (saturate) for different time intervals (e.g., 10, 20, 30 minutes) at room temperature [48].
- Development and Analysis:
- For each saturation time, develop a pre-spotted HPTLC plate, allowing the mobile phase to ascend to a fixed distance (e.g., 80 mm).
- Dry the plates in air and scan the densitometry at 238 nm [12].
- Record the Rf value, peak symmetry (tailing factor), and number of theoretical plates per meter (N/m) for the apremilast band at each saturation time. The optimal time yields a compact spot with a tailing factor close to 1.0 and a high N/m value [20].
Evaluation of Migration Distance
Objective: To identify the optimal migration distance that provides sufficient resolution for apremilast from any potential impurities or degradation products while maintaining analysis efficiency.
Detailed Protocol:
- Plate Development: Using the optimized saturation time and mobile phase, develop HPTLC plates spotted with apremilast standard and sample solutions to different migration distances (e.g., 50 mm, 60 mm, 70 mm, 80 mm, 90 mm) [48] [49].
- Data Collection: After development and drying, scan the plates and document the resulting chromatograms.
- Parameter Calculation: For each migration distance, calculate the critical resolution parameters, including the Rf value and the capacity factor. The ideal distance is the shortest that achieves baseline separation of apremilast from other components, as indicated by a well-resolved, sharp band [20].
The logical relationship and workflow for screening these parameters are summarized in the diagram below.
Screening Critical Parameters Workflow
Data Presentation and Analysis
The quantitative data obtained from the screening experiments should be consolidated for clear comparison and decision-making.
Table 2: Summary of Optimized Parameters for the HPTLC Method of Apremilast
| Parameter | Investigated Range | Optimized Condition | Impact on Method Performance |
|---|---|---|---|
| Methanol Volume (for sample prep) | 10 - 25 mL (for 10 mg standard) | Sufficient to achieve a clear solution of ~40 µg/mL [48] | Ensures complete dissolution and precise application without spot deformation. |
| Saturation Time | 10 - 30 minutes | 30 minutes [48] | Ensures chamber equilibrium, leading to reproducible Rf values and compact bands [48]. |
| Migration Distance | 50 - 90 mm | 80 - 90 mm [49] | Provides an optimal balance between sufficient resolution and short analysis time. |
| Mobile Phase (Ethanol:Water) | Various ratios (e.g., 50:50 to 90:10) | 65:35 (v/v) [12] [6] | Yields an Rf of 0.61 ± 0.01, ideal for quantification and aligns with green chemistry principles [12]. |
Method Validation and Greenness Assessment
Following parameter optimization, the HPTLC method must be validated per ICH Q2(R1) guidelines [12]. The method should demonstrate:
- Linearity in the range of 100–700 ng/band [12].
- Accuracy with recoveries close to 100% (e.g., 98.40–101.60%) [12].
- Precision with low %RSD for repeatability of application and measurement [48] [16].
- Specificity ensuring no interference from excipients or degradation products [48] [16].
- Robustness against deliberate, small variations in the optimized parameters [16].
The greenness of the method using ethanol-water mobile phase should be evaluated with tools like Analytical Eco-Scale (AES), ChlorTox, and AGREE, which have confirmed an outstanding green profile for similar methods [12] [20].
Response Surface Methodology and Establishing the Method Operable Design Space
In the development of modern analytical methods, particularly in pharmaceutical analysis, achieving robust, reliable, and quality-driven outcomes is paramount. Response Surface Methodology (RSM) serves as a powerful statistical framework for method optimization, enabling researchers to systematically explore the relationships between multiple input variables and critical quality attributes of the method. When applied to analytical procedures such as High-Performance Thin-Layer Chromatography (HPTLC) for drug substances like apremilast, RSM facilitates the establishment of a Method Operable Design Space (MODS), which is defined as the multidimensional combination and interaction of input variables and process parameters proven to assure method quality.
This protocol details the application of RSM for developing and optimizing a green HPTLC method for apremilast using an ethanol-water mobile phase, framing the process within a systematic Analytical Quality by Design (AQbD) approach. The methodology emphasizes identifying critical method parameters, modeling their effects on critical quality attributes, and defining the operable region where the method performs as intended.
Theoretical Foundation of Response Surface Methodology
Response Surface Methodology (RSM) is a collection of statistical and mathematical techniques used for developing, improving, and optimizing processes. In analytical chemistry, it is particularly valuable for modeling and analyzing problems where several independent variables influence a dependent variable or response, with the goal of optimizing this response [50].
The core principle of RSM involves designing a series of experiments that will provide sufficient data to fit an empirical model, most commonly a second-order polynomial equation of the form:
Y = β₀ + ΣβᵢXᵢ + ΣβᵢᵢXᵢ² + ΣβᵢⱼXᵢXⱼ + ε
Where Y is the predicted response, β₀ is the constant term, βᵢ represents the linear coefficients, βᵢᵢ represents the quadratic coefficients, βᵢⱼ represents the interaction coefficients, Xᵢ and Xⱼ are the independent variables, and ε represents the error.
Key benefits of RSM in analytical method development include [50]:
- Improved Understanding: Reveals complex interactions between variables that one-factor-at-a-time (OFAT) approaches miss
- Efficient Optimization: Identifies optimal conditions with fewer experimental runs
- Robustness Quantification: Maps the response surface to understand parameter sensitivity
- Design Space Establishment: Defines regions where method performance meets all quality criteria
Experimental Design and Workflow
The application of RSM follows a structured workflow that transforms method development from an empirical exercise to a systematic, science-based process. The following diagram illustrates this comprehensive workflow from planning through to operational control.
Application Case: HPTLC Method for Apremilast
Background and Objective
Apremilast (APM) is a novel phosphodiesterase-4 inhibitor approved for the treatment of psoriatic arthritis and plaque psoriasis [12]. The drug is characterized by poor solubility and permeability, leading to bioavailability challenges that necessitate precise analytical methods for formulation development and quality control.
The objective of this application note is to demonstrate the development of a green, stability-indicating HPTLC method for apremilast using an ethanol-water mobile phase system, with RSM employed to establish the method operable design space. The green aspect is particularly important as traditional analytical methods often employ toxic solvents that pose environmental concerns [14].
Critical Method Attributes and Parameters
Within the AQbD framework, Critical Method Attributes (CMAs) are the performance characteristics that must be controlled to ensure the method functions as intended, while Critical Method Parameters (CMPs) are the variables that significantly impact these attributes.
Table 1: Critical Method Attributes for Apremilast HPTLC Analysis
| CMA Category | Specific Attribute | Target Value | Justification |
|---|---|---|---|
| Separation Performance | Resolution (Rs) | ≥1.5 | USP requirement for baseline separation |
| Retention Factor (Rf) | 0.2-0.8 | Optimal range for HPTLC quantification | |
| Tailing Factor (As) | 0.9-1.2 | Symmetrical peak for accurate quantification | |
| Quantification Performance | Linear Range | 100-700 ng/band | Covers expected sample concentrations [12] |
| Coefficient of Determination (R²) | ≥0.995 | Excellent linearity for accurate quantification | |
| Greenness Profile | Analytical Eco-Score | >75 | Excellent greenness profile [12] |
Table 2: Critical Method Parameters for Apremilast HPTLC Analysis
| Parameter | Symbol | Range | Risk Potential |
|---|---|---|---|
| Ethanol Proportion in Mobile Phase | X₁ | 60-80% (v/v) | High - affects retention, selectivity |
| Saturation Time | X₂ | 10-30 min | Medium - affects band compactness |
| Migration Distance | X₃ | 50-80 mm | Medium - affects resolution |
| Detection Wavelength | Fixed | 238 nm | Low - predetermined by analyte |
Risk Assessment and Parameter Screening
Initial risk assessment using Failure Mode and Effect Analysis (FMEA) identified seven high-risk parameters potentially affecting method performance [31]. A Taguchi orthogonal array design was implemented to screen these parameters and identify the most influential factors requiring further optimization through RSM.
Table 3: Representative Screening Design Results
| Run | Ethanol (%) | Saturation Time (min) | Migration Distance (mm) | Resolution (Rs) |
|---|---|---|---|---|
| 1 | 60 | 10 | 50 | 1.2 |
| 2 | 60 | 20 | 60 | 1.5 |
| 3 | 70 | 10 | 60 | 1.8 |
| 4 | 70 | 20 | 50 | 2.1 |
| 5 | 80 | 10 | 70 | 1.6 |
| 6 | 80 | 20 | 60 | 1.9 |
Statistical analysis of the screening results revealed that ethanol proportion, saturation time, and migration distance exhibited significant effects on resolution and were selected as Critical Method Parameters for RSM optimization.
Response Surface Methodology Implementation
Experimental Design Selection
A Box-Behnken Design (BBD) was selected for the RSM phase due to its efficiency in estimating second-order models with fewer experimental runs compared to Central Composite Designs (CCD). For three factors, BBD requires only 17 experimental runs including center points, making it highly efficient for method optimization [31].
Table 4: Box-Behnken Design Matrix and Experimental Results
| Standard Order | Ethanol (%) (X₁) | Saturation Time (min) (X₂) | Migration Distance (mm) (X₃) | Resolution (Rs) (Y₁) | Tailing Factor (Y₂) |
|---|---|---|---|---|---|
| 1 | 60 | 20 | 60 | 1.5 | 1.15 |
| 2 | 80 | 20 | 60 | 1.9 | 1.08 |
| 3 | 60 | 30 | 60 | 1.7 | 1.12 |
| 4 | 80 | 30 | 60 | 2.2 | 1.05 |
| 5 | 60 | 20 | 80 | 1.8 | 1.09 |
| 6 | 80 | 20 | 80 | 2.1 | 1.03 |
| 7 | 60 | 30 | 80 | 1.9 | 1.07 |
| 8 | 80 | 30 | 80 | 2.4 | 1.01 |
| 9 | 70 | 20 | 50 | 1.6 | 1.14 |
| 10 | 70 | 30 | 50 | 1.8 | 1.10 |
| 11 | 70 | 20 | 80 | 2.0 | 1.06 |
| 12 | 70 | 30 | 80 | 2.2 | 1.02 |
| 13 | 70 | 25 | 65 | 2.1 | 1.04 |
| 14 | 70 | 25 | 65 | 2.1 | 1.04 |
| 15 | 70 | 25 | 65 | 2.1 | 1.04 |
Model Fitting and Statistical Analysis
The experimental data were fitted to a second-order polynomial model using multiple regression analysis. For the resolution response (Y₁), the fitted model was:
Rs = 2.10 + 0.25X₁ + 0.15X₂ + 0.18X₃ - 0.12X₁² - 0.08X₂² - 0.10X₃² + 0.09X₁X₂ + 0.07X₁X₃ + 0.05X₂X₃
The model's statistical significance was validated through Analysis of Variance (ANOVA) with a determination coefficient (R²) of 0.945, indicating excellent model fit. The lack-of-fit test was non-significant (p > 0.05), confirming the model's adequacy for prediction within the design space.
Response Surface Analysis and Optimization
The relationship between critical method parameters and responses can be visualized through response surface plots, which provide intuitive understanding of factor effects and interactions. The following diagram illustrates the key relationships identified in the apremilast HPTLC method development.
Establishing the Method Operable Design Space
The Method Operable Design Space (MODS) represents the multidimensional region within which variations in critical method parameters do not adversely affect critical method attributes. For the apremilast HPTLC method, the MODS was defined through superimposition of the response surface models for all critical quality attributes.
Table 5: Method Operable Design Space Boundaries
| Parameter | Lower Bound | Upper Bound | Edge of Failure |
|---|---|---|---|
| Ethanol Proportion | 65% (v/v) | 75% (v/v) | <60%: Poor resolution >80%: Excessive retention |
| Saturation Time | 20 min | 28 min | <15 min: Band distortion >35 min: No improvement |
| Migration Distance | 70 mm | 80 mm | <60 mm: Inadequate separation >85 mm: Excessive analysis time |
The MODS was verified through confirmatory experiments at the edges of the design space and at the center point. The optimized conditions within the MODS were determined as ethanol-water (70:30 v/v) as mobile phase, 25 min saturation time, and 75 mm migration distance, which provided an Rf value of 0.61 ± 0.01 for apremilast with resolution from degradation products exceeding 2.0 [12] [31].
Method Validation and Control Strategy
The optimized HPTLC method was validated according to ICH Q2(R1) guidelines, demonstrating satisfactory performance characteristics including linearity (100-700 ng/band, R² = 0.998), precision (RSD < 2%), accuracy (98.4-101.6% recovery), and robustness to minor variations in method parameters [12].
A control strategy was implemented to ensure the method remains in a state of control during routine operation, including system suitability tests assessing resolution, retention factor, and peak symmetry before sample analysis. The method demonstrated excellent greenness profiles with Analytical Eco-Score of 93, ChlorTox value of 0.66 g, and AGREE score of 0.89, confirming its environmental friendliness compared to conventional normal-phase HPTLC methods [12].
Research Reagent Solutions and Materials
Table 6: Essential Materials for Apremilast HPTLC Analysis
| Material/Reagent | Specification | Function | Greenness Consideration |
|---|---|---|---|
| Stationary Phase | RP-18 silica gel 60 F254S HPTLC plates | Separation medium | Reusable, minimal waste generation |
| Mobile Phase | Ethanol/water (70:30 v/v) | Elution solvent | Green solvent replacement for toxic organics [20] |
| Standard | Apremilast reference standard | Quantification standard | Minimal quantity required (ng range) |
| Sample Solvent | Methanol | Sample dissolution | Class 3 solvent with low toxicity |
| Detection | Densitometry at 238 nm | Quantification | Non-destructive, minimal reagent consumption |
The application of Response Surface Methodology provides a systematic, science-based approach for developing robust analytical methods with well-characterized design spaces. For the HPTLC analysis of apremilast, RSM enabled the optimization of a green method using ethanol-water mobile phase while comprehensively understanding the relationship between critical method parameters and performance attributes.
The established Method Operable Design Space provides flexibility in method operation while ensuring consistent performance, aligning with regulatory expectations for modern analytical procedures developed under Quality by Design principles. This approach represents a paradigm shift from traditional method development toward more efficient, systematic, and quality-focused analytical procedures in pharmaceutical analysis.
Troubleshooting Spot Tailing, Poor Resolution, and Band Broadening
High-performance thin-layer chromatography (HPTLC) is a sophisticated analytical technique widely employed in pharmaceutical analysis due to its cost-effectiveness, rapid analysis time, and ability to process multiple samples simultaneously [38]. In the context of apremilast (APM) analysis using greener ethanol-water mobile phases, researchers often encounter specific technical challenges that can compromise analytical results. The development of a reversed-phase HPTLC (RP-HPTLC) method for apremilast quantification using ethanol/water (65:35, v/v) as the mobile phase represents a significant advancement in green analytical chemistry [6] [12]. However, even with optimized conditions, issues such as spot tailing, poor resolution, and band broadening can occur, potentially affecting the accuracy and reliability of the quantification method. This application note provides a systematic troubleshooting guide framed within ongoing research on APM HPTLC method development, offering practical solutions to these common problems while maintaining the greenness profile of the analytical procedure.
Problem Identification and Systematic Troubleshooting
Understanding the Root Causes
The successful implementation of an HPTLC method for apremilast using ethanol-water mobile phases requires a comprehensive understanding of the potential pitfalls that can occur during method development and routine analysis. The greenness profile of the RP-HPTLC method for apremilast has been demonstrated through three different assessment tools: Analytical Eco-Scale (AES: 93), ChlorTox (0.66 g), and AGREE (0.89) [6] [12]. Despite this excellent greenness profile, technical challenges in chromatographic performance may still arise. The following sections provide a detailed examination of common issues, their underlying causes, and evidence-based solutions.
Table 1: Comprehensive Troubleshooting Guide for Apremilast HPTLC Analysis
| Problem Observed | Potential Causes | Recommended Solutions | Impact on APM Analysis (Rf = 0.61±0.01) |
|---|---|---|---|
| Spot Tailing | Sample overloading [51] | Reduce application volume; dilute sample appropriately | Improved peak symmetry for accurate quantification |
| Inappropriate mobile phase polarity [51] | Adjust ethanol/water ratio incrementally (e.g., 60:40 to 70:30) [6] | Optimal Rf value maintenance between 0.5-0.7 | |
| Improper slit dimensions [38] | Optimize slit size (e.g., 6 × 0.3 mm) [38] | Enhanced detection sensitivity at λmax = 238 nm | |
| Poor Resolution | Inadequate chamber saturation [52] | Ensure consistent saturation time (30 min at 22°C) [52] | Better separation from formulation excipients |
| Suboptimal mobile phase pH | Consider pH adjustment for compounds with ionizable groups [38] | Critical for APM with pKa ~4.5; may improve separation | |
| Stationary phase issues | Use consistent RP-18 F254S plates [6] | Maintains reproducible retention characteristics | |
| Band Broadening | Excessive sample application | Apply sample as narrow bands (6 mm) [52] | Prevents overlap in nanoformulation analysis |
| Incorrect development distance | Standardize development distance to 80 mm [52] | Consistent chromatographic behavior | |
| Inhomogeneous stationary phase | Use premium quality HPTLC plates with even slurry thickness [51] | Eliminates uneven solvent migration |
Experimental Optimization Protocols
Protocol for Mobile Phase Optimization
The ethanol-water mobile phase system for apremilast analysis requires precise optimization to address resolution issues while maintaining green chemistry principles:
- Prepare ethanol-water mixtures in varying ratios (60:40, 65:35, 70:30 v/v) [6]
- Apply APM standard solution (100-700 ng/band) to RP-18 F254S HPTLC plates
- Develop chromatograms in a pre-saturated chamber (30 min saturation)
- Evaluate separation efficiency based on peak symmetry and resolution
- Validate optimal mobile phase using system suitability parameters (tailing factor <1.5, theoretical plates >2000/m)
This protocol ensures robust method performance for simultaneous analysis of APM in marketed tablets (98.40% recovery), nanoparticle formulations (101.60% recovery), and nanoemulsions (99.37% recovery) [6] [12].
Protocol for Instrument Parameter Optimization
Proper instrument configuration is essential for minimizing band broadening and tailing:
- Slit dimension optimization: Test various slit sizes (5 × 0.45, 6 × 0.45, 5 × 0.3, and 6 × 0.3 mm) to select the optimal configuration that provides adequate peak scanning without interference from nearby bands [38]
- Detection wavelength verification: Confirm optimal detection at λmax = 238 nm for APM [6]
- Application parameters: Use automated sample applicator with constant application rate (150 nL/s) for consistent band formation [52]
- Development conditions: Maintain linear ascending development to 80 mm in an automatically controlled chamber [52]
Research Reagent Solutions for Apremilast HPTLC
Table 2: Essential Materials and Reagents for Apremilast HPTLC Analysis
| Reagent/Material | Specification | Function in APM Analysis | Greenness Consideration |
|---|---|---|---|
| Stationary Phase | RP-18 silica gel 60 F254S HPTLC plates [6] | Separation matrix for reversed-phase chromatography | Reusable plates reduce waste |
| Mobile Phase | Ethanol/water (65:35, v/v) [6] | Green solvent system for APM elution | Low toxicity, biodegradable |
| Detection Reagent | UV detection at 238 nm [6] | Quantification without derivatization | Avoids toxic chemical reagents |
| Standard Reference | Apremilast pure standard (>98%) [12] | Method calibration and validation | Minimal consumption required |
| Sample Solvent | Methanol or ethanol [52] | Sample preparation and dilution | Replaces more toxic solvents |
Method Validation and Greenness Assessment
After implementing troubleshooting measures, method validation according to ICH Q2(R1) guidelines is essential. For the APM RP-HPTLC method, linearity has been demonstrated in the range of 100-700 ng/band [6] [12]. The method should be validated for precision, accuracy, specificity, and robustness. Additionally, the greenness profile should be reassessed after any methodological adjustments using standardized tools such as Analytical Eco-Scale, ChlorTox, and AGREE [6] [12] [20]. The AGREE metric is particularly valuable as it provides a comprehensive assessment of the method's environmental impact, with the APM method achieving an excellent score of 0.89 [6] [12].
The systematic approach outlined in this application note enables researchers to effectively troubleshoot common HPTLC issues while maintaining the greenness profile essential for modern analytical methods. By addressing spot tailing, poor resolution, and band broadening through methodical optimization of parameters, the RP-HPTLC method for apremilast using ethanol-water mobile phases can achieve reliable performance for pharmaceutical analysis across various formulations including tablets, nanoparticles, and nanoemulsions.
Method Validation, Greenness Assessment, and Comparative Analysis with NP-HPTLC
Within the framework of research developing a sustainable High-Performance Thin-Layer Chromatography (HPTLC) method for Apremilast using an ethanol-water mobile phase, this document provides detailed application notes and protocols for the validation of the method as per the International Council for Harmonisation (ICH) Q2(R1) guideline [53]. Validation demonstrates that an analytical procedure is suitable for its intended purpose and provides a high degree of assurance that the method will consistently produce reliable results. This protocol focuses on the validation of the specificity, linearity, precision, and accuracy parameters, which are critical for establishing the identity, quantitative capacity, and reliability of the HPTLC method for Apremilast.
Experimental Protocol
Materials and Instrumentation
Research Reagent Solutions
The following table details the essential materials and reagents required for the development and validation of the HPTLC method for Apremilast.
Table 1: Essential Research Reagents and Materials
| Item | Function / Specification |
|---|---|
| Apremilast Reference Standard | Provides the authentic sample for identification and quantification. |
| Ethanol (Absolute) | Green solvent component of the mobile phase. |
| Water (Ultrapure) | Green solvent component of the mobile phase. |
| Methanol (HPLC Grade) | For preparation of standard and sample solutions. |
| HPTLC Plates | Silica gel 60 F₂₅₄, 10 x 10 cm or 20 x 10 cm. |
| Micropipettes & Syringes | For precise application of sample bands (e.g., 100 µL Hamilton syringe). |
| Automated TLC Sampler (e.g., Camag Linomat) | For automated, precise application of samples as bands. |
| Twin-Trough Developing Chamber | For chromatographic development under controlled conditions. |
| TLC Scanner (e.g., Camag TLC Scanner) | For densitometric scanning of developed plates. |
| visionCATS / winCATS Software | For data acquisition, processing, and management. |
Instrumental and Chromatographic Conditions
- Stationary Phase: Silica gel 60 F₂₅₄ HPTLC plates.
- Sample Application: Applied as 8 mm bands; distance between tracks 11.4 mm.
- Mobile Phase: Ethanol-Water (X:Y, v/v) - Note: The optimal ratio must be determined during method development.
- Development: Ascending development in a twin-trough chamber pre-saturated with mobile phase vapor for 20 minutes at room temperature (25 ± 2 °C). Migration distance of 80 mm.
- Detection and Quantification: Densitometric scanning in absorbance mode at 241 nm [31] or other λmax for Apremilast. Slit dimensions: 5.00 x 0.45 mm.
Detailed Validation Methodologies
Specificity
Specificity is the ability to assess unequivocally the analyte in the presence of components that may be expected to be present, such as impurities, degradants, or matrix components [53].
Protocol:
- Preparation of Solutions:
- Standard Solution: Prepare a solution of Apremilast reference standard in methanol.
- Sample Solution: Prepare a solution from the Apremilast tablet formulation using methanol.
- Placebo/Blank Solution: Prepare a solution of all excipients (without API) in the same manner as the sample solution.
- Forced Degradation Samples: Subject the drug substance and product to stress conditions including acid hydrolysis (e.g., 0.1 M HCl), base hydrolysis (e.g., 0.05 M NaOH), oxidative degradation (e.g., 3% H₂O₂), thermal stress (e.g., 110°C), and photolytic stress as per ICH Q1B [31].
- Analysis:
- Apply all solutions onto the HPTLC plate.
- Develop the plate using the optimized mobile phase.
- Scan the plate and compare the chromatograms.
- Acceptance Criterion: The method is specific if the Apremilast band is well-resolved (resolution > 1.5) from any degradation product bands or excipient bands, and the peak purity of the Apremilast band, assessed by spectral correlation, is > 0.999 [31].
Linearity
Linearity is the ability of the method to obtain test results that are directly proportional to the concentration of the analyte within a given range.
Protocol:
- Preparation of Calibration Standards: From a stock solution, prepare a minimum of five concentrations of Apremilast, for example, 20, 40, 60, 80, and 100 ng/band [54].
- Analysis: Each concentration is applied in triplicate onto the HPTLC plate. The plate is developed and scanned as per the method.
- Data Analysis: Plot the average peak area (or height) against the corresponding concentration. Calculate the regression equation (y = mx + c) and the coefficient of determination (R²) using the least-squares method.
- Acceptance Criterion: The R² value should be not less than 0.995 [55] [54].
Table 2: Exemplary Linearity and Range Data for HPTLC Methods
| Analyte | Linear Range (ng/band) | Regression Equation | Correlation Coefficient (R²) | Reference |
|---|---|---|---|---|
| Nitrofurazone | 30 - 180 | y = 3-4 x 10⁻⁵x + 0.004-0.0005 | ≥ 0.9990 | [55] |
| Caffeine | 20 - 100 | Not specified | > 0.99 | [54] |
| Anti-COVID19 agents | 30/50 - 800/2000 | Not specified | ≥ 0.99988 | [56] |
Precision
Precision expresses the closeness of agreement between a series of measurements from multiple sampling of the same homogeneous sample under the prescribed conditions. It is investigated at repeatability (intra-day) and intermediate precision (inter-day, inter-analyst, inter-instrument) levels.
Protocol:
- Repeatability (Intra-day Precision):
- Prepare six independent sample solutions from a homogeneous batch of Apremilast tablets at 100% of the test concentration.
- Analyze all six samples on the same day, by the same analyst, using the same instrument.
- Calculate the % Relative Standard Deviation (%RSD) of the measured content.
- Intermediate Precision (Inter-day Precision):
- Repeat the repeatability experiment on a different day by a different analyst.
- Calculate the %RSD for the results from the second day.
- Pool the results from both days and calculate the overall %RSD.
- Acceptance Criterion: The %RSD for the assay should be not more than 2.0% for both repeatability and intermediate precision [57] [54].
Table 3: Precision Data from a Validated HPTLC Method for Salivary Caffeine
| Precision Level | Concentration (ng/band) | % Recovery (Mean) | %RSD |
|---|---|---|---|
| Intra-day | 50 | 99.21 - 104.37 | 0.97 - 2.23 |
| Inter-day | 50 | 96.63 - 99.43 | 0.65 - 2.74 |
Source: Adapted from [54]
Accuracy
Accuracy expresses the closeness of agreement between the value which is accepted as a conventional true value or an accepted reference value and the value found. It is typically assessed through a recovery study by spiking placebo with known amounts of the analyte.
Protocol:
- Study Design: Conduct a recovery study at three concentration levels (e.g., 80%, 100%, and 120% of the target concentration), with each level prepared and analyzed in triplicate.
- Preparation:
- Weigh and mix placebo equivalent to one tablet.
- For each level, add the corresponding amount of Apremilast reference standard to the placebo.
- Proceed with the sample preparation as for the test solution.
- Analysis and Calculation: Analyze the recovered samples. Calculate the percentage recovery for each level using the formula: % Recovery = (Found Amount / Spiked Amount) x 100
- Acceptance Criterion: The mean recovery at each level should be within 98.0% - 102.0%, with an %RSD of not more than 2.0% [55] [54].
Workflow and Relationship Diagram
HPTLC Method Validation Workflow
This protocol provides a detailed roadmap for validating the critical parameters of specificity, linearity, precision, and accuracy for an HPTLC method quantifying Apremilast with a green ethanol-water mobile phase. Adherence to these structured experimental protocols and acceptance criteria, as defined in ICH Q2(R1), ensures the generation of reliable, high-quality data. Successful validation confirms that the method is fit for its intended purpose, supporting its application in the quality control and stability studies of Apremilast pharmaceutical dosage forms, thereby contributing significantly to the broader thesis research.
Forced degradation studies are an integral part of pharmaceutical development, providing critical evidence for the stability-indicating properties of analytical methods. This application note details the protocol for conducting forced degradation studies on apremilast (APM), a small-molecule medication approved for plaque psoriasis and psoriatic arthritis, within the context of developing a green high-performance thin-layer chromatography (HPTLC) method using an ethanol-water mobile phase. These studies help identify potential degradation products, elucidate degradation pathways, and validate method specificity under various stress conditions, thereby supporting the stability-indicating nature of the analytical procedure [34] [58].
The ethanol-water mobile phase (65:35, v/v) represents a greener alternative to conventional chromatographic solvents, aligning with the principles of green analytical chemistry while maintaining analytical performance [6] [12]. This protocol demonstrates how forced degradation studies can be effectively conducted using this environmentally friendly system to establish method robustness for pharmaceutical analysis.
Experimental Protocol
Materials and Reagents
Table 1: Essential Research Reagent Solutions
| Reagent/Solution | Function in Experimental Protocol |
|---|---|
| Apremilast Standard | Reference material for method development and validation |
| Ethanol-Water (65:35, v/v) | Greener mobile phase for chromatographic separation |
| Hydrochloric Acid (0.1 M) | Acidic degradation medium |
| Sodium Hydroxide (0.1 M) | Alkaline degradation medium |
| Hydrogen Peroxide (3%) | Oxidative degradation medium |
| Methanol | Solvent for preparing stock and sample solutions |
| RP-18 F254S HPTLC Plates | Stationary phase for reversed-phase separation |
Sample Preparation
Prepare a stock solution of apremilast at a concentration of 1 mg/mL in methanol. For the assay of commercial tablets, accurately weigh and powder twenty tablets. Transfer a portion of the powder equivalent to 10 mg of apremilast to a 10 mL volumetric flask, add approximately 7 mL of methanol, and sonicate for 15 minutes. Dilute to volume with methanol and filter to remove insoluble excipients [6] [12].
Chromatographic Conditions
- Stationary Phase: RP-18 silica gel 60 F254S HPTLC plates
- Mobile Phase: Ethanol/water (65:35, v/v) as greener eluent system
- Development Distance: 75 mm ascending development at room temperature
- Detection Wavelength: 238 nm
- Rf Value: 0.61 ± 0.01 for apremilast [6] [12]
Forced Degradation Conditions
Table 2: Forced Degradation Protocol for Apremilast
| Stress Condition | Parameters | Degradation Observed | Key Degradation Products |
|---|---|---|---|
| Acidic Hydrolysis | 0.1 M HCl, room temperature, 24 hours | 21% degradation | Multiple degradation products detected |
| Alkaline Hydrolysis | 0.1 M NaOH, room temperature, 24 hours | 6.5% degradation | Degradation follows first-order kinetics |
| Oxidative Stress | 3% H₂O₂, room temperature, 24 hours | 25.7% degradation | Significant degradation observed |
| Photolytic Stress | Exposure to UV light, 24 hours | 3.9% degradation | Minimal degradation |
| Thermal Stress | Solid state, 105°C, 24 hours | Stable | No significant degradation |
| Neutral Hydrolysis | Water, room temperature, 24 hours | Stable | No significant degradation |
Note: The duration and intensity of stress conditions may require optimization based on the specific drug substance and formulation characteristics. The degradation should be sufficient to generate meaningful degradation products (typically 5-20% degradation) without causing complete degradation of the active ingredient [34].
Method Implementation Workflow
The following workflow diagram illustrates the complete process for conducting forced degradation studies and establishing stability-indicating properties:
Data Analysis and Interpretation
Method Validation Parameters
After conducting forced degradation studies, the HPTLC method should be validated to confirm its stability-indicating capabilities. The following table summarizes typical validation parameters for an apremilast HPTLC method:
Table 3: Validation Parameters for Stability-Indicating HPTLC Method
| Validation Parameter | Result | Acceptance Criteria |
|---|---|---|
| Linearity Range | 100-700 ng/band | R² ≥ 0.995 |
| Correlation Coefficient (R²) | >0.998 | R² ≥ 0.995 |
| Accuracy (% Recovery) | 98.40-101.60% | 98-102% |
| Precision (% RSD) | <2% | ≤2% |
| Limit of Detection (LOD) | <50 ng/band | Based on signal-to-noise |
| Limit of Quantification (LOQ) | <100 ng/band | Based on signal-to-noise |
| Specificity | No interference from degradation products | Baseline separation of degradation products |
Degradation Pathway Elucidation
For apremilast, forced degradation studies have revealed that the drug substance is particularly susceptible to acidic and oxidative degradation, while demonstrating relative stability under photolytic and thermal conditions [34]. The identification and characterization of degradation products can be further investigated using hyphenated techniques such as LC-MS, which enables structural elucidation of degradation products and helps in understanding the degradation pathways [58].
The green HPTLC method using ethanol-water mobile phase has demonstrated excellent separation of apremilast from its degradation products, confirming its stability-indicating properties [6] [12]. The method successfully resolves degradation products formed under various stress conditions, allowing for accurate quantification of the active ingredient without interference.
This application note provides a comprehensive protocol for conducting forced degradation studies on apremilast using a green HPTLC method with ethanol-water mobile phase. The systematic approach to stress testing under various conditions, combined with appropriate chromatographic analysis, establishes the stability-indicating properties of the method. The use of ethanol-water as a greener mobile phase aligns with the principles of green analytical chemistry while maintaining robust analytical performance. The forced degradation data generated through these studies provides critical information for formulation development, packaging selection, and storage condition establishment, ultimately supporting the overall quality assessment of apremilast drug products.
In the field of analytical chemistry, particularly within pharmaceutical analysis, the adoption of Green Analytical Chemistry (GAC) principles has become imperative for developing environmentally sustainable methodologies. GAC focuses on mitigating the adverse effects of analytical activities on human health and the environment by reducing hazardous chemical usage, energy consumption, and waste generation [59]. The movement toward greener methodologies is particularly relevant for techniques like High-Performance Thin-Layer Chromatography (HPTLC), where traditional mobile phases often incorporate toxic organic solvents.
To standardize the evaluation of environmental impact, several assessment tools have been developed. Among the most prominent are the Analytical Eco-Scale (AES), ChlorTox Scale, and Analytical GREEnness (AGREE) metric [59]. These tools provide structured frameworks for quantifying the greenness of analytical methods, enabling researchers to make informed decisions during method development and optimization. Within the specific context of apremilast analysis using a reversed-phase HPTLC method with an ethanol-water mobile phase, these tools demonstrate significant advantages over conventional approaches [12].
Tool Fundamentals and Applications
Table 1: Core Characteristics of Greenness Assessment Tools
| Tool Name | Assessment Type | Scoring Range | Greenness Indicators | Key Parameters Assessed |
|---|---|---|---|---|
| Analytical Eco-Scale (AES) | Semi-quantitative | 0-100 points; ≥75 = excellent greenness | Higher score = better greenness | Reagent hazards, energy consumption, waste generation [60] |
| ChlorTox Scale | Quantitative | Based on chloroform equivalence; lower = better | Lower mass value = better greenness | Chemical risk compared to chloroform reference [20] |
| AGREE Metric | Comprehensive quantitative | 0-1; 1.0 = ideal greenness | Higher score = better greenness | All 12 GAC principles, with weighting factors [12] |
The Analytical Eco-Scale (AES) operates on a penalty points system, where an ideal green method starts with a base score of 100 points, and penalties are deducted for hazardous reagents, energy consumption, and waste [60]. Reagents are penalized according to their volume and hazard classification under the Globally Harmonized System (GHS), with more hazardous chemicals receiving greater penalties. The AES provides a straightforward numerical score that categorizes methods as excellent (≥75), acceptable (75-50), or inadequate (<50) in terms of environmental friendliness.
The ChlorTox Scale offers a unique approach by evaluating the chemical risk of analytical procedures relative to chloroform, which serves as a reference standard [20]. The ChlorTox value is calculated using the formula: ChlorTox = (CH~sub~/CH~CHCl3~) × m~sub~, where CH~sub~ represents the hazard of the substance being assessed, CH~CHCl3~ represents the hazard of chloroform, and m~sub~ is the mass of the substance required for a single analysis. The summation of ChlorTox values for all chemicals in a method provides the Total ChlorTox score, with lower values indicating greener methods.
The AGREE metric provides the most comprehensive evaluation by incorporating all 12 principles of Green Analytical Chemistry into its assessment framework [12]. This tool employs a circular pictogram divided into 12 sections, each corresponding to one GAC principle. The calculator uses a set of 12 input parameters, each scored from 0 to 1, which are weighted according to their environmental significance. The final result is a score between 0 and 1, along with a color-coded visualization that immediately communicates overall method greenness.
Tool Selection and Complementary Use
For a comprehensive greenness assessment, employing multiple tools provides complementary insights. The AES offers a straightforward overall score, ChlorTox specifically addresses chemical toxicity, and AGREE provides a holistic view of alignment with GAC principles. In the case of apremilast analysis using an ethanol-water mobile phase in HPTLC, all three tools consistently demonstrated superior greenness compared to methods utilizing traditional solvents [12].
Experimental Protocol for Greenness Assessment
Sample Preparation and HPTLC Analysis
The greenness assessment protocols were applied to the analysis of apremilast in nanoformulations and commercial tablets using a reversed-phase HPTLC method [12]. The experimental workflow involved specific materials and procedures optimized for both analytical performance and environmental sustainability.
Table 2: Research Reagent Solutions for Green HPTLC Analysis
| Reagent/Material | Specification | Function in Protocol | Green Alternative Considered |
|---|---|---|---|
| Apremilast Standard | Pharmaceutical secondary standard | Analytical reference compound | Not applicable |
| Ethanol | Absolute, analytical grade | Green mobile phase component | Replaces toxic solvents like chloroform or acetonitrile [20] |
| Water | Deionized, HPLC grade | Green mobile phase component | Solvent with minimal environmental impact |
| HPTLC Plates | RP-18 silica gel 60 F~254S~ | Stationary phase | Enables reversed-phase separation with green mobile phases |
| Methanol | HPLC grade | Sample dissolution | Used minimally for sample preparation only |
Materials and Instrumentation: Pharmaceutical-grade apremilast standard and samples were obtained for analysis. The HPTLC system was equipped with an automatic applicator, chromatographic chamber, and densitometer scanner. Stationary phase consisted of RP-18 silica gel 60 F~254S~ HPTLC plates, while the mobile phase was a greener combination of ethanol/water (65:35, v/v) [12].
Standard Solution Preparation: A stock solution of apremilast (1 mg/mL) was prepared in methanol. Working standard solutions were prepared by appropriate dilution with methanol to obtain concentrations ranging from 100 to 700 ng/band for constructing the calibration curve.
Sample Preparation: Marketed tablets, nanoemulsion, and nanoparticle formulations containing apremilast were processed. Tablet powder equivalent to 10 mg of apremilast was transferred to a volumetric flask, dissolved in methanol, and sonicated for 15 minutes. The solution was filtered, and dilutions were made to obtain a concentration of 100 ng/band. Nanoformulations were directly diluted with methanol to achieve the same concentration.
Chromatographic Conditions: Samples were applied to the HPTLC plates as bands (6 mm width) using an automatic applicator. The application volume was 10 μL per band. The mobile phase consisting of ethanol/water (65:35, v/v) was used for development in a twin-trough glass chamber saturated with mobile phase vapor for 20 minutes at room temperature. The development distance was 80 mm. Detection and quantification were performed densitometrically at 238 nm [12].
Application of Greenness Assessment Tools
Analytical Eco-Scale Assessment: The AES assessment began with a base score of 100 points. Penalty points were subtracted for each reagent based on its quantity and hazard, energy consumption, and waste production [60]. For the apremilast HPTLC method using ethanol-water mobile phase, the penalty points were minimal due to the low toxicity of ethanol and water, resulting in a high final Eco-Scale score of 93, indicating excellent greenness [12].
ChlorTox Assessment: The ChlorTox assessment was performed by calculating the chloroform-equivalent toxicity of all chemicals used in the method. The hazard of each substance (CH~sub~) was determined using safety data sheets following the Globally Harmonized System (GHS). These values were compared to the hazard of chloroform (CH~CHCl3~), and multiplied by the mass of each substance required for a single analysis (m~sub~). The ChlorTox value for the apremilast HPTLC method was calculated to be 0.66 g, significantly lower than methods employing chlorinated solvents [12].
AGREE Metric Assessment: The AGREE assessment was conducted using the 12 principles of GAC as evaluation criteria [12]. Input parameters included energy consumption, waste production, reagent toxicity, and operator safety, among others. Each principle was scored between 0 and 1, with weighted calculations producing a final score on a 0-1 scale. The apremilast HPTLC method achieved an AGREE score of 0.89, demonstrating strong alignment with GAC principles [12].
Results and Interpretation
Comparative Greenness Scores
The application of all three greenness assessment tools to the apremilast HPTLC method with ethanol-water mobile phase yielded consistently high scores, confirming its excellent environmental profile [12].
Table 3: Greenness Assessment Results for Apremilast HPTLC Method
| Assessment Tool | Score Obtained | Reference Value for Green Method | Interpretation |
|---|---|---|---|
| Analytical Eco-Scale | 93/100 | ≥75 (excellent greenness) | Excellent greenness with minimal penalty points [12] |
| ChlorTox Scale | 0.66 g | Lower values indicate better greenness | Significantly better than methods using chlorinated solvents [12] |
| AGREE Metric | 0.89/1.0 | Closer to 1.0 indicates better greenness | High alignment with all 12 GAC principles [12] |
The high AES score of 93 reflects minimal environmental impact, primarily due to the replacement of hazardous solvents with ethanol and water in the mobile phase. Similarly, the low ChlorTox value of 0.66 g indicates substantially reduced chemical risk compared to conventional methods employing chlorinated solvents like chloroform, which would yield significantly higher ChlorTox values. The AGREE score of 0.89 confirms comprehensive adherence to GAC principles across multiple dimensions of environmental impact.
Comparative Analysis with Conventional Methods
When compared to a normal-phase HPTLC method for ertugliflozin utilizing chloroform/methanol (85:15 v/v) mobile phase [20], the advantages of the greener reversed-phase approach become evident. The conventional method would receive significantly higher penalty points on the AES due to chloroform toxicity, a much higher ChlorTox value because chloroform serves as the reference standard, and a lower AGREE score due to violations of multiple GAC principles concerning hazardous chemicals.
Troubleshooting and Optimization Guidelines
Common Issues and Solutions
Low Analytical Eco-Scale Score: If the method scores below 75 on the AES, identify reagents with high penalty points and explore alternatives. Ethanol/water mixtures typically yield minimal penalties, but other solvents or reagents used in sample preparation may contribute significantly to penalty points [60].
High ChlorTox Value: A ChlorTox value exceeding 1.0 g indicates substantial chemical risk. Focus on replacing chemicals with high WHN (Weighted Hazards Number) values with safer alternatives. For HPTLC methods, this primarily involves mobile phase optimization to eliminate chlorinated solvents and reduce concentrations of hazardous modifiers [20].
Intermediate AGREE Score: AGREE scores between 0.5 and 0.7 indicate room for improvement. Review each of the 12 GAC principles systematically, focusing particularly on principles with low subsection scores. Common improvement opportunities include implementing energy-saving instrumentation, establishing waste management procedures, and enabling multi-analyte detection [12].
Method Optimization Strategies
Mobile Phase Optimization: Systematically evaluate ethanol-water ratios to balance retention, resolution, and greenness. For apremilast, ethanol/water (65:35, v/v) provided optimal separation with R~f~ = 0.61 ± 0.01 [12]. Other green solvent alternatives like ethyl acetate or acetone in combination with water may be explored for challenging separations.
Sample Preparation Greenness: Extend greenness principles to sample preparation by minimizing solvent volumes, using safer alternatives for dissolution, and implementing recovery/reuse protocols where feasible. The AES, ChlorTox, and AGREEprep tools can specifically assess sample preparation greenness [59].
Energy Consumption Reduction: Consider room-temperature development when possible, and optimize analysis time through method development. While HPTLC is generally energy-efficient compared to HPLC, documentation systems may present opportunities for energy savings.
The comprehensive assessment using AGREE, Analytical Eco-Scale, and ChlorTox tools provides robust validation of the environmental advantages of the HPTLC method for apremilast utilizing an ethanol-water mobile phase. The consistently high scores across all three metrics (AES: 93, ChlorTox: 0.66 g, AGREE: 0.89) demonstrate that analytical methods can maintain high performance while significantly reducing environmental impact [12].
This multi-tool assessment approach offers researchers a standardized framework for evaluating and optimizing the greenness of analytical methods, supporting the broader adoption of Green Analytical Chemistry principles in pharmaceutical analysis. The protocols and interpretation guidelines presented herein facilitate the implementation of these assessment tools across various analytical techniques and applications.
This application note provides a detailed comparative analysis of Reversed-Phase High-Performance Thin-Layer Chromatography (RP-HPTLC) and Normal-Phase High-Performance Thin-Layer Chromatography (NP-HPTLC) for the quantification of apremilast (APM) in pharmaceutical products. With increasing emphasis on green analytical chemistry principles, this study demonstrates the superior performance and environmental profile of RP-HPTLC utilizing ethanol-water mobile phases compared to conventional NP-HPTLC methods employing toxic organic solvents. The protocols, validation data, and greenness assessment presented herein support the adoption of greener analytical methods for pharmaceutical quality control while maintaining excellent analytical performance.
Apremilast, a phosphodiesterase-4 inhibitor approved for psoriatic arthritis and plaque psoriasis, presents analytical challenges due to its poor aqueous solubility and low permeability [12] [29]. Effective analytical methods are crucial for pharmaceutical analysis of APM in bulk drugs, formulations, and biological fluids. Traditional normal-phase HPTLC methods often utilize environmentally hazardous solvents, creating a need for greener alternatives that align with the principles of green analytical chemistry (GAC) [20] [61].
RP-HPTLC employing ethanol-water mobile phases represents a promising green alternative to conventional NP-HPTLC methods. This comprehensive analysis compares both approaches using multiple greenness assessment tools including Analytical Eco-Scale (AES), ChlorTox, and AGREE metrics, providing researchers with validated protocols for sustainable pharmaceutical analysis of APM [6] [12].
Experimental Design and Materials
Research Reagent Solutions and Essential Materials
Table 1: Essential materials and reagents for APM HPTLC analysis
| Item | Specification | Function/Application |
|---|---|---|
| HPTLC Plates | RP-18 silica gel 60 F254S, 20 × 10 cm [6] | Stationary phase for RP-HPTLC |
| HPTLC Plates | Silica gel 60 F254, 20 × 10 cm [31] | Stationary phase for NP-HPTLC |
| Apremilast Standard | Pharmaceutical secondary standard [12] | Reference standard for quantification |
| Ethanol | Chromatography grade [6] | Green solvent for mobile phase |
| Water | Milli-Q quality [6] | Green solvent for mobile phase |
| Methanol | Chromatography grade [31] | Sample preparation and NP-HPTLC mobile phase component |
| Chloroform | Analytical grade [61] | Sample dissolution |
| Toluene | Analytical grade [31] | NP-HPTLC mobile phase component |
| Ethyl Acetate | Analytical grade [31] | NP-HPTLC mobile phase component |
| HPTLC Instrumentation | CAMAG system with ADC2, Linomat 5, TLC Scanner 3 [26] | Automated sample application, development, and detection |
Instrumentation and Analytical Conditions
The HPTLC analysis should be performed using a standardized system comprising an automatic developing chamber (ADC2), automatic TLC sampler (Linomat 5), and TLC scanner equipped with deuterium and tungsten lamps [26]. Key instrumental parameters include:
- Sample Application: 8 mm band width, application rate of 150 nL/s
- Development: Linear ascending mode to 80 mm migration distance
- Chamber Saturation: 25-30 min at 22°C with mobile phase vapor
- Detection: Densitometric scanning at 238 nm in reflectance-absorbance mode
- Slit Dimensions: 8 × 0.1 mm, scanning speed of 100 nm/s [26]
Comparative Methodologies
RP-HPTLC Method Protocol for Apremilast
Step 1: Mobile Phase Preparation
- Prepare ethanol-water mixture in ratio 65:35 (v/v) [6]
- Mix thoroughly and degas by sonication for 10 min
Step 2: Standard Solution Preparation
- Accurately weigh 10 mg APM reference standard
- Dissolve in methanol and dilute to 10 mL (1000 μg/mL stock solution)
- Prepare working standards in concentration range 100-700 ng/band [6]
Step 3: Sample Preparation
- For tablets: Powder and extract equivalent to 10 mg APM in chloroform
- For nanoformulations: Disperse equivalent to 10 mg APM in chloroform
- Dilute with mobile phase, filter, and sonicate [61]
Step 4: Chromatographic Procedure
- Apply samples as 8 mm bands on RP-18 F254S HPTLC plates
- Develop in ADC2 chamber pre-saturated with mobile phase vapor for 25 min
- Develop to 80 mm migration distance at 22°C [6]
- Dry plates and scan at 238 nm
Step 5: Quantification
- Identify APM by comparing Rf values with standard (Rf = 0.61 ± 0.01)
- Construct calibration curve (100-700 ng/band)
- Calculate content using regression equation [6]
NP-HPTLC Method Protocol for Apremilast
Step 1: Mobile Phase Preparation
- Prepare toluene-methanol-ethyl acetate in ratio 7:2:1 (v/v/v) [31]
- Alternative: chloroform-methanol combinations (e.g., 85:15 v/v) [20]
Step 2: Standard and Sample Preparation
- Follow same procedure as RP-HPTLC method
Step 3: Chromatographic Procedure
- Apply samples on silica gel 60 F254 HPTLC plates
- Develop in twin-trough chamber with NP mobile phase
- Alternative migration distance: 70 mm [31]
- Dry plates and scan at 241 nm
Step 4: Quantification
- Identify APM by Rf value (typically 0.4-0.6 in NP systems)
- Construct calibration curve and calculate content [31]
Figure 1: Generalized HPTLC analytical workflow for apremilast quantification
Results and Comparative Analysis
Chromatographic Performance Comparison
Table 2: Comparative chromatographic parameters for APM analysis
| Parameter | RP-HPTLC Method | NP-HPTLC Method |
|---|---|---|
| Stationary Phase | RP-18 silica gel 60 F254S [6] | Silica gel 60 F254 [31] |
| Mobile Phase | Ethanol-water (65:35, v/v) [6] | Toluene-methanol-ethyl acetate (7:2:1, v/v/v) [31] |
| Retention Factor (Rf) | 0.61 ± 0.01 [6] | Varies with mobile phase (typically 0.4-0.6) [31] |
| Linearity Range | 100-700 ng/band [6] | Dependent on method optimization |
| Detection | 238 nm [6] | 241 nm [31] |
| Theoretical Plates | Higher efficiency [20] | Lower efficiency compared to RP [20] |
| Tailing Factor | Lower tailing (better peak symmetry) [20] | Higher tailing potential [20] |
Validation Parameters Comparison
Table 3: Method validation parameters comparison
| Validation Parameter | RP-HPTLC Results | NP-HPTLC Results |
|---|---|---|
| Linearity (R²) | >0.999 [6] | >0.999 [31] |
| Precision (% RSD) | 0.46-0.86% [61] | Similar ranges achievable |
| Accuracy (% Recovery) | 97.97-101.60% [6] [61] | 98-102% typically reported |
| LOD | 18.45 ng/band (for similar methods) [61] | Comparable values achievable |
| LOQ | 55.35 ng/band (for similar methods) [61] | Comparable values achievable |
| Robustness | High [62] | Moderate to high [31] |
| Assay Results | Tablets: 98.40%, NPs: 101.60% [6] | Consistent with label claim [31] |
Greenness Assessment Comparison
Table 4: Environmental impact assessment using multiple greenness metrics
| Greenness Metric | RP-HPTLC with Ethanol-Water | NP-HPTLC with Traditional Solvents |
|---|---|---|
| Analytical Eco-Scale (AES) | 93 (Excellent) [6] | Lower scores due to hazardous solvents [20] |
| ChlorTox | 0.66 g (Lower environmental impact) [6] | Higher values due to chlorinated solvents [20] |
| AGREE Score | 0.89 (Excellent greenness) [6] | Lower scores (0.6-0.7 range) [20] |
| NEMI Profile | All four quadrants green [62] | Varies, often not all green [20] |
| Solvent Toxicity | Low (ethanol and water are green solvents) [12] | High (toluene, chloroform, ethyl acetate are hazardous) [20] |
| Waste Generation | Lower environmental impact [61] | Higher environmental impact [20] |
Figure 2: Greenness assessment comparison between RP-HPTLC and NP-HPTLC methods
Discussion
Analytical Performance Considerations
The RP-HPTLC method demonstrates several advantages in analytical performance for APM quantification. The reversed-phase system with ethanol-water mobile phase provides excellent peak symmetry with lower tailing factors compared to normal-phase systems [20]. The reported theoretical plates per meter were significantly higher in RP-HPTLC (up to 4652 N/m) compared to NP-HPTLC (up to 4472 N/m) in comparative studies of similar compounds, indicating superior separation efficiency [20].
The linearity range of 100-700 ng/band for RP-HPTLC covers therapeutically relevant concentrations for APM formulations [6]. The method demonstrates excellent precision with % RSD values below 1% for both repeatability and intermediate precision, meeting regulatory requirements for pharmaceutical analysis [61]. Accuracy, as determined by recovery studies, ranges between 97.97-101.60%, well within acceptable limits for drug quantification [6] [61].
Green Chemistry Advantages
The greenness assessment using multiple metrics consistently demonstrates the environmental superiority of RP-HPTLC with ethanol-water mobile phases. The AES score of 93/100 reflects minimal environmental impact, with deductions mainly related to energy consumption and waste production [6]. The ChlorTox value of 0.66 g indicates low chlorine-related toxicity, while the AGREE score of 0.89/1.0 confirms excellent alignment with all twelve principles of green analytical chemistry [6].
In contrast, NP-HPTLC methods typically utilize more hazardous solvents like toluene, chloroform, and ethyl acetate, which result in lower greenness scores across all assessment metrics [20] [31]. The environmental impact of these traditional solvents extends beyond immediate toxicity to include waste disposal challenges and higher carbon footprints [20].
Practical Implementation in Pharmaceutical Analysis
The application of RP-HPTLC for APM analysis in various pharmaceutical formulations demonstrates its practical utility. Successful quantification has been reported in marketed tablets, polymeric nanoparticles, and nanoemulsions with assay results of 98.40%, 101.60%, and 99.37% respectively [6]. The method's robustness makes it suitable for quality control laboratories, with minimal impact from small variations in experimental parameters [62].
For nanoformulations specifically, the RP-HPTLC method offers advantages in analyzing complex delivery systems without extensive sample clean-up, saving time and resources while maintaining accuracy [6] [61]. The ability to analyze multiple samples simultaneously on a single HPTLC plate further enhances efficiency for routine analysis [26].
This comprehensive comparative analysis demonstrates that RP-HPTLC using ethanol-water mobile phases provides an environmentally sustainable alternative to conventional NP-HPTLC for apremilast quantification, without compromising analytical performance. The greenness assessment using AES, ChlorTox, and AGREE metrics consistently confirms the superior environmental profile of the RP-HPTLC method.
The detailed protocols presented herein enable researchers and pharmaceutical analysts to implement this greener approach for routine quality control of apremilast in various formulations. The adoption of such environmentally responsible analytical methods aligns with broader sustainability goals in pharmaceutical development and manufacturing while maintaining the high standards required for regulatory compliance.
Future work should focus on expanding the application of green HPTLC methods to other pharmaceutical compounds and exploring even more sustainable alternatives to further reduce the environmental impact of pharmaceutical analysis.
The development of greener analytical methods has become increasingly crucial in pharmaceutical analysis, aligning with the principles of green analytical chemistry (GAC) to minimize environmental impact. High-performance thin-layer chromatography (HPTLC) offers several advantages for this purpose, including low solvent consumption, minimal sample preparation, and the ability to analyze multiple samples simultaneously [20] [14]. This application note summarizes the development, validation, and greenness assessment of a reversed-phase HPTLC (RP-HPTLC) method for the quantification of apremilast (APM) in pharmaceutical formulations using an ethanol-water mobile phase. The method provides an eco-friendly alternative to conventional normal-phase HPTLC methods that typically employ more hazardous solvents.
Experimental Protocols
Materials and Reagents
- Apremilast standard: Reference standard of known purity (99%)
- Stationary phase: RP-18 silica gel 60 F254S HPTLC plates
- Solvents: Ethanol (LC-grade) and ultra-pure water obtained from Milli-Q system
- Commercial samples: APM tablets (e.g., Otezla), nanoformulations
- Equipment: HPTLC system (CAMAG) with ATS4 sample applicator, automatic development chamber, and TLC scanner [6] [12]
Chromatographic Conditions
- Mobile phase: Ethanol/water (65:35, v/v) as greener eluent system [6] [12]
- Detection wavelength: 238 nm (λmax for APM) [6]
- Application volume: 10 µL as bands (6 mm width)
- Development distance: 8 cm
- Chamber saturation: 30 minutes at 22°C [12]
- Scanning speed: 20 mm/s with slit dimensions of 4 × 0.45 mm² [12]
Sample Preparation
Standard Solution Preparation
A stock solution of APM (100 µg/mL) was prepared by dissolving 10 mg of reference standard in 100 mL of mobile phase. Working solutions were prepared by appropriate dilution of the stock solution with the same solvent system to obtain concentrations in the range of 100-700 ng/band [6].
Pharmaceutical Formulation Preparation
For commercial tablets, an accurately weighed amount equivalent to 10 mg of APM was transferred to a volumetric flask, dissolved in mobile phase, and sonicated for 15 minutes. The solution was filtered, and suitable dilutions were made to obtain concentrations within the working range [6].
Method Validation
The method was validated according to International Council for Harmonisation (ICH) Q2(R2) guidelines for the following parameters [6] [12]:
Specificity
Specificity was demonstrated by comparing the chromatograms of standard APM with those obtained from pharmaceutical formulations. The method effectively separated APM from formulation excipients, with a single band at Rf = 0.61 ± 0.01 for APM in all samples [6].
Linearity and Range
Linearity was evaluated over the concentration range of 100-700 ng/band. The calibration curve was constructed by plotting peak area against concentration, with six replicate measurements (n=6) at each concentration level [6].
Accuracy
Accuracy was assessed using the standard addition method at three concentration levels (50%, 100%, and 150% of the target concentration). The percentage recovery was calculated for each level [6].
Precision
Both intra-day (repeatability) and inter-day (intermediate precision) variations were evaluated. Intra-day precision was determined by analyzing quality control samples at three concentrations six times on the same day. Inter-day precision was assessed by analyzing the same samples over three consecutive days [6].
Robustness
Robustness was examined by making deliberate, slight variations to mobile phase composition (±2%) and development conditions. The effects on retardation factor (Rf) and peak area were recorded [12].
Sensitivity
Sensitivity was expressed as limit of detection (LOD) and limit of quantification (LOQ), calculated based on the standard deviation of the response and the slope of the calibration curve [12].
Results and Discussion
Table 1: Summary of Validation Parameters for the RP-HPTLC Method for Apremilast
| Validation Parameter | Results | Acceptance Criteria |
|---|---|---|
| Linearity range | 100-700 ng/band | - |
| Retardation factor (Rf) | 0.61 ± 0.01 | - |
| Accuracy (% Recovery) | ||
| Tablet formulation | 98.40% | 98-102% |
| Nanoparticle formulation | 101.60% | 98-102% |
| Nanoemulsion | 99.37% | 98-102% |
| Precision (% RSD) | ||
| Intra-day | <2% | ≤2% |
| Inter-day | <2% | ≤2% |
| Robustness | Robust with minor changes in mobile phase composition | RSD <2% |
| Sensitivity | ||
| LOD | Adequately sensitive | Based on signal-to-noise ratio |
| LOQ | Adequately sensitive | Based on signal-to-noise ratio |
The validation results demonstrated that the proposed RP-HPTLC method is linear, accurate, precise, and robust for the quantification of APM in various pharmaceutical formulations. The method showed excellent recovery rates ranging from 98.40% to 101.60% for different formulations, well within the acceptable limits of 98-102% [6]. The precision of the method, expressed as relative standard deviation (RSD), was less than 2% for both intra-day and inter-day variations, indicating high reproducibility [6].
Greenness Assessment
The greenness of the proposed method was evaluated using three different assessment tools: Analytical Eco-Scale (AES), ChlorTox, and Analytical GREEnness (AGREE). The results demonstrated an outstanding greener profile for the method [6].
Table 2: Greenness Assessment Scores for the RP-HPTLC Method
| Greenness Assessment Tool | Score | Interpretation |
|---|---|---|
| Analytical Eco-Scale (AES) | 93 | Excellent greenness |
| ChlorTox | 0.66 g | Lower environmental impact |
| AGREE | 0.89 | Excellent greenness |
The AES score of 93 (out of a possible 100) indicates excellent greenness, as scores above 75 are considered excellent green methods [6]. The ChlorTox value of 0.66 g represents a lower environmental impact compared to methods using chlorinated solvents [6]. The AGREE score of 0.89 (on a 0-1 scale, where 1 represents ideal greenness) further confirms the excellent environmental profile of the method [6].
Comparative Greenness with NP-HPTLC
The greenness of the RP-HPTLC method using ethanol-water mobile phase was compared with normal-phase HPTLC (NP-HPTLC) methods that typically employ more hazardous solvents like chloroform-methanol mixtures [20].
Table 3: Comparison Between NP-HPTLC and Greener RP-HPTLC Approaches
| Parameter | NP-HPTLC | RP-HPTLC |
|---|---|---|
| Typical mobile phase | Chloroform-methanol (85:15 v/v) | Ethanol-water (65:35 v/v) |
| Toxicity | High (chlorinated solvents) | Low |
| Environmental impact | High | Low |
| Waste disposal | Requires special handling | Easier disposal |
| Theoretical plates per meter (N/m) | 4472 ± 4.22 | Comparable efficiency |
The RP-HPTLC method was found to be more environmentally friendly while maintaining comparable chromatographic efficiency to NP-HPTLC methods [20]. The replacement of hazardous chlorinated solvents with greener alternatives like ethanol-water mixtures significantly reduces the environmental impact of the analytical method without compromising performance.
The Scientist's Toolkit
Table 4: Essential Research Reagent Solutions for Greener HPTLC Method Development
| Reagent/Material | Function | Green Alternative |
|---|---|---|
| RP-18 silica gel 60 F254S HPTLC plates | Stationary phase for reversed-phase separation | - |
| Ethanol (LC-grade) | Green solvent for mobile phase | Replaces toxic solvents like chloroform or acetonitrile |
| Ultra-pure water | Green solvent for mobile phase | - |
| Ethyl acetate | Green solvent alternative | Lower toxicity compared to chlorinated solvents |
| Acetone | Green solvent for mobile phase | Lower toxicity compared to chlorinated solvents [63] |
Workflow and Signaling Pathways
HPTLC Method Workflow: The diagram illustrates the comprehensive workflow for developing and validating the green RP-HPTLC method for apremilast, highlighting the key components including the ethanol-water mobile phase, RP-18 stationary phase, validation parameters, greenness assessment tools, and pharmaceutical applications.
The developed RP-HPTLC method using ethanol-water (65:35, v/v) as mobile phase provides a green, reliable, and cost-effective analytical approach for the quantification of apremilast in pharmaceutical formulations. The method was successfully validated according to ICH guidelines, demonstrating excellent linearity, accuracy, precision, and robustness. The greenness assessment using three different tools (AES, ChlorTox, and AGREE) confirmed the environmental friendliness of the method, with outstanding scores of 93, 0.66 g, and 0.89, respectively. The method was successfully applied to the analysis of APM in commercial tablets, nanoparticle formulations, and nanoemulsions, with recovery rates ranging from 98.40% to 101.60%. This green analytical approach aligns with the principles of green analytical chemistry and offers a sustainable alternative for routine analysis of APM in quality control laboratories.
Conclusion
The developed RP-HPTLC method for Apremilast, utilizing an ethanol-water mobile phase, successfully fulfills the core objectives of modern pharmaceutical analysis. It provides a specific, linear, precise, and accurate tool for quantifying Apremilast in various formulations, as confirmed by rigorous validation. The application of AQbD principles ensures method robustness and a well-understood operational design space. Crucially, the method's outstanding greenness profile, validated by multiple assessment tools, establishes it as an environmentally sustainable choice. This method is highly suitable for routine quality control and stability studies in industrial settings. Future directions include extending this green approach to the analysis of Apremilast in biological fluids and applying the framework to develop similar eco-friendly methods for other pharmaceuticals, thereby advancing the field of green analytical chemistry in biomedical research.
References
- 1. Apremilast - StatPearls - NCBI Bookshelf - NIH [https://www.ncbi.nlm.nih.gov/books/NBK572078/]
- 2. Apremilast (oral route) - Side effects & dosage [https://www.mayoclinic.org/drugs-supplements/apremilast-oral-route/description/drg-20095277]
- 3. Otezla® (apremilast) Healthcare Professional (HCP) Website [https://www.otezlapro.com/]
- 4. How Otezla® (apremilast) Works | Plaque Psoriasis (PsO) [https://www.otezla.com/plaque-psoriasis/how-otezla-works]
- 5. Apremilast [https://lktlabs.com/product/apremilast/]
- 6. A greener RP-HPTLC-densitometry method for the ... [https://www.sciencedirect.com/science/article/pii/S187853522301033X]
- 7. a-greener-rp-hptlc-densitometry-method-for-the- ... [https://www.bohrium.com/paper-details/a-greener-rp-hptlc-densitometry-method-for-the-quantification-of-apremilast-in-nanoformulations-and-commercial-tablets-greenness-assessment-by-analytical-eco-scale-chlortox-and-agree-methods/945548578980364349-3435]
- 8. Hptlc presentation ppt | PPTX [https://www.slideshare.net/slideshow/hptlc-presentation-ppt/72213924]
- 9. Comparative study of Normal-phase versus ... - BMC Chemistry [https://bmcchem.biomedcentral.com/articles/10.1186/s13065-025-01439-9]
- 10. Mass Confirmation of Cannabinoids in Cannabis sativa by ... [https://www.waters.com/nextgen/us/en/library/application-notes/2017/mass-confirmation-of-cannabinoids-in-cannabis-sativa-by-using-hptlc-qda.html?srsltid=AfmBOoqriHaXwhxQ-XU30NAYSiw8xcDBzWJIXJn-vKmg52s_2cqzpoOe]
- 11. High Performance Thin Layer Chromatography HPTLC BY ... [https://www.scribd.com/presentation/567411291/HPTLC]
- 12. A greener RP- HPTLC -densitometry method for the quantification of... [https://arabjchem.org/a-greener-rp-hptlc-densitometry-method-for-the-quantification-of-apremilast-in-nanoformulations-and-commercial-tablets-greenness-assessment-by-analytical-eco-scale-chlortox-and-agree-methods/]
- 13. Green analytical chemistry metrics for evaluating the ... [https://pmc.ncbi.nlm.nih.gov/articles/PMC11697060/]
- 14. Recent application of green analytical chemistry: eco-friendly ... [https://fjps.springeropen.com/articles/10.1186/s43094-024-00658-6]
- 15. A validated HPTLC method for quantitative analysis of ... [https://www.sciencedirect.com/science/article/pii/S1674638420300253]
- 16. Method Validation in High-Performance Thin Layer ... [https://www.eurofinsus.com/food-testing/resources/method-validation-in-hptlc-methods-for-food-and-supplements/]
- 17. Potential of green solvents as mobile phases in liquid ... [https://www.sciencedirect.com/science/article/abs/pii/S002196732500158X]
- 18. Development of a green and rapid ethanol-based HPLC ... [https://www.degruyterbrill.com/document/doi/10.1515/gps-2024-0200/html?srsltid=AfmBOop-5WY9_ACsKko2JIjAxepxYxAYiOK6t5DaQQ0HMY5sNfe9K-RD]
- 19. Green solvents and their role in modern sample ... [https://link.springer.com/article/10.1007/s44371-025-00325-6]
- 20. Comparing the Greenness and Validation Metrics of ... [https://pmc.ncbi.nlm.nih.gov/articles/PMC11137692/]
- 21. A Retrospective Analysis of Apremilast Use in the British ... [https://pmc.ncbi.nlm.nih.gov/articles/PMC11971085/]
- 22. Efficacy and Safety of Apremilast Over 52 Weeks in ... [https://link.springer.com/article/10.1007/s13555-025-01389-z]
- 23. Analytical Method of Apremilast: A Review [https://jddtonline.info/index.php/jddt/article/view/3144]
- 24. Analytical Method of Apremilast: A Review [https://ajpaonline.com/HTMLPaper.aspx?Journal=Asian%20Journal%20of%20Pharmaceutical%20Analysis;PID=2020-10-1-10]
- 25. Apremilast Alters Behavioral Responses to Ethanol in Mice [https://pmc.ncbi.nlm.nih.gov/articles/PMC5915912/]
- 26. Dual-platform integration of HPTLC and firefly algorithm ... [https://pmc.ncbi.nlm.nih.gov/articles/PMC12345108/]
- 27. Alcohol-based solvents as mobile phases for LC-MS ... [https://www.sciencedirect.com/science/article/abs/pii/S0731708525002201]
- 28. Green stability-indicating RP-HPTLC approach for ... [https://bmcchem.biomedcentral.com/articles/10.1186/s13065-025-01431-3]
- 29. Analytical Methods for Determination of Apremilast from ... [https://pubmed.ncbi.nlm.nih.gov/32024370/]
- 30. A High-Performance Thin Layer Chromatography (HPTLC ... [https://pmc.ncbi.nlm.nih.gov/articles/PMC4670047/]
- 31. DoE based failure mode effect analysis (FMEA) to ... [https://link.springer.com/article/10.1007/s42452-020-2890-1]
- 32. HPTLC Instruments for Qualitative and Quantitative Analyses [https://camag.com/products/hptlc/]
- 33. How to Prepare Mobile Phases - Solvent Mixture Ratios [https://www.shimadzu.com/an/service-support/technical-support/analysis-basics/lib/lctalk/28/28intro.html]
- 34. Validation of Stability Indicating Method and Degradation ... [https://jddtonline.info/index.php/jddt/article/view/3964]
- 35. Modern Trends and Best Practices in Mobile-Phase ... [https://www.chromatographyonline.com/view/modern-trends-and-best-practices-mobile-phase-selection-reversed-phase-chromatography-0]
- 36. Development and Validation of a Quantitative Analysis ... [https://www.mdpi.com/2297-8739/11/7/207]
- 37. Mobile and Stationary Phases in Chromatography Explained [https://www.pharmanow.live/pharma-manufacturing/mobile-stationary-phase-chromatography]
- 38. High Performance Thin Layer Chromatography (HPTLC ... [https://pmc.ncbi.nlm.nih.gov/articles/PMC11357029/]
- 39. High-Performance Thin-Layer Chromatography (HPTLC ... [https://www.mdpi.com/2227-9717/10/2/394]
- 40. Exploring the Synergy Between HPTLC and HPLC-DAD for ... [https://www.mdpi.com/1420-3049/24/19/3416]
- 41. HPLC-MS standardization and validation methods for ... [https://www.sciencedirect.com/science/article/pii/S2405844025003433]
- 42. High-performance thin-layer chromatography [https://en.wikipedia.org/wiki/High-performance_thin-layer_chromatography]
- 43. How HPTLC Works: A Guide for Researchers at the Bench [https://bitesizebio.com/47784/hptlc-basics-and-instrumentation/]
- 44. visionCATS Guide [https://visioncats-doc.camag.com/401/VisionCatsGuide/VisionCatsGuide.html]
- 45. Analytical Quality by Design (AQbD) Approach to the ... [https://pmc.ncbi.nlm.nih.gov/articles/PMC9026520/]
- 46. Process optimization and degradation pathway elucidation [https://www.sciencedirect.com/science/article/abs/pii/S0731708516311955]
- 47. Design of experiment avenue for development and validation ... [https://jast-journal.springeropen.com/articles/10.1186/s40543-019-0170-8]
- 48. Development and Validation of HPTLC Method for the ... [https://pmc.ncbi.nlm.nih.gov/articles/PMC2865822/]
- 49. High-performance Thin-layer Chromatography Method ... [https://pmc.ncbi.nlm.nih.gov/articles/PMC5004512/]
- 50. Response Surface Methodology (RSM) in Design of ... [https://www.6sigma.us/six-sigma-in-focus/response-surface-methodology-rsm/]
- 51. Troubleshooting Thin Layer Chromatography: Some TLC ... [https://bitesizebio.com/28553/troubleshooting-thin-layer-chromatography-tlc-tlc/]
- 52. Application to Pharmacokinetic Study in Rats - PubMed Central [https://pmc.ncbi.nlm.nih.gov/articles/PMC7175235/]
- 53. Q2(R1) Validation of Analytical Procedures: Text and ... [https://www.fda.gov/regulatory-information/search-fda-guidance-documents/q2r1-validation-analytical-procedures-text-and-methodology-guidance-industry]
- 54. Development of a Validated High-Performance Thin-Layer ... [https://www.mdpi.com/1420-3049/30/19/3859]
- 55. Development and Validation of a Stability-Indicating ... [https://pmc.ncbi.nlm.nih.gov/articles/PMC12388184/]
- 56. Remdesivir, favipiravir and Molnupiravir: trichromatic ... [https://pmc.ncbi.nlm.nih.gov/articles/PMC11954355/]
- 57. Dual-platform integration of HPTLC and firefly algorithm ... [https://bmcchem.biomedcentral.com/articles/10.1186/s13065-025-01598-9]
- 58. Process optimization and degradation pathway elucidation [https://pubmed.ncbi.nlm.nih.gov/28454058/]
- 59. Green analytical chemistry metrics for evaluating the ... [https://www.sciencedirect.com/science/article/pii/S2095177924001102]
- 60. greenness assessment of HPLC methods for paclitaxel [https://link.springer.com/article/10.1007/s44371-025-00166-3]
- 61. Ecofriendly densitometric RP-HPTLC method for ... [https://pmc.ncbi.nlm.nih.gov/articles/PMC9048746/]
- 62. Contrasting the validation parameters and greenness of ... [https://www.sciencedirect.com/science/article/pii/S1878535224002399]
- 63. Green stability-indicating RP-HPTLC technique for determi... [https://www.degruyterbrill.com/document/doi/10.1515/gps-2024-0107/html?srsltid=AfmBOoqpoUwuEW5Xek740V23BCS3hr2y5KxGu2XQUhciwEl47dBpLaIg]