A Practical Guide to Determining LSER Solute Descriptors for Drug Discovery and Biomolecular Research
This article provides a comprehensive protocol for determining Linear Solvation Energy Relationship (LSER) solute descriptors, a critical tool for predicting solute partitioning and biomolecular interactions.
A Practical Guide to Determining LSER Solute Descriptors for Drug Discovery and Biomolecular Research
Abstract
This article provides a comprehensive protocol for determining Linear Solvation Energy Relationship (LSER) solute descriptors, a critical tool for predicting solute partitioning and biomolecular interactions. Tailored for researchers and drug development professionals, it covers the foundational theory of the Abraham solvation parameter model, details established and emerging computational methods for descriptor determination, and offers strategies for troubleshooting and validating results. By integrating traditional thermodynamics with modern machine learning approaches, this guide serves as a vital resource for accelerating solvent selection, predicting pharmacokinetic properties, and enabling rational design in chemical and pharmaceutical development.
Understanding LSER Fundamentals: The Abraham Solvation Parameter Model and Its Six Key Descriptors
Linear Solvation Energy Relationships (LSERs) represent a powerful quantitative approach for predicting the partitioning behavior and solubility of chemical compounds. Evolving from early solvent polarity scales, the LSER framework, formalized by Abraham, uses a set of solute-specific descriptors to model and predict complex physicochemical properties across diverse biological and environmental systems. This makes LSERs an indispensable tool for researchers in drug development and environmental chemistry, enabling robust predictions of a molecule's behavior without exhaustive laboratory experimentation for every new compound.
Theoretical Foundation: The LSER Equation
The predictive power of LSERs is encapsulated in a multiple linear regression equation that relates a free-energy related property (e.g., log of a partition coefficient) to fundamental molecular interactions:
SP = c + eE + sS + aA + bB + vV
The following table defines the descriptors and system constants in the LSER model:
Table 1: Components of the Abraham LSER Equation
| Symbol | Type | Description | Represents |
|---|---|---|---|
| SP | Dependent Variable | Solute Property | The log of a measured property (e.g., log K) |
| c | System Constant | Regression Constant | System-specific intercept |
| E | Solute Descriptor | Excess Molar Refractivity | The solute's ability to interact via π- and n-electron pairs |
| S | Solute Descriptor | Dipolarity/Polarizability | The solute's dipole moment and polarizability |
| A | Solute Descriptor | Overall Hydrogen-Bond Acidity | The solute's ability to donate a hydrogen bond |
| B | Solute Descriptor | Overall Hydrogen-Bond Basicity | The solute's ability to accept a hydrogen bond |
| V | Solute Descriptor | McGowan's Characteristic Volume | The solute's molecular size |
| e, s, a, b, v | System Constants | System Coefficients | Quantify the system's sensitivity to each interaction |
Experimental Protocols for Determining Solute Descriptors
Determining the five solute descriptors (E, S, A, B, V) requires a combination of experimental measurements and computational methods. The following protocols outline the standard methodologies.
Protocol 3.1: Determination of Descriptor V (McGowan's Characteristic Volume)
Principle: The McGowan Characteristic Volume is calculated from the molecular structure and represents the size of the molecule, which influences cavity formation in the solvent.
Materials:
- Software: Molecular modeling software (e.g., Avogadro, ChemDraw) or a standardized calculation spreadsheet.
- Data: Molecular structure and table of atomic volumes.
Procedure:
- Draw Molecular Structure: Create a precise 2D or 3D model of the solute molecule.
- Sum Atomic Volumes: Calculate the volume by summing the characteristic volumes for all atoms in the molecule. Standard values are available in the literature (e.g., carbon = 16.35, hydrogen = 8.71, oxygen = 12.43 cm³/molˣ10⁻²).
- Apply Correction: Subtract 6.56 cm³/molˣ10⁻² for each single bond in the molecule. This accounts for the overlap between connected atoms.
- Record Value: The result is the V descriptor. It is a unitless, characteristic volume.
Protocol 3.2: Determination of Descriptor E (Excess Molar Refractivity)
Principle: The E descriptor is derived from the measured refractive index of the solute and indicates its polarizability.
Materials:
- Instrument: Refractometer.
- Reagents: Solute of high purity, standard solvent (if measurement is not done on neat liquid).
Procedure:
- Calibrate Instrument: Calibrate the refractometer with a standard, such as deionized water.
- Measure Refractive Index: If the solute is a liquid at room temperature, measure its refractive index (n_D) directly. For solids, measure the refractive index of a solution and extrapolate.
- Calculate Molar Refraction: Compute the molar refraction (R) using the Lorentz-Lorenz equation: ( R = \frac{(nD^2 - 1)}{(nD^2 + 2)} \times MW / density ).
- Calculate E Descriptor: The E descriptor is the molar refraction of the solute, normalized by 10 and subtracted by the molar refraction of an alkane of the same volume: ( E = (R{solute} - R{alkane}) / 10 ).
Protocol 3.3: Determination of Descriptors S, A, and B via Gas-Chromatographic (GC) Method
Principle: Descriptors S (dipolarity), A (hydrogen-bond acidity), and B (hydrogen-bond basicity) are determined by measuring gas-liquid partition coefficients (log K) on multiple stationary phases with characterized LSER system constants.
Materials:
- Equipment: Gas Chromatograph with Flame Ionization Detector (FID).
- Columns: A set of at least 6-8 different capillary GC columns with known LSER system constants (e.g., squalane, OV-225, Triton X-305).
- Reagents: Solute of interest, inert gas (e.g., methane) for dead time measurement, high-purity solvents for dilution.
Procedure:
- Prepare Solute Solution: Dissolve the solute in a volatile solvent to create a dilute injection solution.
- Measure Retention Times:
- For each column, inject the solute and an unretained marker (e.g., methane).
- Record the retention time of the solute (tR) and the unretained marker (tM).
- Calculate Partition Coefficient:
- Calculate the specific retention volume, ( Vg ).
- The gas-liquid partition coefficient is log K = log(Vg).
- Perform Multivariate Regression:
- Compile the log K values measured on all columns.
- Using a statistical software package, perform a multiple linear regression of the measured log K values against the known system constants (e, s, a, b, l) for each column.
- The regression will yield the solute's descriptors S, A, and B as the fitted coefficients.
Table 2: Research Reagent Solutions for LSER Descriptor Determination
| Item | Function/Application |
|---|---|
| Gas Chromatograph with FID | Primary instrument for measuring gas-liquid partition coefficients for determining S, A, and B descriptors. |
| Diverse GC Stationary Phases | A set of columns with different polarities and interaction properties (e.g., Squalane, OV-225) to probe specific solute-solvent interactions [1]. |
| Refractometer | Measures the refractive index of a solute, which is essential for calculating the E descriptor (Excess Molar Refractivity). |
| Molecular Modeling Software | Used to construct and visualize molecular structures for the calculation of the V descriptor (McGowan's Characteristic Volume). |
| UFZ-LSER Database | Key computational resource for accessing known descriptor values, system parameters, and performing calculations like biopartitioning and sorbed concentration [1]. |
Application Notes: Calculating Key Properties
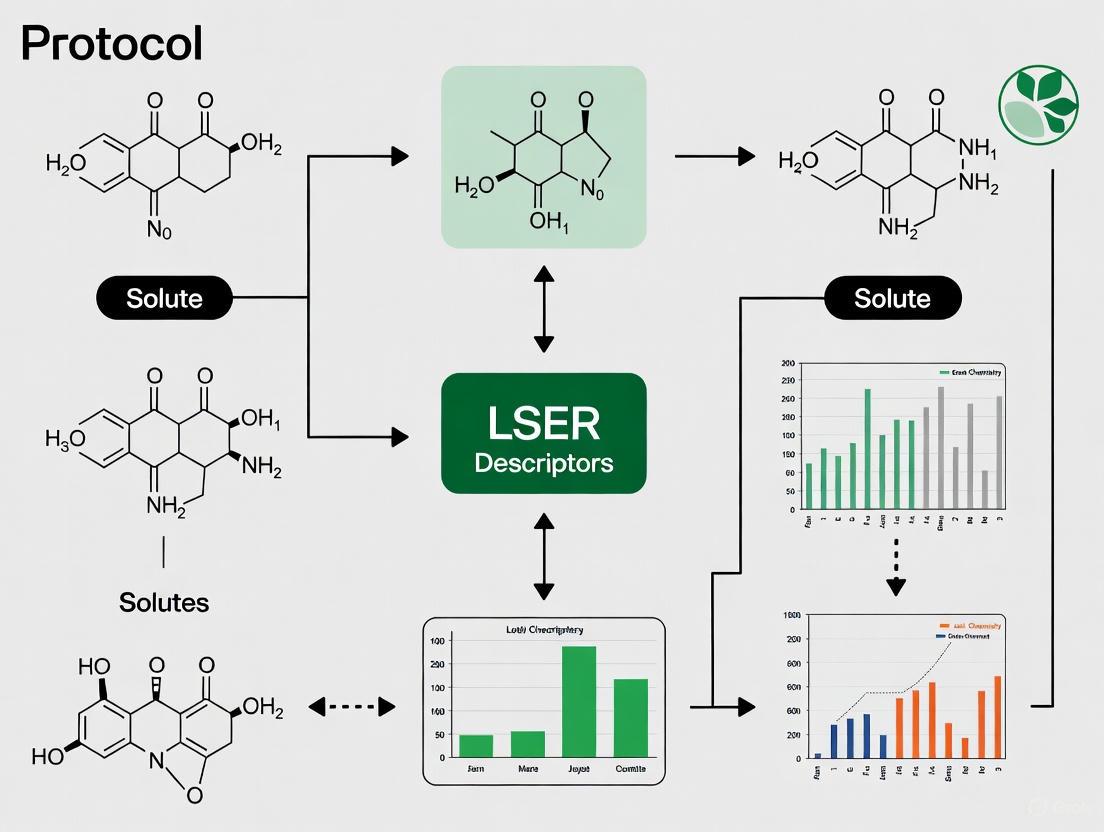
The UFZ-LSER database provides practical tools for applying solute descriptors to predict critical properties in drug development [1]. The workflow for using these tools is outlined below.
LSER Application Workflow
Note 4.1: Calculating Biopartitioning
Purpose: To predict the distribution of a neutral solute within biological compartments (e.g., muscle, fat, storage lipids, proteins).
Procedure:
- Access Tool: Navigate to the "Calculate the biopartitioning" section of the UFZ-LSER database [1].
- Input Composition: Define the volume percentages of key biological phases (e.g., muscle protein, water, lipids, carbohydrates).
- Input Solute Data: Enter the solute's LSER descriptors (E, S, A, B, V).
- Execute Calculation: The tool computes the fraction of solute partitioned into each biological phase based on the system's LSER equation.
Note 4.2: Calculating Permeability through Caco-2/MDCK Monolayers
Purpose: To predict intestinal absorption (Caco-2) or renal/brain barrier permeability (MDCK) for neutral molecules.
Procedure:
- Access Tool: Navigate to the "Calculate the permeability through a Caco-2/MDCK monolayer" module [1].
- Input Solute Data: Enter the solute's LSER descriptors.
- Account for Ionization (if applicable): For ionizable compounds, enter the fraction of neutral species at the experimental pH.
- Execute Calculation: The tool provides a predicted permeability value, which can be exported for further analysis.
Note 4.3: Key Considerations for Accurate Predictions
- Domain of Applicability: The LSER model is primarily validated for neutral chemicals. Predictions for ions or metal complexes may be unreliable [1].
- Descriptor Accuracy: The quality of all predictions is contingent on the accuracy of the input solute descriptors.
- Freely Dissolved Analyte: The "Calculate the concentration of freely dissolved analyte" tool is explicitly marked for neutral molecules only [1].
Data Presentation and Analysis
The following table provides a sample of solute descriptors for common compounds, illustrating how molecular structure influences these values. These data are crucial for understanding and predicting partitioning behavior.
Table 3: Experimental LSER Solute Descriptors for Selected Compounds (from UFZ-LSER Database) [1]
| Compound Name | E | S | A | B | V |
|---|---|---|---|---|---|
| Benzene | 0.610 | 0.520 | 0.000 | 0.140 | 0.716 |
| Chloroform | 0.425 | 0.490 | 0.150 | 0.020 | 0.616 |
| Ethyl Acetate | 0.106 | 0.620 | 0.000 | 0.450 | 0.784 |
| Aniline | 0.955 | 0.820 | 0.260 | 0.410 | 0.816 |
| Butan-1-ol | 0.224 | 0.420 | 0.370 | 0.480 | 0.730 |
The logical relationship and dependencies between the solute's molecular properties, its experimentally determined descriptors, and the final predicted biological activities are summarized in the following diagram.
LSER Predictive Logic
The Abraham solvation parameter model is a widely adopted linear free energy relationship (LFER) that quantitatively describes the partitioning of solutes between different phases. The model's predictive power resides in six solute descriptors—Vx, L, E, S, A, and B—which encode fundamental aspects of a molecule's interaction potential. These descriptors allow for the prediction of a wide array of physicochemical and biological properties, including partition coefficients, solubility, chromatographic retention, and toxicity. This application note provides a detailed deconstruction of each descriptor, presents validated protocols for their experimental determination, and illustrates their practical application within pharmaceutical and environmental sciences.
The Abraham solvation parameter model defines solute transfer between phases using two primary equations [2]:
For partitioning between two condensed phases:
log P = c + eE + sS + aA + bB + vV (1)
For partitioning between a gas phase and a condensed phase:
log K = c + eE + sS + aA + bB + lL (2)
Here, the uppercase letters (E, S, A, B, V, L) are the solute descriptors, representing intrinsic properties of the solute. The lowercase letters (c, e, s, a, b, v, l) are the system coefficients, characterizing the solvent system or process. The model's versatility allows it to be applied to processes ranging from water-to-solvent partitioning and chromatographic retention to skin permeability and biological activity [2] [3].
Deconstruction of the Solute Descriptors
The six solute descriptors quantitatively capture the key molecular interactions governing solvation and partitioning. Their definitions and physicochemical significance are summarized in the table below.
Table 1: The Six Abraham Solute Descriptors: Definitions and Interpretations
| Descriptor | Full Name | Definition & Interpretation | Molecular Interactions Encoded |
|---|---|---|---|
| V or Vx | McGowan Characteristic Volume | Molecular volume, calculated from atomic contributions and bond counts [4]. Units: (cm³ mol⁻¹)/100. | Size/Cavity Formation: Energy required to create a cavity in the solvent to accommodate the solute. |
| L | Gas-Hexadecane Partition Coefficient | Logarithm of the solute's gas-to-hexadecane partition coefficient at 298 K [4]. | Dispersion Interactions: Solute-solvent dispersion (London) forces in an aliphatic hydrocarbon environment. |
| E | Excess Molar Refractivity | Molar refraction in excess of a hypothetical non-polar, non-π-conjugated alkane of similar size [2]. Units: (cm³ mol⁻¹)/10. | Polarizability from n- and π-electrons: Captures interactions from lone pairs and π-electrons. |
| S | Dipolarity/Polarizability | A combined measure of the solute's ability to stabilize a charge or a dipole [5]. | Dipolarity & Polarizability: solute-solvent interactions via dipole-dipole and dipole-induced dipole forces. |
| A | Overall Hydrogen-Bond Acidity | The solute's effective or summation hydrogen-bond donating ability [5]. | Hydrogen-Bond Donating Ability: Strength of the solute (acid) - solvent (base) hydrogen bonds. |
| B | Overall Hydrogen-Bond Basicity | The solute's effective or summation hydrogen-bond accepting ability [5]. | Hydrogen-Bond Accepting Ability: Strength of the solute (base) - solvent (acid) hydrogen bonds. |
The following diagram illustrates the logical relationship between the descriptors and the molecular properties they represent.
Diagram 1: Molecular interactions captured by Abraham descriptors.
Experimental Protocols for Descriptor Determination
A solute's descriptors can be determined by measuring its behavior in multiple systems with known Abraham model coefficients and solving the resulting set of equations.
Protocol: Determination of Descriptors for a Simple, Neutral Solute
This protocol outlines the steps for determining descriptors for a solute that does not ionize or self-associate in solution [2].
1. Compilation of Experimental Data:
- Gather experimental values for the target solute across various partitioning systems. A minimum of 6-8 diverse data points is typically required.
- Recommended Property Types:
- log P (Water-Solvent Partition): Measured for 3-4 different organic solvents (e.g., wet octanol, hexane, toluene, diethyl ether) [2].
- log K (Gas-Solvent Partition): Measured for 2-3 different organic solvents.
- log S (Solubility): Molar solubility in water and at least 3-4 organic solvents, expressed as log(molar solubility ratio relative to water) [2].
2. Descriptor Calculation Workflow: The sequential process for determining the final set of descriptors is shown below.
Diagram 2: Workflow for descriptor determination.
3. Data Regression and Validation:
- Input the compiled experimental data and the known system coefficients for each measurement into statistical software.
- Perform a multiple linear regression to solve for the unknown descriptors (typically L, S, A, and B).
- Validate the result by ensuring the back-calculated properties agree with the experimental data within an acceptable error (e.g., standard deviation of ~0.10 log units or less) [2].
Specialized Protocols
Protocol for Carboxylic Acids (Dimerizing Solutes): For solutes like trans-cinnamic acid that dimerize in non-polar solvents, separate descriptor sets for the monomer and dimer must be determined [2].
- Monomer Descriptors: Use solubility and partition coefficient data only from polar solvents (e.g., alcohols, acetone) where the solute exists predominantly as a monomer.
- Dimer Descriptors: Use solubility data only from non-polar, aprotic solvents (e.g., cyclohexane, benzene) where the solute exists predominantly as a dimer. The dimer is treated as a distinct chemical entity.
Protocol for Hydrocarbons using Gas Chromatography (GC): For non-polar molecules like alkanes, the descriptors E, S, A, and B are zero, simplifying the calculation [4] [6].
- Calculate Vx from molecular structure.
- The only unknown descriptor is L.
- Use a single set of measured Kováts Retention Indices (KRI) on a non-polar stationary phase (e.g., squalane).
- Use a pre-established correlation (KRI vs. L) for a series of alkanes to calculate the L descriptor for the target solute directly [6].
Protocol for Pharmaceuticals using HPLC: High-throughput determination of S, A, and B descriptors for drug-like molecules can be achieved using reversed-phase HPLC [5].
- Column Selection: Utilize a minimum of 3-4 HPLC columns with different bonded phases (e.g., C18, cyano, phenyl).
- Measurement: Determine the solute's retention factor (log k) on each column.
- Regression: Relate the measured log k values to the system coefficients of the HPLC columns to solve for the solute's S, A, and B descriptors. The E descriptor is often obtained from prediction, and Vx is calculated.
The Scientist's Toolkit: Research Reagents & Materials
Table 2: Essential Materials for Abraham Descriptor Research
| Material / Reagent | Function & Application in Descriptor Determination |
|---|---|
| n-Hexadecane | The reference solvent for defining the L descriptor [4]. Used in gas-liquid partition experiments. |
| Squalane GC Column | A non-polar stationary phase used in GC to measure retention data for determining the L descriptor of non-polar solutes like alkanes [6]. |
| Diverse Organic Solvents (e.g., octanol, hexane, ether, chloroform) | Used in water-solvent partition (log P) and solubility studies to probe different interaction potentials (dispersion, dipole, H-bonding) [2] [7]. |
| Characterized HPLC Columns (e.g., C18, Cyano, Phenyl) | Columns with different surface chemistries act as distinct partitioning systems. Measuring retention on these columns allows for the high-throughput determination of S, A, and B for pharmaceuticals [5]. |
| Solutes with Known Descriptors | A training set of reference compounds with well-established descriptor values is crucial for developing new Abraham model correlations for novel solvents or systems [4]. |
Applications in Pharmaceutical and Medical Device Development
The Abraham model is a powerful tool for addressing complex challenges in pharmaceutical and medical device industries [3].
- Establishing Equivalent Solvents: The model can objectively identify less toxic or more sustainable solvents with similar solubilizing properties to a standard solvent, aiding in "green chemistry" initiatives and replacement strategies [3] [7].
- Developing Drug Product Simulating Solvents: For extractables and leachables (E&L) studies, the model helps formulate solvents that mimic the hydrophobicity and hydrogen-bonding activity of a drug product, ensuring relevant extraction conditions [3].
- Understanding Extraction Efficiency: It provides a quantitative basis for understanding and predicting the extraction power of various solvents towards different polymeric materials used in medical devices and container closure systems [3].
- Chromatographic Retention Prediction: By modeling HPLC retention times, the model can assist in the identification of unknown E&L compounds, a critical step in safety assessments [3].
Linear Solvation Energy Relationships (LSERs), specifically the Abraham solvation parameter model, represent one of the most successful predictive frameworks in molecular thermodynamics [8] [9]. These models are built on linear free energy relationships (LFERs) that correlate solute transfer between phases using fundamental molecular descriptors [10]. The remarkable robustness of LSERs stems from their solid thermodynamic foundation, which maintains linearity even when accounting for strong specific interactions like hydrogen bonding [8]. This application note explores the thermodynamic principles underlying LSER linearity and provides detailed protocols for determining LSER solute descriptors, framed within broader research on solvation thermodynamics.
The LSER model utilizes two primary equations for quantifying solute partitioning. For transfer between two condensed phases, the relationship is expressed as:
log(P) = cp + epE + spS + apA + bpB + vpVx [8] [9]
For gas-to-solvent partitioning, the equation becomes:
log(KS) = ck + ekE + skS + akA + bkB + lkL [8] [9]
In these equations, the uppercase letters (E, S, A, B, V, L) represent solute-specific molecular descriptors, while the lowercase letters (e, s, a, b, v, l, c) are solvent-specific system coefficients that embody the complementary effect of the solvent phase on solute-solvent interactions [8].
Thermodynamic Foundation of LSER Linearity
Theoretical Basis for Linear Relationships
The persistent linearity observed in LSER equations, even for systems with strong specific interactions like hydrogen bonding, finds its theoretical basis in solvation thermodynamics and statistical mechanics [8]. When the free-energy functions corresponding to the diabatic states of a solute-solvent system are approximated as parabolas of equal curvature, the resulting adiabatic ground-state surface naturally gives rise to linear relationships between activation free energy (ΔG‡) and reaction free energy (ΔG⁰) [10]. This parabolic approximation provides the mathematical foundation for the observed linearity in free-energy relationships across diverse chemical systems.
The division of Gibbs energy into hydrogen-bonding (ΔGhb) and non-hydrobonding (ΔG-LF) components within equation-of-state frameworks further validates the thermodynamic consistency of LSERs [9]. The hydrogen-bonding contribution follows Veytsman's statistics, while the non-hydrogen-bonding term incorporates all other intermolecular interactions, creating a comprehensive theoretical structure that supports the empirical success of LSER models.
Molecular Descriptors and Their Thermodynamic Significance
Table 1: LSER Molecular Descriptors and Their Thermodynamic Interpretation
| Descriptor | Symbol | Thermodynamic Property | Intermolecular Interactions Represented |
|---|---|---|---|
| Excess Molar Refraction | E | Polarizability due to π- and n-electrons | Dispersion interactions with polarizable solvents |
| Dipolarity/Polarizability | S | Dipole moment and molecular polarizability | Keesom-type (dipole-dipole) and Debye-type (dipole-induced dipole) interactions |
| Hydrogen Bond Acidity | A | Hydrogen bond donor strength | Free energy of complexation with hydrogen bond acceptor solvents |
| Hydrogen Bond Basicity | B | Hydrogen bond acceptor strength | Free energy of complexation with hydrogen bond donor solvents |
| McGowan's Characteristic Volume | Vx | Molecular size and volume | Cavity formation energy and dispersion interactions |
| Gas-Hexadecane Partition Coefficient | L | General hydrophobicity/lipophilicity | Composite of all intermolecular interactions in apolar environment |
Each LSER descriptor quantifies a specific aspect of solute-solvent interactions, contributing additively to the overall free energy of solvation or partitioning [8] [9]. The success of the model lies in this additive contribution approach, where each term represents a distinct, theoretically grounded interaction type that collectively captures the complexity of solvation phenomena.
Experimental Protocols for LSER Descriptor Determination
Core Experimental Methodology
The determination of LSER solute descriptors relies on measuring partition coefficients across multiple well-characterized systems and applying multilinear regression. The following protocol outlines the standard approach for experimental determination of Abraham solute descriptors:
Protocol 1: Experimental Determination of Abraham Solute Descriptors
Sample Preparation
- Prepare standard solutions of the target solute in high-purity water, n-hexane, and octanol at concentrations suitable for analytical detection
- Ensure chemical stability of solute in all solvent systems through preliminary stability studies
- Use saturated solutions for solubility determinations, verified by the presence of excess solid phase
Partition Coefficient Measurement
- Employ shake-flask method for liquid-liquid partitioning systems (e.g., octanol-water)
- Utilize headspace gas chromatography for gas-liquid partitioning systems
- Maintain constant temperature (typically 298 K) using calibrated water baths or incubators
- Allow sufficient time for equilibrium establishment (typically 24-48 hours with agitation)
- Verify equilibrium through forward and reverse approaches
Analytical Quantification
- Apply appropriate analytical methods (HPLC, GC, spectrophotometry) based on solute properties
- Use internal standards to account for procedural losses and matrix effects
- Perform triplicate measurements for each partition system to assess reproducibility
- Include system suitability controls with reference compounds of known descriptors
Data Regression and Descriptor Calculation
- Compile measured partition coefficients (log P) for multiple systems (minimum 5-6 diverse systems)
- Assemble system parameters (e, s, a, b, v, c) for each partitioning system from reference databases
- Apply weighted multilinear regression to solve the system of LSER equations
- Validate descriptor set by predicting additional partition coefficients in test systems
- Calculate confidence intervals for each descriptor through error propagation analysis
This experimental approach requires careful measurement of partition coefficients across systems with complementary selectivity to ensure well-conditioned regression and minimize parameter covariance [11] [12].
Computational Protocol for Descriptor Prediction
For compounds lacking experimental data, computational methods provide an alternative route for descriptor estimation. The following protocol outlines the use of machine learning approaches, specifically the AbraLlama model, for predicting solute descriptors:
Protocol 2: Computational Prediction of LSER Descriptors Using AbraLlama-Solute
Input Preparation
- Generate canonical SMILES representation of target compound using cheminformatics tools (e.g., OpenBabel, RDKit)
- Verify SMILES syntax and molecular structure correctness
- For mixtures, prepare separate SMILES for each component
Model Execution
- Access AbraLlama-Solute model through Hugging Face platform
- Input SMILES string into the prediction interface
- Execute prediction for all five descriptors (E, S, A, B, V) simultaneously
- Record predicted values with associated confidence estimates
Result Validation
- Compare predictions with similar compounds from experimental databases (UFZ-LSER database)
- Assess chemical reasonableness of predicted values (e.g., A=0 for compounds without hydrogen bond donors)
- Perform consensus prediction using multiple algorithms (SoluteGC, SoluteML) when available
- Flag compounds with high prediction uncertainty for experimental verification
The AbraLlama model, fine-tuned from the ChemLLaMA large language model specifically for cheminformatics tasks, demonstrates high accuracy in predicting solute descriptors directly from SMILES representations [12]. This approach significantly expands the applicability of LSER methods to compounds without extensive experimental data.
Advanced Integration: LSER and Equation-of-State Thermodynamics
Partial Solvation Parameters (PSP) Framework
The Partial Solvation Parameters (PSP) approach provides a crucial bridge between LSER descriptors and equation-of-state thermodynamics, enabling the extraction of thermodynamically meaningful information from LSER databases [8] [13]. The PSP framework defines four fundamental parameters that correspond to specific interaction types:
Table 2: Correspondence Between LSER Descriptors and Partial Solvation Parameters
| PSP Parameter | Symbol | LSER Equivalent | Thermodynamic Interpretation |
|---|---|---|---|
| Dispersion PSP | σd | L, Vx | Quantifies London dispersion interactions related to molecular size and polarizability |
| Polar PSP | σp | E, S | Represents Keesom and Debye interactions from permanent and induced dipoles |
| Acidic Hydrogen-Bonding PSP | σa | A | Measures hydrogen bond donor strength (Lewis acidity) |
| Basic Hydrogen-Bonding PSP | σb | B | Measures hydrogen bond acceptor strength (Lewis basicity) |
The one-to-one correspondence between PSPs and LSER molecular descriptors enables direct information exchange between solvation parameter approaches and equation-of-state models [13]. This integration facilitates the estimation of interaction energies over broad ranges of temperature and pressure, significantly expanding the application domain of LSER-derived parameters.
LSER-Equation of State Integration Protocol
Protocol 3: Integrating LSER Descriptors with Equation-of-State Models
PSP Parameter Calculation
- Convert experimental or predicted LSER descriptors to PSPs using established transformation equations [13]
- Calculate dispersion PSP (σd) from McGowan volume (Vx) and hexadecane partition coefficient (L)
- Determine polar PSP (σp) from excess molar refraction (E) and dipolarity/polarizability (S)
- Derive acidic PSP (σa) directly from hydrogen bond acidity descriptor (A)
- Derive basic PSP (σb) directly from hydrogen bond basicity descriptor (B)
Hydrogen-Bonding Free Energy Estimation
- Calculate free energy change upon hydrogen bond formation (ΔGhb) from σa and σb values
- Estimate corresponding enthalpy (ΔHhb) and entropy (ΔShb) changes using temperature-dependent relationships
- Incorporate hydrogen-bonding contribution into equation-of-state framework (e.g., LFHB, SAFT)
Phase Equilibrium Calculation
- Implement PSP-derived parameters in statistical associating fluid theory (SAFT) or lattice-fluid hydrogen-bonding (LFHB) equations of state
- Calculate activity coefficients, vapor-liquid equilibria, and other thermodynamic properties
- Validate predictions against experimental data for systems with similar interaction characteristics
This integrated approach enables the transfer of LSER information to predictive thermodynamic models applicable over wide ranges of conditions, overcoming the temperature limitations of standard LSER correlations [8] [9].
Research Toolkit for LSER Applications
Table 3: Research Reagent Solutions for LSER Studies
| Resource | Type | Function | Access |
|---|---|---|---|
| UFZ-LSER Database | Database | Repository of experimental LSER solute descriptors for >6,800 compounds | https://www.ufz.de/lserd |
| AbraLlama-Solute | ML Model | Predicts Abraham solute descriptors (E, S, A, B, V) from SMILES strings | Hugging Face Platform |
| AbraLlama-Solvent | ML Model | Predicts modified Abraham solvent parameters (e₀, s₀, a₀, b₀, v₀) | Hugging Face Platform |
| COSMO-RS | Computational Method | A priori prediction of solvation properties and hydrogen-bonding contributions | Commercial Software |
| Modified Solvent Parameters | Dataset | Enables direct comparison of solvent characteristics without intercept complications | Figshare Repository |
Experimental Reference Systems
For experimental determination of LSER descriptors, the following reference partitioning systems provide well-characterized solvent parameters with complementary selectivity:
- n-Hexadecane/water (for L and Vx determination)
- Octanol/water (benchmark system for drug partitioning)
- Diisopropylether/water (hydrogen bond acidity selectivity)
- Cyclohexane/water (dispersion interaction characterization)
- Propylene glycol dipelargonate/water (comprehensive interaction profiling)
These systems collectively provide diverse interaction environments that ensure well-conditioned regression for descriptor determination [11] [12].
LSER Workflow Visualization
Diagram 1: LSER Research Workflow for Thermodynamic Property Prediction. This workflow illustrates the integrated computational and experimental approach for determining LSER descriptors and their application in predictive thermodynamics.
The thermodynamic basis of LSER linearity rests on robust theoretical foundations, with the parabolic approximation of free-energy profiles providing mathematical justification for the observed linear relationships [8] [10]. The integration of LSER descriptors with equation-of-state thermodynamics through the PSP framework creates a powerful predictive tool that transcends the temperature and pressure limitations of conventional LSER approaches [13] [9]. The experimental and computational protocols detailed in this application note provide researchers with comprehensive methodologies for determining LSER solute descriptors and leveraging them in thermodynamic predictions. As machine learning approaches like AbraLlama continue to advance, the accessibility and applicability of LSER methods will further expand, solidifying their role as essential tools in molecular thermodynamics and drug development research [12].
The Critical Role of LSER Databases as a Source of Thermodynamic Information
Linear Solvation Energy Relationships (LSERs), specifically the Abraham solvation parameter model, represent one of the most successful predictive frameworks in molecular thermodynamics [8]. This approach provides a quantitative method for understanding solute-solvent interactions that are fundamental to countless chemical, biological, and environmental processes [8]. The model's power lies in its ability to distill complex intermolecular interactions into a set of six empirically determined molecular descriptors that comprehensively characterize solute behavior [14]. These descriptors capture the contribution of different interaction types - dispersion forces, dipolarity/polarizability, and hydrogen-bonding capacity - allowing for the prediction of free-energy related properties such as partition coefficients and solubility [9]. The wealth of thermodynamic information encoded in LSER databases has become indispensable for researchers across multiple disciplines, from drug development to environmental chemistry [8] [15].
The LSER model operates on the principle that free-energy related properties can be described through linear relationships that separate solute properties from system (solvent or phase) properties [9]. For the transfer of neutral compounds between two condensed phases, the model is expressed as:
log(SP) = c + eE + sS + aA + bB + vV [14]
where SP is a free-energy related property such as a partition coefficient or retention factor. The capital letters represent solute-specific descriptors, while the lower-case letters are system constants that describe the complementary interactions of the system with the solute descriptors [14]. This separation of solute and system parameters enables the prediction of solute behavior in any system for which the constants are known, without requiring additional experiments [14].
LSER Molecular Descriptors: Fundamentals and Thermodynamic Interpretation
The LSER model employs six key descriptors that provide comprehensive characterization of a solute's interaction potential. These descriptors are experimental quantities that collectively capture a molecule's capability for various types of intermolecular interactions, offering rich thermodynamic information about solute behavior in different environments [14].
Table 1: LSER Solute Molecular Descriptors and Their Thermodynamic Significance
| Descriptor | Symbol | Thermodynamic Interpretation | Experimental Determination Methods |
|---|---|---|---|
| McGowan's Characteristic Volume | V | Related to the energy cost of cavity formation in the solvent | Calculation from molecular structure [14] |
| Excess Molar Refraction | E | Measures dispersion interactions from n- and π-electrons | Refractive index at 20°C for sodium D-line [14] |
| Dipolarity/Polarizability | S | Characterizes dipole-dipole and dipole-induced dipole interactions | Combination of GC retention data and liquid-liquid partition constants [14] |
| Hydrogen-Bond Acidity | A | Overall hydrogen-bond donating capacity | Gas chromatography, liquid-liquid partition, or NMR spectroscopy [14] |
| Hydrogen-Bond Basicity | B | Overall hydrogen-bond accepting capacity | Biphasic partition systems (e.g., water-organic solvent) [14] |
| Gas-Hexadecane Partition Coefficient | L | Describes dispersion interactions and cavity formation | Gas chromatography with n-hexadecane stationary phase [14] |
Of these six descriptors, only McGowan's characteristic volume (V) can be obtained solely by calculation from a known structure [14]. The excess molar refraction (E) can be calculated for liquids from the characteristic volume and an experimental refractive index [14]. The remaining descriptors (S, A, B, L) are primarily experimental quantities determined through various chromatographic and partition methods, making robust experimental protocols essential for their accurate determination [14].
Experimental Protocols for Determining LSER Solute Descriptors
Determination of Hydrogen-Bond Basicity (B Descriptor)
The hydrogen-bond basicity descriptor (B) is particularly challenging to determine and requires carefully controlled experimental conditions.
Materials and Reagents:
- HPLC-grade water
- High-purity organic solvents (e.g., n-hexane, ethyl acetate, diethyl ether)
- Certified reference compounds with well-established descriptor values
- Reversed-phase liquid chromatography system with C18 column
- Thermostated separation vessels
- Gas chromatograph with flame ionization detector
Procedure:
- System Selection: Employ biphasic systems where one phase is aqueous, such as reversed-phase liquid chromatography, micellar electrokinetic chromatography, or water-organic solvent liquid-liquid partition [14].
- Partition Experiments: For liquid-liquid partition, equilibrate the solute between water and an immiscible organic solvent in thermostated vessels at 25°C for 24 hours with constant agitation.
- Phase Separation: After equilibration, allow phases to separate completely and analyze each phase quantitatively using appropriate analytical methods (e.g., GC-FID, HPLC-UV).
- Measurement: Determine the partition coefficient as P = [solute]ₒᵣ𝑔/[solute]wₐₜₑᵣ.
- Data Analysis: Use measured partition coefficients for multiple reference systems in conjunction with Eq. 2 to solve for the B descriptor through multilinear regression.
Quality Control:
- Use at least 3 different biphasic systems with varying hydrogen-bond accepting characteristics
- Include reference compounds with well-established B values in each experiment
- Maintain constant temperature (±0.1°C) throughout partitioning
- Verify mass balance of solute (95-105% recovery)
Determination of Gas-Hexadecane Partition Coefficient (L Descriptor)
The L descriptor is preferably determined using gas chromatographic methods under specific conditions.
Materials and Reagents:
- n-Hexadecane stationary phase of high purity (>99%)
- Inert gas chromatographic support material
- Deactivated fused silica columns
- High-purity helium carrier gas
- Temperature-controlled gas chromatography oven (±0.1°C precision)
- Certified reference alkanes for retention index calibration
Procedure:
- Column Preparation: Coat capillary columns with n-hexadecane stationary phase at isothermal conditions appropriate for the solute volatility.
- Retention Measurement: Inject solutes and measure retention factors (k) at 25°C, using n-alkanes as retention markers.
- Calculation: Calculate the L descriptor directly from log k values after appropriate calibration.
- Alternative Method: For compounds not amenable to gas chromatography at 25°C, determine L from back-calculation using retention factors measured on low-polarity stationary phases at elevated temperatures, extrapolating to 25°C using established thermodynamic relationships.
Critical Considerations:
- Avoid using polar stationary phases for L descriptor determination as they may introduce mixed retention mechanisms [14]
- Ensure solute does not undergo degradation at analysis temperatures
- Verify linearity of retention index behavior for homologue series
- Use appropriate reference compounds to validate system performance
Research Reagent Solutions and Essential Materials
Table 2: Essential Research Reagents and Materials for LSER Descriptor Determination
| Category | Specific Items | Function/Application | Quality Specifications |
|---|---|---|---|
| Chromatographic Phases | n-Hexadecane, poly(ethylene glycol), poly(siloxane) | Stationary phases for GC determination of L, S, and A descriptors | >99% purity, low bleeding characteristics [14] |
| Partition Solvents | Water, n-octanol, alkanes (hexane, heptane), diethyl ether, ethyl acetate | Biphasic systems for determining S, A, and B descriptors | HPLC grade, low UV absorbance, purity >99% [14] |
| Reference Compounds | n-Alkanes, alkylbenzenes, ketones, alcohols, ethers | System calibration and descriptor validation | Certified reference materials, >98% purity [14] |
| Analytical Instruments | Gas chromatograph with FID, HPLC system with UV detection, automated titrator | Quantification of solute concentrations in partition experiments | Calibration certified, temperature control ±0.1°C [14] |
Workflow for LSER Descriptor Determination
The following diagram illustrates the comprehensive experimental workflow for determining LSER solute descriptors:
Data Validation and Quality Control in LSER Databases
The accuracy of LSER predictions depends critically on the quality of the underlying descriptor data. Inconsistent descriptor values for the same compound across different literature sources present a significant challenge [14]. The Wayne State University (WSU) compound descriptor database addresses this issue by acquiring experimental data for descriptor calculation in a single laboratory with consistent quality control and calibration protocols [14]. This approach minimizes experimental uncertainty and provides screening tools to identify problematic data associated with secondary compound-system interactions [14].
Common Sources of Error in Descriptor Determination:
Mixed Retention Mechanisms: In chromatographic systems, retention factors may not exclusively reflect the intended intermolecular interactions when multiple mechanisms are operative [14]. This is particularly problematic for n-alkanes on polar stationary phases where interfacial adsorption can contribute significantly to retention [14].
Electrostatic Interactions: For compounds containing protonatable functional groups on silica-based stationary phases, electrostatic interactions with ionized silanol groups can cause significant errors as these interactions are falsely attributed to descriptor values for the neutral compound [14].
Steric Resistance: Bulky compounds may not fully penetrate the solvated stationary phase in liquid chromatography, resulting in lower retention and consequently inaccurate descriptor values [14].
Validation Protocols:
- Cross-validate descriptors using multiple determination methods
- Compare predicted versus experimental partition coefficients for systems not used in descriptor determination
- Assess internal consistency through thermodynamic relationships between different descriptors
- Utilize statistical outlier detection methods to identify potentially erroneous values
Advanced Applications and Integration with Modern Thermodynamic Models
The thermodynamic information contained in LSER databases has proven valuable beyond traditional partition coefficient prediction. Recent research has focused on integrating LSER descriptors with equation-of-state models and quantum-chemical approaches to create more powerful predictive frameworks [8] [9].
The Partial Solvation Parameters (PSP) approach represents one such development, designed to facilitate the exchange of thermodynamic information between LSER databases and equation-of-state developments [8]. PSPs maintain an equation-of-state thermodynamic basis that permits estimation over a broad range of external conditions, with hydrogen-bonding PSPs (σa and σb) used to estimate the free energy change upon hydrogen bond formation (ΔGhb) [8].
Similarly, efforts to interconnect the quantum-mechanics based COSMO-RS (Conductor Screening Model for Realistic Solvation) with the LSER approach have shown promise [9]. Comparative studies have demonstrated "a rather good agreement" between COSMO-RS predictions of hydrogen-bonding contribution to solvation enthalpy and corresponding LSER predictions for most studied systems [9]. This convergence of approaches suggests a path toward developing a COSMO-LSER equation-of-state framework that would leverage the strengths of both methods [9].
Recent work has also explored the development of novel quantum chemical-LSER (QC-LSER) descriptors that combine quantum chemical calculations with the LSER approach for predicting hydrogen-bonding interaction free energies [16]. These developments are particularly useful for solvation studies in chemical and biochemical systems and for equation-of-state developments in molecular thermodynamics [16].
The critical role of LSER databases as sources of thermodynamic information continues to expand as new applications and integration with computational methods emerge. The robust experimental protocols for descriptor determination, comprehensive validation procedures, and ongoing methodological developments ensure that these databases remain indispensable tools for researchers predicting solute behavior in complex chemical and biological systems.
A Step-by-Step Protocol: From Experimental Data to Computational Prediction of Solute Descriptors
Partition coefficients are fundamental physicochemical parameters that quantify the equilibrium distribution of a solute between two immiscible phases. Within the context of Linear Solvation Energy Relationships (LSERs), the accurate experimental determination of these coefficients is a critical step for deriving solute descriptors, which in turn enable the prediction of a vast array of environmental, biological, and pharmaceutical properties [8]. These descriptors - Vx, L, E, S, A, and B - encapsinate a solute's characteristic volume, gas-liquid partitioning, excess molar refraction, dipolarity/polarizability, hydrogen-bond acidity, and hydrogen-bond basicity, respectively [8]. This protocol details the core experimental methodologies for measuring gas-liquid and water-solvent partition coefficients, which are essential for populating the LSER database and refining its predictive power [1].
Theoretical Foundation and LSER Context
The LSER model correlates free-energy-related properties using two primary equations. For solute transfer between two condensed phases (e.g., water and an organic solvent), the model is expressed as: log (P) = cp + epE + spS + apA + bpB + vpVx [8]
Where P is the partition coefficient and the lower-case letters are the system-specific LSER coefficients. For gas-to-solvent partitioning, the equation is:
log (KS) = ck + ekE + skS + akA + bkB + lkL [8]
Here, L is the logarithm of the hexadecane/air partition coefficient, a key parameter often determined via experimental methods [17]. The experimental determination of partition coefficients like P and KS for a diverse set of solutes allows for the back-calculation and validation of these molecular descriptors, creating a robust, self-consistent database for predictive toxicology and pharmacokinetics [1] [18].
Experimental Protocols
Protocol 1: Shake-Flask Method for Water-Solvent Partition Coefficients
The shake-flask method is a direct experimental approach for determining the partition coefficient of a solute between water and a water-immiscible organic solvent, most commonly n-octanol (log KOW).
Materials and Equipment
- Solvents: High-purity water (e.g., HPLC-grade) and n-octanol, pre-saturated with each other before use.
- Solute: A stock solution of the analyte of known concentration.
- Glassware: Separatory funnels or glass vials with PTFE-lined caps.
- Apparatus: Mechanical shaker, centrifuge, and an analytical instrument (e.g., HPLC, GC, or UV-Vis spectrophotometer).
Step-by-Step Procedure
- Preparation: Pre-saturate the water and n-octanol by mixing them thoroughly and allowing the phases to separate. Use the saturated phases for the experiment.
- Equilibration: Accurately measure known volumes of the aqueous and organic phases (e.g., 10 mL each) into a glass vial. Add a known amount of the solute stock solution. Seal the vial and agitate it vigorously for a predetermined time (e.g., 1 hour) using a mechanical shaker at a constant temperature (e.g., 25 ± 1°C) to establish equilibrium [19].
- Phase Separation: After agitation, allow the phases to separate completely. This may be facilitated by centrifugation [19].
- Analysis: Carefully separate the two phases. Determine the concentration of the solute in each phase using a suitable analytical method. Chromatographic methods (HPLC, GC) are preferred for their specificity [19].
- Calculation: The partition coefficient, P, is calculated as the ratio of the equilibrium concentration of the solute in the organic phase to that in the aqueous phase: P = [A]org / [A]aq.
- Validation: The total mass of solute recovered in both phases should be compared to the mass introduced to account for any adsorption or degradation [19]. The OECD guideline recommends multiple runs with different phase volume ratios, with the resulting log P values falling within a range of ± 0.3 units [19].
The workflow for this method is standardized as follows:
Protocol 2: Determining Gas-Liquid Partition Coefficients
Gas-liquid partitioning, characterized by Henry's Law constant (KH) or the air-water partition coefficient (KAW), is crucial for understanding the volatility of a substance.
Materials and Equipment
- Headspace Vials: Sealed vials with PTFE/silicone septa.
- Thermostatted Water Bath: For precise temperature control.
- Apparatus: Gas-tight syringes and a GC system equipped with a headspace autosampler or appropriate detector (e.g., Mass Spectrometer).
Step-by-Step Procedure
- Sample Preparation: Place a known volume of an aqueous solution of the solute into a headspace vial. Seal the vial immediately to prevent any gas exchange.
- Equilibration: Incubate the vial in a thermostatted water bath at a constant temperature (e.g., 25°C) until equilibrium between the aqueous and gas phases is reached.
- Sampling: Using a gas-tight syringe or an automated headspace sampler, extract a defined volume of the headspace (gas phase).
- Analysis: Inject the headspace sample into a Gas Chromatograph (GC) for quantitative analysis of the solute concentration in the gas phase, [A]air.
- Calculation: The air-water partition coefficient, KAW, is calculated as KAW = [A]air / [A]aq. Henry's Law constant (KH) is often reported in different units (e.g., Pa·m³/mol) and may require conversion [20] [17].
The logical workflow for determining the air-water partition coefficient is outlined below:
Data Presentation and Analysis
Table 1: Key partition coefficients and their applications in LSER and environmental modeling.
| Partition Coefficient | Symbol | Phases | Primary Application in LSER / Context |
|---|---|---|---|
| Octanol-Water [20] [19] | KOW / log P | n-octanol / Water | Measures lipophilicity; foundational for LSER solute descriptor Vx, S, A, B [8]. |
| Air-Water / Henry's Law [20] | KAW / KH | Air / Water | Quantifies volatility; related to the gas-liquid partitioning constant L [17]. |
| Hexadecane-Air [17] | KHdA / L | n-hexadecane / Air | Directly provides the LSER solute descriptor L; measures dispersion interactions [8] [17]. |
| Organic Carbon-Water [20] | KOC | Organic carbon / Water | Predicts environmental sorption to soils and sediments. |
| Distribution Coefficient [20] | D | Organic solvent / Water (at specific pH) | Accounts for ionization; essential for ionizable solutes (acids, bases, zwitterions). |
Critical Experimental Parameters
Table 2: Critical parameters and their impact on measurement accuracy and LSER descriptor determination.
| Parameter | Impact on Measurement | Recommendation for LSER Studies |
|---|---|---|
| Temperature [20] [19] | Affects equilibrium constant. A 1°C change can significantly alter the measured value. | Maintain constant temperature (± 0.5°C), typically 20-25°C. Report temperature precisely [19]. |
| Phase Purity & Saturation [19] | Impurities or unsaturated solvents shift equilibrium and introduce error. | Pre-saturate immiscible solvents before use. Use high-purity reagents. |
| Solute Concentration | High concentrations can cause non-ideal behavior (association, saturation). | Use dilute solutions to ensure ideal behavior and infinite dilution conditions. |
| Ionization State (pKa) [20] [17] | For ionizable compounds, the partition coefficient (P) is pH-dependent. | For log P, ensure the solute is in its neutral form. Use the distribution coefficient D for pH-specific values [20]. |
| Mass Balance Verification [19] | Confirms no solute loss via adsorption, degradation, or volatilization. | Mandatory step. Recovery should be 100% ± 10%. Data from recoveries outside this range should be treated with caution. |
The Scientist's Toolkit
Table 3: Essential research reagents and materials for partition coefficient experiments.
| Item | Function / Application |
|---|---|
| n-Octanol (saturated with water) [19] | Standard organic solvent for measuring lipophilicity (log KOW), a key parameter in LSER and QSAR. |
| n-Hexadecane [17] | A non-polar solvent used to determine the LSER solute descriptor L (log KHdA), which characterizes dispersion interactions. |
| Inert Headspace Vials & Septa | Essential for gas-liquid partitioning experiments to prevent contamination and loss of volatile analytes. |
| Centrifuge [19] | Used for complete and rapid separation of emulsionated liquid phases after shaking (e.g., in shake-flask method). |
| Gas Chromatograph (GC) with FID/MS | Preferred analytical method for volatile and semi-volatile solutes in both liquid and gas phases [17]. |
| High-Performance Liquid Chromatograph (HPLC) [19] | Preferred analytical method for non-volatile, thermally labile solutes in the shake-flask method. |
| Thermostatted Shaker / Water Bath | Provides controlled agitation and constant temperature during the equilibration process, critical for reproducible results. |
Leveraging Chromatographic Retention Data for Descriptor Determination (HILIC & Reversed-Phase)
The determination of Linear Solvation Energy Relationship (LSER) solute descriptors is a critical methodology for quantitatively predicting the chromatographic behavior and physicochemical properties of novel compounds. These descriptors, central to the Abraham solvation parameter model, provide a powerful framework for understanding molecular interactions in different chromatographic systems, notably Reversed-Phase Liquid Chromatography (RPLC) and Hydrophilic Interaction Liquid Chromatography (HILIC) [21] [22]. For researchers in drug development, this approach offers a reliable protocol for estimating retention times, solubility, and other key properties essential for candidate selection and optimization.
This application note details experimental protocols for determining LSER solute descriptors using HILIC and RPLC retention data, framed within broader thesis research on descriptor determination methodologies. We provide comprehensive guidelines for data collection, processing, and descriptor calculation, specifically addressing the challenges of analyzing both neutral and ionizable compounds.
Theoretical Foundations of the LSER Model
The Abraham solvation parameter model defines solute transfer between two phases using a linear free energy relationship (LFER) [21] [4]. For chromatography, the model is expressed as:
log k = c + e·E + s·S + a·A + b·B + v·V [21]
In this equation:
- k is the retention factor
- c is a system constant
- The uppercase letters (E, S, A, B, V) are solute descriptors representing specific molecular properties
- The lowercase coefficients (e, s, a, b, v) are system parameters reflecting the complementary properties of the chromatographic system
The solute descriptors are defined as follows [21] [4]:
- E: The solute's excess molar refraction
- S: Solute polarity/polarizability
- A: Overall hydrogen-bond acidity
- B: Overall hydrogen-bond basicity
- V: McGowan molecular volume
For ionizable compounds, the model can be extended to include terms for the degree of ionization. A modified LSER model includes the D descriptor, which accounts for the ionization state based on the mobile phase pH and analyte pKa [22]. This descriptor can be further separated into D+ for bases and D- for acids to improve accuracy for ionizable compounds [22].
Experimental Protocols for Descriptor Determination
Stationary and Mobile Phase Selection
Stationary Phases:
- HILIC Mode: Select polar stationary phases with well-characterized properties. Options include bare silica, zwitterionic (e.g., sulfobetaine), amide, diol, or cyano phases [23] [24]. Different phases exhibit varying contributions from partitioning, polar interactions, and ion-exchange mechanisms [23].
- RPLC Mode: Use conventional non-polar phases such as C18, C8, or phenyl columns [21] [25].
Mobile Phase Preparation:
- HILIC: Prepare mobile phases with acetonitrile/water or methanol/water mixtures containing 3-40% water [21]. Include 10-20 mM volatile buffers (e.g., ammonium acetate) for pH control [25]. For zwitterionic columns, prepare mobile phases using plastic solvent bottles (e.g., PFA) instead of borosilicate glass to prevent ion leaching that causes retention time irreproducibility [26].
- RPLC: Use standard aqueous-organic mixtures with appropriate buffers for pH control.
Table 1: Research Reagent Solutions for LSER Descriptor Determination
| Reagent Category | Specific Examples | Function in Protocol |
|---|---|---|
| HILIC Stationary Phases | Bare Silica (e.g., BEH HILIC), Zwitterionic (e.g., ZIC-HILIC), Amide (e.g., TSKgel Amide-80) | Provides polar surface for retention; different phases offer distinct blends of partitioning and ionic interactions [23] [24] [25]. |
| RPLC Stationary Phases | C18, C8, Phenyl, Butylimidazolium-based | Provides hydrophobic surface for reversed-phase retention [21] [22]. |
| Organic Modifiers | Acetonitrile (MeCN), Methanol (MeOH) | Primary mobile phase component; affects retention mechanism and selectivity [21] [23]. |
| Buffers & Salts | Ammonium Acetate, Ammonium Formate | Controls mobile phase pH and ionic strength; minimizes unwanted ionic interactions [25] [27]. |
| Solvent Reservoirs | PFA (Tetrafluoroethylene Copolymer) Bottles | Prevents leaching of ions that alter the water layer on HILIC phases and cause retention time drift [26]. |
Retention Measurement and Data Collection
- Probe Solute Selection: Assemble a diverse set of 30-40 reference compounds with well-established solute descriptors [22] [4]. Include both neutral and ionizable compounds (acids and bases) to adequately characterize the system.
- Chromatographic Conditions:
- Retention Factor Calculation: For each compound and mobile phase composition, calculate the retention factor: k = (tᵣ - t₀)/t₀, where tᵣ is the compound retention time and t₀ is the column dead time.
- Data Recording: Record log k values for each compound at multiple mobile phase compositions. For ionizable compounds, note the mobile phase pH and the analyte pKa (preferably measured in the mobile phase) for calculating D+ and D- descriptors [22].
System Characterization and Descriptor Calculation
- System Coefficient Determination: For each chromatographic system (stationary phase/mobile phase combination), perform multiple linear regression using the known solute descriptors of the reference compounds and their measured log k values to determine the system coefficients (e, s, a, b, v, c) [21] [4].
- Descriptor Calculation for New Compounds:
- Measure retention factors for the new compound across multiple chromatographic systems with known system coefficients.
- Use multiple linear regression to solve for the solute descriptors (E, S, A, B, V) that best fit the retention data across all systems [4].
- For ionizable compounds, include the D+ or D- term in the regression model [22].
Figure 1: Experimental workflow for LSER solute descriptor determination using chromatographic retention data. HILIC-specific considerations are highlighted in red. MLR = Multiple Linear Regression.
Data Analysis and Interpretation
System Coefficient Interpretation
The system coefficients obtained from the multiple linear regression provide insights into the molecular interactions governing retention in each chromatographic system [21]:
- A positive v-coefficient indicates that larger molecular volume increases retention (common in RPLC)
- A negative v-coefficient suggests that larger size reduces retention (observed in HILIC with acetonitrile-rich mobile phases)
- Positive a- and b-coefficients indicate that hydrogen-bonding interactions strengthen retention
- Negative a- and b-coefficients suggest that hydrogen-bonding with the mobile phase reduces retention
Table 2: Representative System Coefficients for Different Chromatographic Modes
| System Coefficient | HILIC (Zwitterionic Phase with MeCN) | Reversed-Phase (C18) | Interpretation |
|---|---|---|---|
| v (Molecular Volume) | Negative [21] | Positive [21] | In HILIC, larger size reduces retention; in RPLC, it increases retention. |
| b (H-Bond Basicity) | Positive (MeCN) / Negative (MeOH) [21] | Negative [21] | H-bond basicity increases retention in HILIC-MeCN but decreases it in RPLC. |
| a (H-Bond Acidity) | Positive [21] | Variable | H-bond acidity generally increases retention in HILIC. |
| s (Polarity) | Positive [21] | Variable | Dipole-type interactions increase retention in HILIC. |
| Ion-Exchange Contribution | Slope ~ -1 (High) to 0 (Low) [23] | Not significant | Varies by HILIC phase; high for pentafluorophenyl, low for pentahydroxyl phases [23]. |
Special Considerations for HILIC Systems
HILIC retention involves multiple mechanisms that must be considered when interpreting data:
Partitioning Mechanism: The primary retention mechanism in HILIC involves partitioning between the organic-rich mobile phase and a water-rich layer adsorbed on the stationary phase [21] [23]. This mechanism predominates on phases with high water uptake capacity (e.g., bare silica, amide, diol phases).
Ionic Interactions: Many HILIC phases exhibit significant ion-exchange characteristics [23]. To evaluate this contribution, measure retention at different buffer concentrations and plot log k versus log[buffer concentration]. A slope approaching -1 indicates dominant ion-exchange retention, while a slope near 0 indicates minimal ionic interactions [23].
Organic Modifier Effects: The choice of organic modifier (acetonitrile vs. methanol) significantly impacts selectivity in HILIC [21]. With acetonitrile, solute hydrogen-bond basicity enhances retention, while with methanol, this contribution may become negative [21].
Figure 2: Complex retention mechanisms in HILIC chromatography and their relationship with different stationary phases and analyte types. The dominant mechanism varies significantly with stationary phase chemistry.
Addressing Ionizable Compounds
For ionizable analytes, the standard LSER model requires modification to account for pH-dependent ionization:
Calculate Degree of Ionization: For each ionizable compound, calculate the D descriptor using the formula: D = 10^(pH - pKa) / (1 + 10^(pH - pKa)) [22] Use separate D+ and D- terms for basic and acidic compounds, respectively [22].
Mobile Phase Considerations: Note that pKa values are solvent-dependent and may shift significantly in high-organic mobile phases compared to aqueous values [22].
Extended LSER Model: Use the extended model including the D term: log k = c + e·E + s·S + a·A + b·B + v·V + d·D [22]
Applications in Drug Development
The solute descriptors obtained through these protocols enable prediction of various properties critical to pharmaceutical development:
Chromatographic Method Development: Descriptors predict retention times and selectivity for new compounds, streamlining method development [21] [23].
Solubility Prediction: LSER descriptors facilitate prediction of aqueous solubility and solubility in pharmaceutically relevant solvents [4].
Partition Coefficient Estimation: Log P and other partition coefficients can be accurately predicted using the solute descriptors [4].
Absorption and Permeability Modeling: Descriptors correlate with membrane permeability and can support prediction of absorption characteristics [4].
This application note provides comprehensive protocols for determining LSER solute descriptors using HILIC and reversed-phase chromatographic retention data. The methodologies described enable robust characterization of molecular properties for both neutral and ionizable compounds, with special considerations for the complex retention mechanisms in HILIC chromatography. When properly implemented, this approach provides valuable descriptors that support various predictive modeling efforts in drug discovery and development.
The integration of these protocols into a broader thesis on descriptor determination methodologies offers a systematic approach to molecular characterization that bridges chromatographic behavior with fundamental solvation properties. Following the detailed experimental guidelines and data analysis procedures outlined herein will ensure reliable, reproducible descriptor determination applicable across diverse compound classes.
The precise prediction of physicochemical properties is a cornerstone of environmental science and chemical risk assessment, particularly in the context of Linear Solvation Energy Relationship (LSER) models for determining solute descriptors [28]. These descriptors are crucial for predicting partition coefficients, such as the octanol-water partition coefficient (Kow) and octanol-air partition coefficient (Koa), which characterize the bioaccumulation potential of chemicals [28]. However, experimentally determined solute descriptors are available for only about 8,000 chemicals, a minuscule fraction of the over 182 million registered chemicals [28]. This disparity creates a pressing need for robust computational methods to predict these descriptors accurately, especially for complex chemical structures with multiple functional groups where traditional quantitative structure-property relationship (QSPR) models struggle [28].
The integration of quantum mechanical (QM) calculations with molecular mechanical (MD) simulations has emerged as a powerful multiscale computational tool for studying chemical reactions in complex environments [29]. While direct ab initio QM/MM molecular dynamics simulations provide high accuracy, they are prohibitively time-consuming for adequate statistical sampling [29]. This application note details hybrid protocols that leverage machine learning to bridge the accuracy of quantum chemistry with the computational efficiency of molecular dynamics, providing researchers with practical methodologies for advancing LSER solute descriptor research.
Computational Methodologies
Foundational QM/MM Framework
The QM/MM approach partitions the system into a QM region, where bond breaking and formation occurs, treated with quantum mechanical methods, and an MM region, representing the complex environment, treated with molecular mechanical force fields [29]. This hybrid scheme allows for a realistic modeling of chemical processes in solution or enzymes while maintaining computational feasibility. The fundamental LSER equations for predicting solute properties (SP) utilize solute descriptors as follows [28]:
- Eq. (1) for Condensed Phase Systems:
SP = c + eE + sS + aA + bB + vV - Eq. (2) for Air-Included Systems:
SP = c + eE + sS + aA + bB + lL - Eq. (3) for General Application:
SP = c + sS + aA + bB + vV + lL
where the uppercase letters represent solute descriptors (excess molar refraction E, polarizability S, hydrogen bond acidity A, hydrogen bond basicity B, McGowan characteristic volume V, and hexadecane-air partition coefficient L), and lowercase letters represent system constants [28].
Deep Learning for Solute Descriptor Prediction
Protocol: Deep Neural Network (DNN) for Solute Descriptor Prediction
- Objective: To accurately predict LSER solute descriptors for chemicals, overcoming limitations of traditional fragmental QSPR approaches for complex structures [28].
- Curated Dataset:
- Begin with the Abraham Absolv dataset of 7,881 chemicals [28].
- Filter to chemicals with available S descriptors, reducing to 7,241 chemicals [28].
- Exclude metals, organometallics, and gases (e.g., argon, nitrogen, methane) [28].
- Implement error-checking for descriptor values outside plausible ranges, finalizing with approximately 6,364 chemicals [28].
- Model Development:
- Singletask Models: Develop individual DNN models for each solute descriptor (E, S, A, B, V, L). These are preferred over multitask models for smaller datasets [28].
- Graph Representations: Use graph representations of chemicals as input features for the DNN [28].
- Data Augmentation: Employ tautomer-based data augmentation strategies to improve DNN training [28].
- Performance Validation: Achieve root mean square errors (rmse) between 0.11 and 0.46 for different solute descriptors [28].
- Implementation:
Neural Network-Driven QM/MM Molecular Dynamics
Protocol: Adaptive QM/MM-NN Molecular Dynamics- Objective: To perform direct MD simulations approximating ab initio QM/MM accuracy at a fraction of the computational cost, enabling statistical sampling for free energy calculations [29].
- Initial Setup:
- Neural Network Training:
- Iterative MD Scheme:
- Cycle 1: Perform MD simulations on the NN-predicted potential energy surface [29].
- Adaptive Selection: Identify configurations encountered during MD that were excluded from the initial NN training database and may cause sampling difficulties [29].
- Database Update: Add these new configurations to the database, recalculate ab initio QM/MM energies, and retrain the NN [29].
- Cycle Repetition: Repeat MD simulations and NN updates for 2-4 cycles until convergence, reproducing results at the ab initio QM/MM level [29].
- Output Applications:
Quantitative Data Presentation
The following tables summarize key quantitative data for comparing traditional and hybrid computational approaches in LSER and molecular dynamics. Table 1: Performance Comparison of Solute Descriptor Prediction Methods [28]| Prediction Method | Model Type | RMSE Range for Descriptors | Key Application Strength |
|---|---|---|---|
| Deep Neural Network (DNN) | Singletask/Graph-Based | 0.11 - 0.46 | Complex structures with multiple functional groups |
| QSPR (LSERD) | Fragmental-based | Not Specified | Simple chemical structures with one functional group |
| ACD/Absolv | Fragmental-based | Not Specified | Simple chemical structures with one functional group |
| Partition Coefficient Dataset | Dataset Size (Chemicals) | Typical RMSE (log units) |
|---|---|---|
| Octanol-Water (Kow) | 12,010 | ~1.0 |
| Water-Air (Kwa) | 696 | ~1.3 |
| Octanol-Air (Koa) | Not Specified | Comparable to other methods |
| Content Type | Minimum Ratio (AA) | Enhanced Ratio (AAA) |
|---|---|---|
| Body Text | 4.5:1 | 7:1 |
| Large-Scale Text (≥18pt or 14pt bold) | 3:1 | 4.5:1 |
| UI Components / Graphical Objects | 3:1 | Not Defined |
Experimental Protocols
Protocol for Free Energy Calculation via Adaptive QM/MM-NN MD
This protocol details the calculation of free energy changes for a chemical reaction in solution using the adaptive QM/MM-NN method.System Preparation:
- Solute: Create initial coordinates for the reactant molecule(s). Determine the quantum mechanical (QM) region, encompassing all atoms directly involved in bond breaking/formation.
- Solvent: Embed the solute in a pre-equilibrated box of water molecules (or other solvent) representing the molecular mechanical (MM) region.
- Force Field Assignment: Assign appropriate MM force field parameters to the solvent and any non-QM solute atoms.
Initial Sampling and NN Training:
- SQM/MM MD: Perform molecular dynamics simulation using a semiempirical QM/MM method (e.g., AM1/MM or SCC-DFTB/MM). Ensure sampling covers the relevant reaction coordinate.
- Configuration Selection: Extract 500-1000 configurations from the SQM/MM MD trajectory.
- Ab Initio Single-Point Calculations: For each selected configuration, perform a single-point energy calculation at the target ab initio QM/MM level (e.g., DFT/MM).
- Neural Network Training: Train the QM/MM-NN model using the SQM/MM configurations as input and the energy difference (ΔE = Eab initio - ESQM) as the target output.
Iterative Adaptive MD:
- Cycle Initiation: Launch an MD simulation on the NN-corrected potential energy surface.
- Configuration Monitoring: During the MD, identify new configurations where the NN prediction has high uncertainty or is an outlier compared to the training set.
- Database Update: Add these new configurations to the training database and compute their ab initio QM/MM energies.
- Model Retraining: Retrain the QM/MM-NN model with the expanded database.
- Convergence Check: Repeat steps 3b-3d for 2-4 cycles until the free energy profile and key geometric parameters remain stable between cycles.
Free Energy Analysis:
- Umbrella Sampling: Use the final NN-predicted PES to run umbrella sampling simulations along the predefined reaction coordinate.
- WHAM Analysis: Apply the Weighted Histogram Analysis Method (WHAM) to the umbrella sampling data to compute the potential of mean force (PMF), which is the free energy profile for the reaction.
The Scientist's Toolkit: Research Reagent Solutions
Table 4: Essential Computational Tools for Hybrid QM/MM and LSER Research| Item / Software | Type | Primary Function |
|---|---|---|
| Abraham Absolv Dataset | Dataset | A curated collection of ~7,800 chemicals with experimentally determined solute descriptors for model training and validation [28]. |
| LSERD Platform | Software (Online) | A free online platform using a fragmental QSPR approach to predict solute descriptors for LSER models [28]. |
| ACD/Percepta (Absolv) | Software (Commercial) | A commercial software package providing predictions of solute descriptors, useful for benchmarking against new methods [28]. |
| Semiempirical Methods (AM1, PM3, SCC-DFTB) | Computational Method | Fast, approximate QM methods used for initial configuration sampling and MD in QM/MM simulations to reduce computational cost [29]. |
| Ab Initio QM Methods (DFT) | Computational Method | Higher-accuracy quantum chemical methods (e.g., Density Functional Theory) used for target energy calculations and training data generation [29]. |
| Neural Network Potentials (e.g., QM/MM-NN) | Computational Model | Machine learning models trained to predict high-level QM energies from low-level inputs, enabling accurate and efficient MD simulations [29]. |
Workflow Visualization
Figure 1: Adaptive QM/MM-NN workflow for free energy calculation. The process begins with initial sampling and neural network training (green), followed by an iterative refinement cycle (blue) that continues until convergence is achieved.
Figure 2: Solute descriptor prediction and LSER application ecosystem. Experimental data feeds both traditional QSPR and modern DNN approaches, which in turn supply descriptors to the core LSER model for various physicochemical applications.
The Linear Solvation Energy Relationship (LSER) framework, also known as the Abraham model, is a foundational approach in environmental chemistry and drug development for predicting crucial physicochemical properties and partition coefficients [28] [8]. The model operates on the principle that a solute's behavior in a system can be described by a set of six solute descriptors: E (excess molar refraction), S (dipolarity/polarizability), A (hydrogen bond acidity), B (hydrogen bond basicity), V (McGowan characteristic volume), and L (the gas-hexadecane partition coefficient) [8] [12]. These descriptors are used in linear equations to predict properties like octanol-water partition coefficients (Kow), which are vital for assessing a compound's bioaccumulation potential and environmental fate [28]. Traditionally, these descriptors were determined experimentally, a process that is resource-intensive and has limited the available data to approximately 8,000 chemicals—a minuscule fraction of the known chemical universe [28].
Machine Learning (ML) represents a paradigm shift, overcoming the limitations of traditional experimental and group-contribution methods. ML models, particularly deep neural networks (DNNs) and large language models (LLMs), can learn complex, non-linear relationships directly from molecular structure and rapidly predict solute descriptors for vast chemical libraries [28] [12]. This capability is especially powerful for complex chemicals with multiple functional groups, where traditional fragment-based QSPR models often struggle [28]. By leveraging large, curated datasets, ML models provide a fast, complementary, and increasingly accurate tool for populating the LSER framework, thereby enabling the rational selection of solvents and chemicals with desired properties in drug development and material design [28] [12] [32].
Comparative Analysis of Machine Learning Approaches for Descriptor Prediction
The following table summarizes the key machine learning approaches currently being developed and validated for predicting Abraham solute descriptors.
Table 1: Machine Learning Approaches for LSER Solute Descriptor Prediction
| Model Name | Model Type | Key Input | Reported Performance | Notable Features & Applications |
|---|---|---|---|---|
| AbraLlama-Solute [12] | Fine-tuned Large Language Model (LLM) | SMILES strings | High accuracy, comparable to existing methods | Open-source; available as an application on Hugging Face for easy prediction from SMILES. |
| Deep Neural Networks (DNNs) [28] | Deep Neural Network | Graph representations of chemicals | RMSE range of 0.11 - 0.46 for different descriptors | Superior for large, complex structures; uses data augmentation with tautomers. |
| SoluteML [32] | Machine Learning (unspecified algorithm) | Not specified | R²: 0.982 - 0.953 (RPLC); R²: 0.995 - 0.987 (GC) | Machine learning-based descriptor estimation; fits chromatographic models better than group contribution. |
| GUSAR [33] | Quantitative & Qualitative SAR | MNA and QNA descriptors | Balanced accuracy for classification (SAR): ~0.80 | Can create both classification (SAR) and regression (QSAR) models for antitarget interaction prediction. |
The selection of an appropriate ML model depends on the specific application and required precision. For general-purpose descriptor prediction with high usability, AbraLlama-Solute offers a state-of-the-art, accessible solution [12]. For specialized applications like predicting chromatographic retention, SoluteML has demonstrated excellent performance [32]. When the goal is risk assessment regarding adverse drug reactions through antitarget interactions (e.g., hERG channel inhibition), GUSAR models provide validated accuracy [33]. It is critical to note that while these ML-derived descriptors are powerful, they may not always fit experimental LSER models as well as purely experimentally determined descriptors, as evidenced by the comparison with reference WSU descriptors [32]. Therefore, they are best used as a complementary and high-throughput screening tool.
Protocols for Implementing ML-Predicted Descriptors in Rational Selection Workflows
Protocol 1: High-Throughput Solvent Screening and Comparison
Purpose: To rapidly identify and compare alternative solvents with similar solvation properties for a given process using ML-predicted descriptors and modified solvent parameters [12] [1].
Workflow Diagram: High-Throughput Solvent Screening
Materials:
- Software: AbraLlama-Solvent web application [12] or access to the model via Hugging Face.
- Data Source: A library of SMILES strings for candidate solvent molecules.
Procedure:
- Define Target Parameters: Identify the modified Abraham solvent parameters (e₀, s₀, a₀, b₀, v₀) of a reference solvent known to work well in your process. These parameters can be obtained from literature or calculated using the method described by Bradley et al. [12].
- Predict Solvent Parameters: Input the SMILES strings of all candidate solvents into the AbraLlama-Solvent model to obtain their predicted modified solvent parameters [12].
- Calculate Similarity: For each candidate solvent, calculate the multi-dimensional Euclidean distance between its predicted parameters and the target parameters from Step 1.
- Rank and Select: Rank the candidate solvents based on this distance metric. Solvents with the smallest distances are predicted to have the most similar solvation properties and should be prioritized for experimental validation [12].
Protocol 2: Predicting Environmental Partitioning and Bioaccumulation
Purpose: To assess the environmental fate and bioaccumulation potential of a novel chemical entity by predicting its partition coefficients using ML-derived solute descriptors.
Workflow Diagram: Environmental Partitioning Prediction
Materials:
- Software: AbraLlama-Solute web application [12] or other validated DNN models [28].
- LSER Coefficients: Pre-established system coefficients (c, e, s, a, b, v, l) for the partition coefficients of interest (e.g., octanol-water, octanol-air) [28] [1].
Procedure:
- Predict Descriptors: Input the SMILES string of the novel chemical into the AbraLlama-Solute model to obtain its predicted solute descriptors (E, S, A, B, V) [12].
- Apply LSER Model: Insert the predicted descriptors into the appropriate LSER equation for the partition coefficient you wish to estimate (e.g., log Kow). For example:
log P = c + e·E + s·S + a·A + b·B + v·V[28] [12]. - Interpret Results: Use the calculated log P value (e.g., log Kow) to evaluate the compound's lipophilicity and potential for bioaccumulation according to established regulatory or scientific guidelines. This provides an early-risk assessment prior to synthesis and testing.
Protocol 3: Forecasting Chromatographic Retention
Purpose: To facilitate method development in analytical chemistry by predicting the gas chromatography (GC) or reversed-phase liquid chromatography (RPLC) retention of compounds.
Materials:
- Software: Tools for generating ML-based descriptors (e.g., SoluteML, SoluteGC) [32].
- Calibrated System: A pre-established LSER model for your specific chromatographic system (column, temperature, mobile phase) [32].
Procedure:
- System Characterization: First, establish an LSER model for your chromatographic system by measuring the retention of a set of standard compounds with experimentally known descriptors and regressing the data to obtain the system-specific coefficients (c, e, s, a, b, v, l) [32].
- Predict for Novel Analytes: For new analytes, use a machine learning method like SoluteML to estimate their solute descriptors [32].
- Calculate Retention: Input the ML-predicted descriptors into your characterized LSER model to forecast the retention behavior of the new analytes. Studies show that SoluteML descriptors provide a better fit for chromatographic models than group-contribution methods [32].
The Scientist's Toolkit: Essential Research Reagent Solutions
Table 2: Key Reagents, Databases, and Software for ML-Driven LSER Research
| Item Name | Type | Function & Application |
|---|---|---|
| UFZ-LSER Database [1] | Database | A primary source for experimentally derived solute descriptors for ~8,000 chemicals. Serves as the gold-standard dataset for training and validating ML models. |
| AbraLlama-Solute & Solvent [12] | Software/Model | Fine-tuned LLMs that predict Abraham solute descriptors and modified solvent parameters directly from SMILES strings. Available via Hugging Face for community use. |
| ChemLLaMA [12] | Software/Model | A specialized version of the LLaMA model for cheminformatics, which serves as the foundation for the AbraLlama models. |
| SoluteML & SoluteGC [32] | Software/Model | Machine learning and group contribution-based models for estimating solute descriptors. SoluteML generally shows superior performance for chromatographic applications. |
| Modified Solvent Parameters (e₀, s₀, a₀, b₀, v₀) [12] | Data/Methodology | A version of Abraham solvent parameters regressed with a zero intercept. Enables direct and more straightforward comparison of solvation properties between different solvents. |
| GUSAR Software [33] | Software | A tool for generating both quantitative (QSAR) and qualitative (SAR) models, useful for predicting interactions with biological "antitargets" to assess potential adverse drug reactions. |
The integration of machine learning with the established LSER framework marks a significant advancement for rational selection in chemical research and development. The protocols outlined herein provide a practical roadmap for scientists to leverage ML-predicted molecular descriptors for high-throughput tasks such as solvent screening, environmental fate prediction, and chromatographic method development. The current generation of models, including AbraLlama and specialized DNNs, already delivers accuracy that is competitive with traditional methods, particularly for complex molecules [28] [12].
Future progress in this field will likely focus on several key areas. Improving model interpretability through explainable AI (XAI) will be crucial for building trust and providing deeper chemical insights, much like the interpretable TMACC descriptors did for earlier QSAR models [34] [35]. Furthermore, the expansion of high-quality, experimental training data and the exploration of hybrid models that combine the strengths of different descriptor types—such as quantum chemical descriptors with those learned by ML—promise to enhance predictive performance and extend the applicability domain to an even broader range of chemicals [36]. As these tools evolve and become more accessible, they will undoubtedly become an indispensable component of the modern scientist's toolkit, accelerating innovation in drug development and sustainable chemistry.
Overcoming Common Challenges: Ensuring Accuracy and Reproducibility in Descriptor Determination
Addressing Data Gaps and Limited Experimental Data for Novel Solutes
The characterization of novel solutes is fundamentally limited by a critical challenge: a vast chemical landscape exists for which comprehensive experimental property data is absent. This data gap is particularly acute in the early stages of drug development and environmental risk assessment, where the experimental determination of key properties for thousands of candidate molecules is impractical due to time, cost, and ethical constraints, especially for biopartitioning processes [37]. The solvation parameter model, a specific form of Linear Free Energy Relationship (LFER), provides a robust framework to address this challenge [38] [37]. It characterizes the transfer of neutral compounds between phases using a fixed set of six solute descriptors that represent specific molecular interactions. Unlike some Quantitative Structure-Property Relationship (QSPR) models that use abstract descriptors, these descriptors have a clear chemical interpretation, facilitating term-by-term comparison across different systems [38] [37]. This application note details integrated theoretical and experimental protocols for determining these descriptors, thereby enabling the prediction of critical biophysical and environmental properties for novel solutes.
Theoretical and Computational Approaches
For compounds that are unavailable for experiment or yet to be synthesized, computational methods are the primary tool for obtaining solute descriptors.
Quantum Chemical Calculations
Physics-based computational methods, such as quantum chemistry, can predict descriptor values ab initio. The COnductor-like Screening MOdel for Realistic Solvents (COSMO-RS) is one such method that combines quantum theory with statistical thermodynamics to simulate solvation effects [39] [38]. It has been successfully employed to predict key properties like the n-octanol/water partition coefficient (logKOW), which is crucial for understanding bioaccumulation potential [39]. For example, a study on Per- and polyfluorinated alkyl substances (PFAS) used COSMO-RS to predict logKOW for over 4,000 compounds, successfully filling critical data gaps and confirming the role of fluorine atoms in enhanced bioaccumulation [39].
Machine Learning and Data-Driven Modeling
Machine learning (ML) offers a powerful complementary approach by building models that correlate molecular structure with descriptor values or directly with target properties.
- Consensus Modeling: Combining multiple ML algorithms (e.g., Artificial Neural Networks, Random Forest, Extreme Gradient Boosting) often yields superior performance and robustness compared to a single model [40].
- Quality-Oriented Data Selection: The performance of a data-driven model is intrinsically limited by the quality of its training data [40]. A model's observed performance on a test set cannot be better than the internal error of that test set. Therefore, implementing a statistical validation process to extract the most accurate subset from large, publicly available databases is critical for developing top-performing prediction models [40].
- Descriptor Relevance: The choice of molecular representation significantly impacts model performance. As shown in a study on drug solubility in lipids, different descriptor sets—such as 2D/3D descriptors, Abraham parameters, Extended Connectivity Fingerprints (ECFPs), and the Smooth Overlap of Atomic Positions (SOAP)—offer varying levels of predictive accuracy and interpretability [41].
Table 1: Comparison of Molecular Descriptor Types for Predictive Modeling
| Descriptor Type | Description | Advantages | Limitations |
|---|---|---|---|
| 2D & 3D Descriptors [41] | Numerical representations of topological and geometrical molecular features. | Good interpretability for global molecular properties (e.g., polarity, size). | Limited in providing atomistic understanding of local chemical environments. |
| Abraham Solvation Parameters [41] | Five numerical values encoding molar volume, H-bond acidity/basicity, etc. [41] | Clear chemical interpretation; suitable for Linear Free Energy Relationships. | Require experimental data or estimations for determination. |
| Extended Connectivity Fingerprints (ECFPs) [41] | Represents atomic environments based on the presence of substructures. | Excellent for similarity searching and capturing connectivity. | May not fully account for complex electronic effects like mesomerism. |
| Smooth Overlap of Atomic Positions (SOAP) [41] | A complex geometrical fingerprint describing local atomic densities. | High predictive accuracy; atom-centered weights allow for interpretation of local molecular motifs. | Computationally more intensive than simpler descriptors. |
Experimental Protocols for Descriptor Determination
Chromatographic methods are the preferred experimental technique for determining solute descriptors due to their rapidity, low sample requirement, and ability to handle impure samples [38]. The following protocols provide detailed methodologies for this purpose.
Determination of Solute Descriptors Using Chromatographic Methods
This protocol outlines the steps for determining the six solute descriptors (E, S, A, B, V, L) using a combination of gas chromatography (GC) and reversed-phase liquid chromatography (RPLC).
3.1.1 Principle
The retention of a solute in a chromatographic system is related to its free energy of partitioning between the mobile and stationary phases. The solvation parameter model expresses this relationship for a given chromatographic system as [38] [37]:
log k = c + eE + sS + aA + bB + vV
The system constants (c, e, s, a, b, v) are determined by calibrating the system with a set of compounds with known descriptors. Once these constants are known, the descriptors for an unknown solute can be determined from its retention factor (k) in multiple calibrated systems with complementary selectivity [38].
3.1.2 Materials and Equipment
- Gas chromatograph and Reversed-Phase Liquid Chromatograph with detection systems.
- A minimum of 3-5 GC columns with different stationary phases (e.g., poly(dimethylsiloxane), poly(ethylene glycol)) and 3-5 RPLC columns with different bonded ligands (e.g., C18, cyano, phenyl).
- Solvents: HPLC-grade methanol, water, acetonitrile, and hexane.
- A set of 20-30 calibration compounds with robustly known solute descriptors, covering a wide range of chemical properties [38].
3.1.3 Procedure
- System Calibration:
- For each chromatographic system (a specific column/mobile phase combination), inject the calibration mixture and measure the retention factor (k) for each compound.
- Using multiple linear regression, fit the measured
log kvalues against the known descriptors (E, S, A, B, V) of the calibration compounds to determine the system constants (c, e, s, a, b, v). - Statistically validate the model using metrics like R² (goodness of fit) and Q² (predictive ability).
- Determination of Unknown Descriptors:
- Inject the novel solute into the same set of calibrated chromatographic systems and measure its retention factor in each.
- The descriptors for the unknown solute are then determined by solving the set of equations from the different systems. This is typically done using a multi-parameter optimization procedure (e.g., the Solver method in Microsoft Excel) that minimizes the sum of squares of the differences between the measured and calculated
log kvalues across all systems [38].
3.1.4 Key Considerations
- System Selection: The selected chromatographic systems must have complementary selectivity to ensure the system constants are not correlated. This is crucial for obtaining a unique and robust solution for the unknown descriptors [38].
- Descriptor V and E: The V descriptor (McGowan's characteristic volume) is trivially calculated from molecular structure, and the E descriptor (excess molar refraction) can be calculated for liquids from their refractive index [38]. These can be fixed during the optimization process.
- Data Quality: Use chromatographic data with high reproducibility. The selection of calibration compounds with reliable, experimentally determined descriptors is paramount for accurate results [38].
Determining Solute Descriptors Experimentally
Protocol for Determining Abraham Solute Descriptors Using a Multi-Method Approach
For the highest accuracy, descriptors should be determined using a combination of techniques beyond chromatography.
3.2.1 Principle This protocol leverages multiple experimental methods—gas-liquid partition, liquid-liquid partition, and solubility measurements—to overdetermine the solute descriptors, leading to more robust and reliable values [38].
3.2.2 Materials and Equipment
- Gas chromatograph.
- Equipment for shake-flask experiments (separatory funnels, vials).
- UV-Vis spectrophotometer or HPLC for concentration analysis.
- Solvents: n-Hexadecane, n-octanol, water, cyclohexane.
3.2.3 Procedure
- Determine the L Descriptor: This is the gas-liquid partition coefficient on n-hexadecane at 25°C. It is best measured by GC using n-hexadecane as the stationary phase [38].
- Determine Water-Solvent Partition Coefficients: Use the shake-flask method to measure the partition coefficient (P) for the solute in at least two solvent systems, most commonly the n-octanol-water system (log KOW) and the cyclohexane-water system.
- The solvation parameter model for water-solvent partitioning is:
log P = c + eE + sS + aA + bB + vV[38].
- The solvation parameter model for water-solvent partitioning is:
- Measure Water Solubility: Determine the molar solubility of the solute in water (SW) at 25°C using a validated method (e.g., shake-flask). The model is applied as:
log SW = c + eE + sS + aA + bB + vV[37]. - Data Integration: With experimental data for L, multiple log P values, and log SW, the descriptors (E, S, A, B) for the solute are determined by fitting all the experimental data simultaneously using a multi-parameter optimization.
Essential Research Reagent Solutions
The following reagents and materials are fundamental for the experimental determination of solute descriptors.
Table 2: Key Research Reagents and Materials
| Reagent/Material | Function/Application | Specific Example/Note |
|---|---|---|
| n-Hexadecane | Used as the stationary phase in GC for the direct determination of the L descriptor (gas-hexadecane partition coefficient) [38]. | Must be of high purity (>99%) to ensure accurate retention time measurements. |
| n-Octanol and Water | Forms the biphasic system for the shake-flask determination of the n-octanol-water partition coefficient (log KOW), a fundamental property for QSPR models [38]. | Both solvents should be saturated with each other before use. |
| Cyclohexane and Water | Provides a complementary solvent system to n-octanol-water for liquid-liquid partition experiments, offering different selectivity for parameter determination [38]. | Useful for characterizing H-bond basicity (B) of solutes. |
| Chromatographic Columns | The core components for descriptor determination via GC and LC. Different phases are required to achieve complementary selectivity [38]. | GC: Poly(dimethylsiloxane), poly(ethylene glycol). LC: C18, cyano, phenyl. |
| Calibration Compound Set | A varied group of compounds with well-characterized descriptor values is essential for calibrating chromatographic systems and validating methods [38]. | Should include alkanes, aromatics, ketones, alcohols, acids, and bases to cover a wide range of interactions. |
Data Integration and Property Prediction Workflow
Once a robust set of solute descriptors is obtained, either experimentally or computationally, they can be deployed to predict a wide array of biophysical and environmental properties.
From Descriptors to Property Predictions
The true power of the solvation parameter model lies in its ability to use a single set of descriptors to predict numerous properties. Each target property (e.g., skin permeation, blood-brain barrier permeability) has a pre-established LFER equation with its own set of system constants [37]. By plugging the solute descriptors into these equations, researchers can obtain quantitative predictions for these critical, and often difficult-to-measure, properties. This approach has been successfully used to predict properties such as octanol-water partition coefficients, water solubility, Henry's Law constant, and soil adsorption coefficients for thousands of compounds, effectively filling massive data gaps in environmental and pharmaceutical science [39] [37].
Managing Computational Cost and Complexity in Free Energy Calculations
Free energy calculations are indispensable tools in computational chemistry and drug discovery, providing critical insights into molecular interactions, solvation, and binding affinity [42]. However, achieving chemical accuracy (errors < 1 kcal/mol) remains challenging due to the inherent trade-offs between computational cost, model complexity, and statistical precision [43] [44]. This challenge is particularly acute within Linear Solvation Energy Relationship (LSER) research, where high-quality free energy data is essential for deriving accurate solute descriptors but is often constrained by practical computational limits.
The LSER model, as developed by Abraham, correlates a solute's free-energy-related properties with its six molecular descriptors (Vx, L, E, S, A, B) [8] [9]. The accuracy of these descriptors hinges on the quality of the experimental or computational thermodynamic data used to derive them. Computational methods, particularly those based on molecular dynamics, offer a powerful route to generating this data, but researchers must navigate a complex landscape of methodological choices that directly impact both the cost and reliability of the resulting LSER parameters.
This application note provides a structured framework for managing computational expenses while maintaining the accuracy required for rigorous LSER descriptor determination. We detail specific protocols, provide benchmark data, and visualize workflows to guide researchers in making informed decisions that align computational investment with scientific objectives.
Selecting an appropriate free energy method is the primary step in balancing cost and accuracy. The table below compares the dominant approaches, highlighting their applicability to LSER research.
Table 1: Strategic Overview of Free Energy Calculation Methods
| Method | Theoretical Basis | Computational Cost | Typical Accuracy | Best for LSER Applications |
|---|---|---|---|---|
| Thermodynamic Integration (TI) | Numerical integration of ∂H/∂λ [45]. | Medium to High | 0.5 - 1.0 kcal/mol [44] | High-accuracy solvation free energies for descriptor refinement. |
| Free Energy Perturbation (FEP) | Zwanzig equation via exponential averaging. | Medium | ~1.0 kcal/mol | Relative solvation free energies for congeneric series. |
| Bennett Acceptance Ratio (BAR) | Optimal estimator using data from both end states [45]. | Medium | ~0.5 - 1.0 kcal/mol | Efficient calculation of partition coefficients (log P). |
| Machine Learning Force Fields (MLFF) | ML-potentials with QM accuracy; alchemical pathways [43] [42]. | Very High | < 1.0 kcal/mol [43] [42] | Generating benchmark-quality data for key reference compounds. |
| Energy Representation (ER) Theory | Free-energy difference via distribution functions [46]. | Low | ~1.0 kcal/mol [46] | Rapid screening of large compound sets for initial descriptor estimation. |
For LSER studies, the choice of method often depends on the specific descriptor being targeted. For example, the gas-to-solvent partition coefficient (log K) is directly related to the solvation free energy, making TI and MLFFs excellent for refining the E, S, A, and B descriptors with high fidelity [43] [9]. In contrast, methods like ER theory can be valuable for high-throughput estimation of descriptors for large compound libraries where lower cost is a priority [46].
Detailed Protocols for Key Calculations
Protocol: Solvation Free Energy via Thermodynamic Integration
Application in LSER: This protocol is the cornerstone for obtaining precise solvation free energies, which are fundamental for correlating and validating LSER molecular descriptors [9]. Accurate solvation free energies allow for the determination of system-specific coefficients in LSER equations.
Workflow Overview:
Step-by-Step Methodology:
System Preparation
- Structure: Obtain 3D coordinates for the solute (e.g., from a database or quantum chemistry optimization).
- Solvation: Solvate the single solute molecule in a cubic box of water (e.g., TIP3P model) with a minimum of 1.0 nm distance between the solute and the box edge.
- Parameterization: Assign force field parameters (e.g., GAFF2 for organic molecules) and partial charges (e.g., via RESP fitting). For LSER context, ensure consistency in parameterization across all molecules in a series.
Equilibration
- Energy minimize the system until the maximum force is below 1000 kJ/mol/nm.
- Perform equilibration in the NVT ensemble (constant Number of particles, Volume, and Temperature) for 100 ps at 298 K.
- Perform equilibration in the NPT ensemble (constant Number of particles, Pressure, and Temperature) for 100 ps at 1 bar to achieve the correct solvent density.
TI Simulation Series
- Set up a series of independent simulations at different λ values, typically 12-21 windows (e.g., λ = 0, 0.05, 0.1, ..., 0.95, 1.0).
- Use a soft-core potential for Lennard-Jones interactions to avoid singularities as atoms are decoupled. The potential form, as implemented in GROMACS, is:
U(λ,r) = 4ϵλⁿ [ (αₗⱼ(1-λ)ᵐ + (r/σ)⁶)⁻² - (αₗⱼ(1-λ)ᵐ + (r/σ)⁶)⁻¹ ][42] - For each λ window, run a production simulation in the NPT ensemble (298 K, 1 bar) for a sufficient duration (see Section 4 on Cost Control).
Analysis and Integration
- For each λ window, calculate the ensemble average of ∂H/∂λ.
- Use numerical integration (e.g., the trapezoidal rule) over λ to compute the total free energy change:
ΔG = ∫₀¹ <∂H/∂λ>λ dλ[45] - The result is the solvation free energy, ΔGsolv, which is related to the gas-to-solvent partition coefficient via log K = -ΔGsolv / (RT ln(10)) [9].
Protocol: Relative Binding Affinity via Alchemical Transformation
Application in LSER: While not directly used in standard LSER, this protocol is crucial for computational drug discovery. It can be integrated with LSER analyses to understand how binding free energies correlate with solute descriptors, potentially leading to specialized LSER models for protein-ligand interactions.
Workflow Overview:
Step-by-Step Methodology:
- Design Thermodynamic Cycle: Construct a cycle that connects the binding of ligand A and ligand B to the same protein through alchemical paths [45] [47].
- Dual Transformation Setup: Set up two parallel transformation simulations: one where ligand A is transformed to B while bound to the protein, and another where the same transformation occurs in free solution.
- Simulation Parameters: Use a similar multi-window approach as the TI protocol, with a soft-core potential. Ensure the core of the ligand that is common between A and B is restrained to improve convergence [44].
- Free Energy Estimation: Use the Bennett Acceptance Ratio (BAR) or the Multistate BAR (MBAR) method to compute the free energy change for each leg, ΔGbound and ΔGsolvent [45]. The relative binding affinity is then ΔΔGbind = ΔGbound - ΔGsolvent.
Quantitative Benchmarks and Cost Control
Empirical data is essential for planning computationally feasible projects without sacrificing scientific rigor. The following table synthesizes performance data from recent studies.
Table 2: Benchmark Data for Free Energy Calculations: Accuracy vs. Cost
| System Type | Method | Simulation Length/λ | Total Wall Clock (GPU hrs) | Mean Absolute Error (MAE) | Key Finding for Cost Control | ||
|---|---|---|---|---|---|---|---|
| Organic Molecule Hydration | MLFF [43] | Not Specified | Very High | < 1.0 kcal/mol | Achieves QM accuracy; use for generating benchmark data for key LSER compounds. | ||
| Protein-Ligand Binding | TI (AMBER) [44] | < 1 ns | ~Hours | ~1.0 kcal/mol | Sub-nanosecond sampling can be sufficient for many perturbations. | ||
| Protein-Ligand Binding (Large ΔΔG) | TI (AMBER) [44] | ~2 ns | ~Tens of Hours | Higher Error | Perturbations with | ΔΔG | > 2.0 kcal/mol show higher errors and require more sampling. |
| Host-Guest Binding | ER Theory [46] | N/A (No intermediate states) | Low | ~1.0 kcal/mol | Avoids costly intermediate states; excellent for screening. |
Actionable Recommendations for Cost Management:
- Ligand Perturbations: Keep perturbations small. For relative calculations, prioritize mutations with predicted |ΔΔG| < 2.0 kcal/mol, as larger changes are less reliable and require significantly more sampling to converge [44].
- Sampling Duration: For many systems, especially those with small perturbations, shorter simulations (1-2 ns per λ window) can yield accurate results. Start with shorter runs and extend sampling only if error analysis indicates poor convergence [44].
- Window Selection: For TI, 16-21 λ windows often provide a good balance. Using Gaussian quadrature for λ spacing does not consistently improve accuracy enough to justify the reduced flexibility in analysis [44].
- System Sizing: Minimize the size of the solvent box and the overall system while ensuring the solute does not interact with its own periodic images. This directly reduces the computational cost per simulation step.
The Scientist's Toolkit
Table 3: Essential Research Reagents and Computational Tools
| Tool / Resource | Type | Primary Function | Relevance to LSER Research |
|---|---|---|---|
| GROMACS [45] [47] | MD Software | High-performance molecular dynamics simulations. | Core engine for running TI, FEP, and BAR calculations. |
| AMBER [44] | MD Software | Suite of biomolecular simulation programs. | Industry-standard for protein-ligand binding free energy calculations. |
| pmx [47] | Toolbox | Scripts for free energy calculation setup/analysis. | Automates generation of hybrid structures and topologies for alchemical mutations. |
| alchemlyb [44] | Analysis Library | Python library for free energy estimation. | Robust extraction of free energies from TI and FEP simulations using BAR/MBAR. |
| COSMO-RS [9] | Solvation Model | Predicts thermodynamics based on quantum chemistry. | Provides an alternative, QM-based route to solvation properties for LSER. |
| LSER Database [8] [9] | Database | Repository of experimental solute descriptors and partition data. | Essential for validation and training of computational models. |
| Organic_MPNICE [43] | Machine Learning Force Field | MLP trained on organic molecules. | Generate high-accuracy reference data for critical LSER benchmark compounds. |
Managing computational cost and complexity in free energy calculations is not about minimizing effort, but about optimizing resource allocation to maximize the scientific return. For LSER research, this means employing rapid screening methods like ER theory for large libraries [46], while reserving high-fidelity methods like TI and MLFFs for key molecules that define the chemical space or require benchmark accuracy [43] [44].
The protocols and data presented here provide a concrete foundation for designing efficient computational campaigns. By aligning method selection with the specific goals of an LSER study and applying strict cost-control measures—such as limiting perturbation sizes and carefully calibrating simulation length—researchers can generate the high-quality, thermodynamic data needed to refine and expand the invaluable LSER framework, pushing the boundaries of predictive molecular science.
The determination of Linear Solvation Energy Relationship (LSER) solute descriptors is a cornerstone of predictive modeling in pharmaceutical and environmental chemistry. These descriptors, which quantify key molecular interaction properties, are used to predict critical physicochemical parameters such as partition coefficients, solubility, and bioavailability [28]. However, the reliability of these predictions hinges on the reproducibility and robustness of the descriptor determination process. Traditional fragmental-based quantitative structure-property relationship (QSPR) methods often struggle with complex chemical structures containing multiple functional groups, leading to problematic predictions and limited reproducibility [28]. This application note establishes a comprehensive protocol integrating ensemble-based methods and rigorous uncertainty quantification to address these critical limitations, providing researchers with a standardized framework for generating reliable, reproducible LSER solute descriptors.
Theoretical Framework: Uncertainty in Descriptor Prediction
Typology of Uncertainties in LSER Models
In the context of LSER descriptor prediction, it is essential to distinguish between two fundamental types of uncertainty that impact reproducibility:
- Aleatoric Uncertainty: Arises from inherent, irreducible noise in the system, such as experimental measurement errors, subtle variations in sample quality, or intrinsic sensor noise. This uncertainty persists regardless of how much data is collected [48].
- Epistemic Uncertainty: Stems from limited knowledge, incomplete data, or model inadequacy. This includes discrepancies between model simulations and experimental data, as well as numerical uncertainty introduced by machine learning models. Unlike aleatoric uncertainty, epistemic uncertainty can be reduced by collecting more relevant data or improving model structures [48].
The confusion between these uncertainty types often leads to inappropriate methodological choices, ultimately compromising the reproducibility of research findings. Ensemble-based methods provide a mathematical framework for quantifying and managing both forms of uncertainty within a unified paradigm.
The Role of Ensemble Methods
Ensemble methods leverage multiple models or predictions to create a more robust, accurate consensus estimate than any single model could provide. In LSER descriptor prediction, ensembles help mitigate epistemic uncertainty by aggregating knowledge across diverse model architectures and training regimes. The variation in predictions across ensemble members provides a direct quantitative measure of uncertainty, offering researchers crucial information about prediction reliability [48] [28].
Quantitative Comparison of LSER Prediction Approaches
The table below summarizes the performance characteristics of different computational approaches for predicting LSER solute descriptors, highlighting the comparative advantages of ensemble-based deep learning methods.
Table 1: Performance Comparison of LSER Solute Descriptor Prediction Methods
| Methodology | Prediction Accuracy (RMSE Ranges) | Key Strengths | Key Limitations | Suitability for Complex Molecules |
|---|---|---|---|---|
| Experimental Determination | N/A (Reference standard) | Direct measurement; High accuracy for specific compounds | Time-consuming; Limited to ~8,000 known chemicals; Resource-intensive | Excellent for measured compounds, but impossible for novel structures |
| Fragmental QSPR (LSERD) | ~1.0 log unit for Kow datasets [28] | Fast predictions; Free online platform availability [28] | Problematic for larger structures with multiple functional groups [28] | Limited - errors increase with structural complexity |
| Commercial Software (ACD/Absolv) | ~1.0-1.3 log units for partition coefficients [28] | User-friendly interface; Commercial support | Struggles with complex chemical structures; Commercial license required | Limited - similar limitations to fragmental approaches |
| Deep Neural Networks (Singletask) | 0.11-0.46 for individual solute descriptors [28] | Superior for complex structures; Complementary to other methods [28] | Requires significant computational resources; Dependent on data quality | Excellent - overcomes limitations of group contribution methods |
| Deep Neural Networks (Multitask) | Slightly higher than singletask models [28] | Simultaneous prediction of multiple descriptors | Less accurate than singletask for small datasets [28] | Good, but singletask preferred for small datasets |
Experimental Protocol: Ensemble-Based Deep Learning for Solute Descriptors
Research Reagent Solutions and Computational Materials
Table 2: Essential Research Reagents and Computational Tools for Ensemble LSER Prediction
| Item/Resource | Specification/Version | Function/Purpose | Availability |
|---|---|---|---|
| Abraham Absolv Dataset | Curated version (2025) | Primary training data containing ~7,881 chemical structures with experimental descriptors [28] | Research institutions |
| UFZ-LSER Database | v4.0 (2025) [1] | Reference database for experimental solute descriptors and LSER calculations | Publicly available online |
| Python Deep Learning Stack | TensorFlow/PyTorch with RDKit | Model development and molecular graph representation | Open source |
| Graph Neural Network Framework | Custom implementation | Handles multidimensional chemical structure data [48] | Research code |
| Bayesian Optimization Tools | Monte Carlo Dropout, Laplace Approximation [48] | Uncertainty quantification in neural network predictions | Open source libraries |
| Data Augmentation Pipeline | Tautomer-based generator [28] | Expands training dataset using chemical tautomers to improve model robustness | Custom implementation |
Detailed Workflow Protocol
Step 1: Data Curation and Preprocessing
- Begin with the Abraham Absolv dataset containing 7,881 chemicals [28].
- Apply rigorous curation: exclude metals, organometallics, and gases (e.g., argon, nitrogen, methane).
- Identify and correct structural errors using automated validation checks.
- Apply tautomer-based data augmentation strategies to systematically expand the training set, enhancing model robustness [28].
- Partition the final curated dataset (6,364 chemicals) into training (70%), validation (15%), and test (15%) sets using stratified sampling to ensure representative chemical diversity.
Step 2: Molecular Graph Representation
- Represent each chemical structure as a graph where atoms correspond to nodes and bonds to edges.
- Implement featurization that encodes atomic properties (element type, hybridization, formal charge) and bond characteristics (bond type, conjugation).
- This graph representation enables the model to capture complex structural relationships that fragment-based methods miss, particularly for chemicals with multiple functional groups [28].
Step 3: Ensemble Model Architecture Configuration
- Implement both singletask and multitask deep neural network (DNN) architectures for comparative analysis.
- For singletask models: develop separate DNNs for each solute descriptor (E, S, A, B, V, L) to maximize predictive accuracy for individual parameters [28].
- For multitask models: implement a shared backbone architecture with task-specific heads to leverage correlations between descriptors.
- Prioritize singletask models for final deployment, as they demonstrate superior performance (RMSE 0.11-0.46) compared to multitask approaches, particularly given the limited dataset size [28].
Step 4: Training with Uncertainty Quantification
- Incorporate Bayesian Neural Network tools (Monte Carlo Dropout, Laplace Approximation) directly into the training process to enable uncertainty estimation [48].
- Implement iterative training cycles with uncertainty-guided data selection to prioritize informative samples.
- Apply regularization techniques to prevent overfitting and ensure generalizability to novel chemical structures.
Step 5: Prediction and Uncertainty Propagation
- Generate ensemble predictions by aggregating outputs from multiple model instances trained with different initializations.
- Quantify total prediction uncertainty by decomposing variance into aleatoric (data inherent) and epistemic (model knowledge) components [48].
- Propagate descriptor uncertainties through subsequent LSER equations to provide confidence intervals for predicted partition coefficients and other physicochemical properties.
Step 6: Validation and Model Updating
- Validate predictions against three different datasets of experimentally determined partition coefficients (Kow, Koa, Kwa) and chromatographic retention data [28].
- Establish a model updating protocol where new experimental data is continuously incorporated to refine predictions and reduce epistemic uncertainty over time [48].
- Deploy the trained ensemble models as a complementary prediction tool alongside existing QSPR approaches to overcome limitations of individual methods [28].
LSER Descriptor Prediction Workflow
Uncertainty Quantification Protocol
Bayesian Framework Implementation
The quantification of uncertainty in ensemble-based LSER predictions follows a structured Bayesian framework:
Uncertainty Quantification Framework
Uncertainty Propagation in LSER Applications
When using predicted solute descriptors in LSER equations for partition coefficient estimation, uncertainty propagation follows a systematic protocol:
Input Uncertainty Characterization: Document the variance and covariance structure of all predicted solute descriptors (E, S, A, B, V, L) from the ensemble model outputs.
LSER Equation Application: Apply the standard LSER equations for the target system:
Monte Carlo Uncertainty Propagation: Perform Monte Carlo simulations that:
- Sample from the probability distributions of each solute descriptor
- Calculate the resulting distribution of the target property (SP)
- Quantify the 95% prediction intervals for all reported values
Reporting Standards: Clearly distinguish between predictive uncertainty (for new compounds) and interpolative uncertainty (for compounds within the model's training domain).
The integration of ensemble-based methods with rigorous uncertainty quantification represents a paradigm shift in LSER solute descriptor determination. This protocol provides researchers with a standardized approach for generating reproducible, reliable predictions that honestly communicate their limitations through comprehensive uncertainty estimates. By adopting these ensemble methods and the accompanying uncertainty quantification framework, researchers in drug development and environmental chemistry can make more informed decisions based on transparent, statistically rigorous predictions, ultimately accelerating discovery while maintaining scientific rigor. The implementation of these protocols as complementary tools alongside existing QSPR approaches offers the most robust pathway forward for predictive modeling in complex chemical spaces.
Partition coefficients are fundamental parameters in pharmaceutical and environmental sciences, quantifying how a solute distributes itself between two immiscible phases at equilibrium. Accurate prediction of these coefficients is critical for assessing drug bioavailability, environmental fate, and chemical exposure risks. Linear Solvation Energy Relationship (LSER) models have emerged as powerful, mechanistically grounded tools for this purpose. These models describe partitioning behavior using molecular descriptors that represent specific types of solute-solvent interactions. This application note provides detailed protocols for applying and optimizing LSER approaches for two key application areas: drug-polymer partitioning for container closure systems and environmental partitioning for ecological risk assessment.
Theoretical Foundation of LSERs
Linear Solvation Energy Relationships model partition coefficients as a linear combination of solute descriptors that capture the molecule's capacity for different intermolecular interactions. The standard Abraham LSER equation is expressed as:
[ \log K = c + eE + sS + aA + bB + vV ]
Here, (K) is the partition coefficient for a specific system (e.g., (K_{OW}) for octanol-water), and the capital letters represent the solute's descriptors [49]:
- (E): Excess molar refraction, modeling polarizability interactions from n- and π-electrons.
- (S): Polarity/polarizability, representing dipole-dipole and dipole-induced dipole interactions.
- (A) and (B): Hydrogen-bond acidity and basicity, respectively.
- (V): McGowan's characteristic volume (in cm³/mol/100), related to cavity formation.
The lower-case letters ((c), (e), (s), (a), (b), (v)) are system-specific coefficients determined by regression against experimental data. The strength of this approach lies in its ability to deconstruct complex solvation phenomena into physically meaningful contributions [49].
Protocol 1: Drug-Polymer Partitioning for Leachables Assessment
Background and Application Context
Predicting the partitioning of potential leachables between plastic materials (e.g., Low-Density Polyethylene - LDPE) and pharmaceutical solutions is essential for chemical safety risk assessments of container closure systems. Equilibrium partition coefficients ((K_{i,LDPE/W})) dictate the maximum accumulation of a leachable in a drug product, directly influencing patient exposure estimates [50].
Detailed Experimental Protocol for LDPE/Water Partitioning
Materials and Reagents
Table 1: Key Research Reagent Solutions for Drug-Polymer Partitioning
| Reagent/Material | Specification | Function in Protocol |
|---|---|---|
| Low-Density Polyethylene (LDPE) | Purified by solvent extraction (e.g., hexane, ethanol) [50] | Polymer phase representing container material |
| Phosphate Buffered Saline (PBS) | pH 7.4, or other physiologically relevant pH | Aqueous phase simulating drug product |
| Water-Ethanol Simulating Solvents | Ethanol volume fractions (e.g., 0.1, 0.2, 0.35, 0.5) [51] | Mimics extraction strength of actual drug product |
| Test Compounds (Solute) | 159+ compounds spanning chemical diversity [50] | Model leachable substances for calibration |
| HPLC-MS System | Reverse-phase C18 column, mass spectrometry detector | Analytical quantification of solute concentrations |
Step-by-Step Workflow
- Polymer Preparation: Cut LDPE into disks or sheets of precise dimensions (e.g., diameter, thickness). Purify via solvent extraction to remove manufacturing additives and impurities. Dry to constant weight under controlled conditions [50].
- Solute Loading: Load polymer disks with individual test solutes by equilibration in concentrated solute solutions or, where necessary, by melt loading. Verify homogeneous loading via analytical techniques [50].
- Partitioning Experiment: Place pre-loaded polymer disks into vials containing the aqueous or water-ethanol medium. Ensure a suitable phase ratio (e.g., polymer mass to solution volume). Seal vials to prevent evaporation.
- Equilibration: Agitate vials in a temperature-controlled incubator (e.g., 37°C) until equilibrium is reached. This may require days to weeks; monitor kinetics in preliminary studies.
- Sampling and Analysis: Sample the solution phase at equilibrium. Quantify solute concentration using a calibrated HPLC-MS method. Analyze the polymer phase post-experiment if required, using extraction and HPLC-MS.
- Data Calculation: Calculate the partition coefficient using the formula: ( \log K{i,LDPE/W} = \log (C{LDPE} / C{W}) ) where (C{LDPE}) is the solute concentration in the polymer and (C_W) is the concentration in the aqueous phase.
Building the LSER Model
Upon obtaining experimental (\log K{i,LDPE/W}) values for a wide array of solutes, perform multilinear regression to calibrate the system-specific LSER equation [50]: [ \log K{i,LDPE/W} = -0.529 + 1.098E - 1.557S - 2.991A - 4.617B + 3.886V ] This model, with its high accuracy (n=156, R²=0.991, RMSE=0.264), can then predict partitioning for new, untested leachables based solely on their molecular descriptors [50].
Workflow Visualization
Diagram 1: Workflow for drug-polymer partitioning studies in pharmaceutical development.
Protocol 2: Environmental Partitioning for Ecological Risk
Background and Application Context
Tracking the environmental fate of chemicals—such as pharmaceuticals, illicit drugs, and industrial contaminants—requires reliable partition coefficients between air, water, and organic phases. Key parameters include the octanol-water ((\log K{OW})), octanol-air ((\log K{OA})), and air-water ((\log K_{AW})) partition coefficients [17]. These are vital for modeling transport, bioaccumulation, and exposure.
Computational Protocol for Predicting Environmental Partitioning
Materials and Software Tools
Table 2: Key Computational Tools for Environmental Partitioning Prediction
| Tool/Resource | Type | Function and Key Insight |
|---|---|---|
| Quantum Chemical (QM) Methods(e.g., COSMO-type) | First-Principles Calculation | Calculates solvation free energy ((\Delta G_{solv})) in different phases. Superior for complex molecules (e.g., drugs) where QSPRs are unreliable [17] [49]. |
| UFZ-LSER Database | Online Database & Calculator | Provides solute descriptors (E, S, A, B, V) and calculates partition coefficients for numerous environmental systems [1]. |
| QSPR Software Suites(e.g., IFSQSAR, OPERA, EPI Suite) | Quantitative Structure-Property Relationship | Predicts properties from molecular structure. Consensus use of multiple tools is recommended to reduce uncertainty [52] [53]. |
| Experimental Database(Critically Evaluated) | Reference Data | Used to validate computational predictions. Essential for identifying model applicability domains [52]. |
Step-by-Step Workflow for Data-Poor Chemicals
- Problem Definition: Identify the chemical and the required partition coefficients ((\log K{OW}), (\log K{OA}), (\log K_{AW})) for the specific environmental model.
- Descriptor Acquisition: Obtain the solute's Abraham descriptors (E, S, A, B, V).
- Consensus Prediction:
- Input the molecular structure into multiple QSPR tools (e.g., IFSQSAR, OPERA, EPI Suite).
- For complex molecules like drugs, perform quantum chemical calculations of (\Delta G_{solv}) for transfer between phases [17].
- Collect all estimates (LSER, QSPR, QM) in a consolidated table.
- Uncertainty Assessment: Evaluate the variability between different predictive methods. For (\log K_{OW}), a variability of 1 log unit or more is common. Calculate the consolidated (mean) value and its standard deviation [53].
- Model Application: Use the consolidated partition coefficients in environmental fate models to predict distribution between air, water, soil, and biota.
Workflow Visualization
Diagram 2: Decision workflow for predicting environmental partitioning of chemicals.
Critical Data and Model Selection
Quantitative Comparison of Prediction Tools
Table 3: Performance and Use Cases for Partition Coefficient Prediction Methods
| Method | Reported Accuracy (RMSE) | Best Application Context | Key Limitations |
|---|---|---|---|
| Abraham LSER | RMSE ~0.26-0.31 for LDPE/Water [50] | Robust prediction for neutral, organic chemicals within descriptor space. Gold standard for polymer/solution. | Requires known solute descriptors; performance declines outside chemical domain [1]. |
| Quantum Chemical (COSMOtherm) | RMSE 0.65-0.93 log units (liquid/liquid) [15] | Complex, multifunctional, or data-poor molecules (e.g., drugs, PFAS). Mechanistic, descriptor-free. | High computational cost; requires expert knowledge [17]. |
| QSPR (ABSOLV) | RMSE 0.64-0.95 log units (liquid/liquid) [15] | High-throughput screening of neutral organics. Integrated descriptor estimation and prediction. | Uncertainty can be high for ions and complex structures; check applicability domain [52]. |
| QSPR (EPI Suite) | RMSE >> ABSOLV/COSMOtherm [15] | Preliminary screening and regulatory submission where specific models are accepted. | Lower accuracy for large, complex molecules; known to be unreliable for many drugs [17] [52]. |
| Consensus (WoE) | Variability <0.2 log units (consolidated) [53] | Reducing uncertainty for critical assessments. Combines strengths of multiple independent methods. | Requires multiple data sources; more resource-intensive. |
Addressing Uncertainty and Applicability Domains
Uncertainty in predicted partition coefficients is inherent. Key strategies to manage it include:
- Consensus Modeling: Combining multiple estimates (experimental and computational) to produce a consolidated value. For (\log K_{OW}), the mean of at least five valid data points from independent methods can reduce variability to within 0.2 log units [53].
- Applicability Domain (AD) Checks: Always verify that the solute falls within the chemical space of the model's training set. IFSQSAR and OPERA provide explicit AD metrics [52].
- Special Cases: Be aware that ionizable organic chemicals (IOCs), per- and polyfluoroalkyl substances (PFAS), and chemicals with complex, multifunctional structures are particularly challenging for all predictive models and often require specialized approaches or experimental data [52].
LSER models provide a robust, mechanistically sound framework for predicting partition coefficients across pharmaceutical and environmental applications. The protocols outlined herein—ranging from experimental determination for drug-polymer systems to computational consensus for environmental contaminants—offer researchers a structured path to generate reliable, defensible data. By understanding the strengths and limitations of each method and strategically employing a weight-of-evidence approach, scientists can effectively tailor partitioning protocols to meet specific application needs, thereby enhancing the accuracy of safety and risk assessments.
Benchmarking Your Results: Validation Strategies and Cross-Method Comparison
Linear Solvation Energy Relationships (LSERs) are powerful predictive tools in environmental chemistry and pharmaceutical research for estimating partition coefficients of organic compounds. The robustness of these fitted models, however, is entirely dependent on rigorous internal validation procedures. Internal validation encompasses the statistical checks and cross-validation techniques used to evaluate model performance, ensure predictive reliability, and prevent overfitting. Within the broader protocol for determining LSER solute descriptors, validation represents a critical step that determines whether a developed model can be trusted for practical application in drug development and environmental risk assessment. This protocol details the specific methodologies for conducting comprehensive internal validation of LSER models, with particular emphasis on statistical metrics and cross-validation approaches that researchers must implement before model deployment.
Core Statistical Metrics for LSER Model Validation
When evaluating fitted LSER models, specific statistical parameters provide quantitative assessment of model accuracy and precision. The following metrics must be calculated and reported for any LSER model to establish its fundamental performance characteristics.
Table 1: Essential Statistical Metrics for LSER Model Validation
| Metric | Formula/Description | Interpretation | Target Value |
|---|---|---|---|
| Coefficient of Determination (R²) | R² = 1 - (SS~res~/SS~tot~) | Proportion of variance in the response variable explained by the model | >0.9 indicates strong explanatory power [54] |
| Root Mean Square Error (RMSE) | RMSE = √(Σ(ŷ~i~ - y~i~)²/n) | Measure of the average deviation between predicted and observed values | Lower values indicate better predictive accuracy [54] |
| Adjusted R² | R²~adj~ = 1 - [(1-R²)(n-1)/(n-k-1)] | R² adjusted for the number of predictors in the model | Prevents overestimation of explanatory power in multi-parameter models |
| Number of Observations (n) | Sample size used for model calibration | Indicates the statistical power of the model | Larger datasets improve model robustness [55] |
These statistical metrics provide the foundation for evaluating LSER model quality. For example, in a recent LSER model developed for predicting partition coefficients between low-density polyethylene and water, the reported statistics (n = 156, R² = 0.991, RMSE = 0.264) demonstrate exceptionally strong performance [54]. Similarly, when the same model was applied to an independent validation set, it maintained high performance (R² = 0.985, RMSE = 0.352), confirming its predictive reliability [55].
Experimental Protocol: Internal Validation of LSER Models
Data Splitting for Cross-Validation
Purpose: To assess model performance on data not used in model calibration and detect potential overfitting.
Materials:
- Complete dataset of experimental partition coefficients and solute descriptors
- Statistical software with cross-validation capabilities (e.g., R, Python with scikit-learn)
- IFSQSAR Python package for applying QSARs and LSER predictions [56]
Procedure:
- Dataset Preparation: Compile a minimum of 150-200 observations spanning the chemical space of interest, ensuring diversity in molecular weight, functional groups, and polarity [54].
- Training-Test Split: Randomly assign approximately 70-80% of observations to the training set and 20-30% to the test set. For example, in a recent LSER study, 156 observations were used for model calibration while 52 observations (∼33%) were reserved for independent validation [55].
- Stratified Sampling: Ensure both sets represent similar ranges and distributions of key molecular descriptors (E, S, A, B, V) to maintain chemical domain consistency.
- Model Calibration: Fit the LSER model using only the training dataset, obtaining the system-specific coefficients (e, s, a, b, v, c).
- Model Testing: Apply the fitted model to the test set and calculate performance metrics (R², RMSE) comparing predicted versus experimental values.
Quality Control:
- Perform principal component analysis on both training and test sets to verify similar chemical space coverage.
- Ensure no structural outliers exist in the test set without representation in the training set.
Statistical Validation Protocol
Purpose: To quantitatively evaluate model performance and significance.
Procedure:
- Goodness-of-fit Assessment:
- Calculate R² and RMSE for the training set
- Compute adjusted R² to account for the number of LSER descriptors
- Compare training and test set performance metrics to detect overfitting
Residual Analysis:
- Plot residuals (predicted - observed) against predicted values
- Check for patterns in residuals that might indicate systematic error
- Identify potential outliers exceeding ±2×RMSE
Descriptor Significance Testing:
- Perform t-tests on individual LSER coefficients to determine statistical significance
- Calculate variance inflation factors (VIF) to check for multicollinearity among descriptors
- Remove non-significant descriptors (p > 0.05) and refit the model if appropriate
Applicability Domain Assessment:
- Define the chemical space of the model using ranges of each molecular descriptor
- Implement leverage analysis to identify compounds outside the model's applicability domain
- Use Williams plots to visualize the relationship between leverage and standardized residuals
Interpretation: A robust LSER model should exhibit high R² (>0.9), low RMSE, similar performance between training and test sets, randomly distributed residuals, and statistically significant coefficients for all relevant molecular descriptors.
Advanced Cross-Validation Techniques
For more comprehensive validation, especially with limited datasets, advanced cross-validation methods should be employed:
k-Fold Cross-Validation Protocol:
- Randomly partition the entire dataset into k subsets (typically k=5 or 10)
- Iteratively use k-1 subsets for training and the remaining subset for testing
- Repeat the process k times until each subset has been used as the test set once
- Calculate the average performance metrics across all k iterations
Leave-One-Out Cross-Validation (LOO-CV) Protocol:
- For each observation in the dataset:
- Fit the model using all other observations
- Predict the value for the left-out observation
- Compute the predictive residual sum of squares (PRESS) statistic
- Calculate cross-validated R² (Q²) and RMSE from all predictions
These techniques are particularly valuable when working with smaller datasets, as they provide more reliable estimates of model predictive performance while maximizing data usage.
Visualization of LSER Model Validation Workflow
LSER Model Validation Workflow: This diagram illustrates the comprehensive internal validation process for LSER models, from initial dataset preparation through statistical validation and final model acceptance.
Case Study: LDPE-Water Partition Coefficient Model Validation
A recent implementation of these validation protocols demonstrates their practical application. Researchers developing an LSER model for low-density polyethylene-water partition coefficients (logK~i,LDPE/W~) followed this rigorous process:
- Dataset: 159 compounds spanning diverse chemical structures, molecular weights (32-722), and partition coefficient ranges (logK~i,LDPE/W~: -3.35 to 8.36) [54]
- Model Fitting: LSER equation calibrated on training set (n=156): logK~i,LDPE/W~ = -0.529 + 1.098E - 1.557S - 2.991A - 4.617B + 3.886V [54]
- Statistical Performance: Excellent model fit (R² = 0.991, RMSE = 0.264) [54]
- Independent Validation: Application to test set (n=52) maintained strong performance (R² = 0.985, RMSE = 0.352) [55]
- External Validation: Comparison with predicted solute descriptors showed slightly reduced but still strong performance (R² = 0.984, RMSE = 0.511) [55]
Table 2: Validation Results for LDPE-Water Partition Coefficient LSER Model
| Validation Type | Dataset Size | R² | RMSE | Data Source |
|---|---|---|---|---|
| Training Set | n = 156 | 0.991 | 0.264 | Experimental solute descriptors [54] |
| Test Set | n = 52 | 0.985 | 0.352 | Experimental solute descriptors [55] |
| Predicted Descriptors | n = 52 | 0.984 | 0.511 | QSPR-predicted solute descriptors [55] |
This case study highlights the critical importance of comprehensive validation, as it demonstrates how a well-validated LSER model maintains predictive performance across different types of input data (experimental vs. predicted descriptors).
Table 3: Key Resources for LSER Model Development and Validation
| Resource | Description | Application in LSER Validation | Access Information |
|---|---|---|---|
| UFZ-LSER Database | Curated database of LSER parameters and partition coefficients [1] | Source of experimental data for model training and benchmarking | https://www.ufz.de/lserd/ [1] |
| IFSQSAR Python Package | Open-source tool for applying QSARs and predicting Abraham solute descriptors [56] | Calculation of solute descriptors and model validation | https://github.com/tnbrowncontam/ifsqsar [56] |
| Abraham Solute Descriptors | Six-parameter set (E, S, A, B, V, L) describing molecular properties [57] | Independent variables in LSER models | Experimental measurement or prediction from tools like IFSQSAR [56] |
| Experimental Partition Coefficients | Measured partition coefficients in systems of interest (e.g., LDPE/water) [54] | Dependent variables for model training and validation | Laboratory measurement or literature compilation [54] |
| Statistical Software | Packages with regression and cross-validation capabilities (R, Python with scikit-learn) | Calculation of validation metrics and model diagnostics | Open-source or commercial statistical packages |
Troubleshooting Common Validation Issues
Even with carefully designed validation protocols, researchers may encounter specific challenges:
Problem 1: Large Discrepancy Between Training and Test Set Performance
- Potential Cause: Overfitting or fundamental differences in chemical space between sets
- Solution: Re-examine data splitting procedure, ensure chemical diversity in both sets, consider reducing model complexity
Problem 2: Systematic Patterns in Residuals
- Potential Cause: Missing important molecular interaction in LSER equation
- Solution: Explore additional descriptors or interaction terms, check for measurement errors in specific chemical classes
Problem 3: Poor Performance with Predicted Descriptors
- Potential Cause: Inaccuracy in descriptor prediction methods
- Solution: Use experimental descriptors when possible, or apply more advanced prediction tools with validated accuracy [56]
By implementing these comprehensive internal validation protocols, researchers can ensure their LSER models possess both statistical robustness and practical predictive power for application in pharmaceutical development and environmental risk assessment.
External validation is the process of testing a pre-existing prediction model on a completely new set of patients or data points to evaluate its reproducibility and generalizability [58]. This is a crucial step in the scientific method, as a model that performs well on its development data may be overfitted and perform poorly on new, independent data [58]. In the context of Linear Solvation Energy Relationship (LSER) research, external validation provides an objective assessment of a model's predictive accuracy for complex environmental contaminants or pharmaceutical compounds, ensuring its reliability for real-world application [55] [15].
Different levels of validation rigor exist, with independent external validation—where the validation cohort is assembled separately from the development cohort—being the most robust [58]. For LSER models, which aim to predict partition coefficients based on solute descriptors, external validation is the final step that bridges the gap between model development and practical implementation in drug development and environmental risk assessment [55].
Experimental Protocol for External Validation
Protocol: External Validation of an LSER Model
Objective: To independently validate the predictive performance of a published LSER model using a new experimental dataset.
Principle: The accuracy and generalizability of a published LSER model are assessed by comparing its predictions against experimentally determined partition coefficients for a new set of compounds not used in the model's development.
Materials and Equipment:
| Item/Reagent | Function in Validation |
|---|---|
| Low Density Polyethylene (LDPE) | Model polymeric phase for partitioning studies [55]. |
| Reference Compounds (≥ 50) | Chemically diverse solutes with known descriptors for validation [15]. |
| High-Performance Liquid Chromatography (HPLC) System | For quantitative analysis of solute concentrations [15]. |
| Gas Chromatography (GC) Columns | Used in validation systems to represent various intermolecular interactions [15]. |
| COSMOtherm / ABSOLV / SPARC Software | Prediction tools for generating comparative solute descriptors and partition coefficients [15]. |
| Consistent Buffer Solution (e.g., pH 7.4) | Aqueous phase to simulate physiological or environmental conditions. |
Procedure:
Validation Cohort Selection:
- Assemble a set of no fewer than 50 compounds that were not included in the development of the original LSER model [55].
- Ensure the compounds cover a wide range of chemical functionalities and property spaces (e.g., varying sizes, polarities, hydrogen-bonding capabilities) relevant to the model's intended application [15].
Experimental Data Generation:
- For each compound in the validation set, determine the partition coefficient (e.g.,
logK_LDPE/W) through laboratory experimentation. - Establish equilibrium for the solute between the polymer phase (e.g., LDPE) and the aqueous phase.
- Quantify the solute concentration in both phases using a calibrated analytical method such as HPLC [55] [15].
- Record the experimental
logKvalue for each compound.
- For each compound in the validation set, determine the partition coefficient (e.g.,
Prediction Calculation:
- For each compound, obtain the necessary LSER solute descriptors (E, S, A, B, V). Preferably, use experimental descriptor values from a curated database [55].
- Apply the original, unmodified LSER model equation to these descriptors to compute the predicted partition coefficient for every compound in the validation set [58].
Performance Assessment:
- Statistically compare the model's predictions against the experimentally observed values.
- Calculate key performance metrics, including:
- R² (Coefficient of Determination): Measures the proportion of variance in the experimental data explained by the model. An R² > 0.9 is often indicative of strong predictive performance [55].
- RMSE (Root Mean Square Error): Quantifies the average magnitude of prediction errors. A lower RMSE indicates higher accuracy [55] [15].
- Generate a scatter plot of Predicted vs. Experimental
logKvalues to visually inspect the agreement and identify any systematic biases.
Benchmarking (Optional):
- Compare the predictive performance of the validated LSER model against other available prediction methods (e.g., COSMOtherm, ABSOLV, SPARC) using the same independent dataset [15].
Workflow Visualization
Data Presentation and Performance Metrics
Key Metrics for Quantitative Assessment
The following metrics are essential for a quantitative summary of model performance during external validation [58] [55] [15].
Table 1: Key Performance Metrics for External Validation
| Metric | Description | Interpretation | Ideal Outcome |
|---|---|---|---|
| R² (Coefficient of Determination) | Proportion of variance in the observed data that is predictable from the model. | Closer to 1.0 indicates the model explains most of the variance. | > 0.9 [55] |
| RMSE (Root Mean Square Error) | Average magnitude of the prediction errors, in the units of the predicted variable. | Lower values indicate higher predictive accuracy. | As low as possible [55] [15] |
| Slope and Intercept | Parameters from the regression of predicted vs. observed values. | Slope near 1.0 and intercept near 0.0 indicate no systematic bias. | Slope ≈ 1.0, Intercept ≈ 0.0 |
| Scatter Plot | Visual representation of predicted vs. experimental values. | Points lying close to the line of unity (y=x) indicate good agreement. | Tight clustering around y=x line |
Example Performance Data from LSER Validation
The table below summarizes example performance statistics from external validation studies, illustrating how different models can be compared.
Table 2: Example Performance of Prediction Methods on an Independent Validation Set
| Prediction Method | Validation Cohort Size (n) | R² | RMSE (log units) | Notes |
|---|---|---|---|---|
| LSER (Exp. Descriptors) | 52 | 0.985 | 0.35 | High accuracy with experimental solute descriptors [55]. |
| LSER (Pred. Descriptors) | 52 | 0.984 | 0.51 | Good performance with predicted descriptors [55]. |
| COSMOtherm | ~270 | N/A | 0.65 - 0.93 | Comparable accuracy to ABSOLV [15]. |
| ABSOLV | ~270 | N/A | 0.64 - 0.95 | Comparable accuracy to COSMOtherm [15]. |
| SPARC | ~270 | N/A | 1.43 - 2.85 | Substantially higher prediction error [15]. |
The Scientist's Toolkit: Research Reagent Solutions
Table 3: Essential Materials for LSER and Partition Coefficient Studies
| Research Reagent / Material | Critical Function |
|---|---|
| Polymer Phases (LDPE, PDMS, POM) | Serves as the organic/polymeric phase in partition coefficient experiments, mimicking biological membranes or environmental compartments [55]. |
| Chemical Solutes for Validation | A diverse set of compounds with known descriptor values used to test the model's generalizability across chemical space [15]. |
| Chromatographic Systems (GC, HPLC) | Used both as an experimental system to measure solute interactions and for quantitative analysis of solute concentrations [15]. |
| LSER Solute Descriptor Database | A curated source of experimental descriptors (E, S, A, B, V), which are the essential inputs for the LSER model equation [55]. |
| Prediction Software (COSMOtherm, ABSOLV) | Computational tools used for benchmarking or for generating predictions when experimental descriptors are unavailable [15]. |
Conceptual Framework of LSER Model Generalizability
The following diagram illustrates the relationship between model development, validation, and the concept of generalizability, which is the ultimate goal of external validation.
The accurate prediction of solute-solvent interactions is a cornerstone of research in chemical analysis, pharmaceutical development, and environmental science. Among the various models developed for this purpose, the Linear Free-Energy Relationships (LFER), particularly the Abraham solvation parameter model, has established itself as a robust predictive tool across numerous applications [8]. This approach utilizes linear solvation energy relationships (LSERs) to correlate molecular descriptors with thermodynamic properties. More recently, Partial Solvation Parameters (PSP) have emerged as a complementary framework designed to extract and extend the thermodynamic information contained within LSER databases [8]. This analysis provides a comparative evaluation of these frameworks, focusing on their theoretical foundations, practical applications, and implementation protocols, specifically within the context of determining LSER solute descriptors for research.
Theoretical Framework and Comparative Analysis
Abraham LSER Model
The Abraham LSER model is founded on the principle that free-energy-related properties of a solute can be correlated with a set of six molecular descriptors [8]. The two primary equations for this model are:
For solute transfer between two condensed phases: log(P) = cp + epE + spS + apA + bpB + vpVx [8]
For gas-to-organic solvent partitioning: log(KS) = ck + ekE + skS + akA + bkB + lkL [8]
In these equations, the capital letters (E, S, A, B, Vx, L) represent solute-specific molecular descriptors: excess molar refraction (E), dipolarity/polarizability (S), hydrogen bond acidity (A), hydrogen bond basicity (B), McGowan's characteristic volume (Vx), and the gas-liquid partition coefficient in n-hexadecane at 298 K (L). The lowercase letters are system-specific coefficients that reflect the complementary properties of the solvent phase [8]. The remarkable success of this model lies in its capacity to differentiate five distinct contributions to solute retention and partitioning, encompassing polarizability, dipolarity, hydrogen bonding, and cavity formation interactions [59] [60].
Partial Solvation Parameters (PSP) Framework
The PSP framework was developed to address the challenge of extracting thermodynamically meaningful information from existing LSER databases and other polarity scales [8]. Its key innovation is its equation-of-state thermodynamic basis, which allows for the estimation of properties over a broad range of external conditions, unlike the standard LSER model which is typically tied to specific conditions (e.g., 298 K) [8].
The framework utilizes four parameters:
- σd: Dispersion PSP, reflecting weak dispersive interactions.
- σp: Polar PSP, collectively reflecting Keesom-type and Debye-type polar interactions.
- σa and σb: Hydrogen-bonding PSPs reflecting the acidity and basicity characteristics of the molecule, respectively [8].
A significant advantage of the hydrogen-bonding PSPs is their ability to estimate the free energy change (ΔGhb), enthalpy change (ΔHhb), and entropy change (ΔShb) upon hydrogen bond formation, providing a more thermodynamically complete picture [8].
Comparative Evaluation of LSER and PSP
Table 1: Comparative Analysis of the LSER and PSP Frameworks
| Feature | Abraham LSER | Partial Solvation Parameters (PSP) |
|---|---|---|
| Theoretical Basis | Linear Free-Energy Relationships (LFER); Empirical correlations [8] | Equation-of-State Thermodynamics; Theoretical foundation for property estimation across conditions [8] |
| Primary Application | Prediction of partition coefficients, retention in chromatography, solvation energies [59] [55] | Extraction and translation of thermodynamic information from LSER and other databases; Bridging QSPR databases and equation-of-state models [8] |
| Molecular Descriptors | Six solute descriptors (E, S, A, B, V, L) [8] |
Four descriptors (σd, σp, σa, σb) derived from quantum-chemical calculations or LSER descriptors [8] [49] |
| Handling of Hydrogen Bonding | Terms aA and bB in the linear equation [60] |
PSPs σa and σb used to estimate ΔGhb, ΔHhb, and ΔShb [8] |
| Key Limitation | Requires extensive experimental data for regression; System coefficients are condition-specific [59] [8] | Development is slow due to difficulty in reconciling information from different databases and scales [8] |
| Condition Dependency | Correlations are typically for specific temperatures (e.g., 298 K) | Parameters can be estimated over a broad range of temperatures and pressures [8] |
The two frameworks are not mutually exclusive but are inherently interconnected. The PSP approach is designed to act as a versatile tool for extracting the rich thermodynamic information contained within the LSER database [8]. This relationship highlights the complementary nature of the two models, with LSER serving as a robust empirical tool for specific predictions, and PSP providing a more general thermodynamic framework for interpreting and extending those predictions.
Logical Workflow and Relationship Between Frameworks
The following diagram illustrates the conceptual and practical workflow involving both the LSER and PSP frameworks, showing how they interconnect from foundational measurements to advanced thermodynamic modeling.
Application Notes and Experimental Protocols
Fast LSER Characterization for Chromatographic Systems
A significant innovation in applied LSER methodology is the development of a fast characterization protocol for chromatographic systems, which reduces the number of required experiments without sacrificing critical information [59].
Principle: This method carefully selects pairs of test compounds that share identical molecular descriptors except for one specific property. The selectivity factor of a single pair then directly reflects the contribution of that dissimilar interaction to chromatographic retention [59].
Detailed Protocol:
- Column Hold-up Volume Determination: Inject a mixture of four alkyl ketone homologues to determine the column hold-up volume and Abraham's cavity term [59].
- Selectivity Factor Measurements: Perform chromatographic runs with four specifically selected pairs of test solutes. Each pair is designed to differ in only one key molecular descriptor:
- A pair with different hydrogen bonding acidity (A)
- A pair with different hydrogen bonding basicity (B)
- A pair with different dipolarity/polarizability (S)
- A pair emphasizing the cavity formation term [59]
- Data Analysis: Calculate the selectivity factor (α) for each pair. The log(α) values provide quantitative information about the system's coefficients (a, b, s, v) for the respective interactions [59].
This streamlined protocol requires only five chromatographic runs (four solute pairs plus one homologue mixture) to characterize the selectivity of a reversed-phase or HILIC chromatographic system, making it a high-throughput alternative to traditional LSER methods that require measuring retention factors for a large number of compounds [59].
Protocol for Determining Polymer-Water Partition Coefficients Using LSER
LSER models provide robust prediction of partition coefficients between polymers and water, which is critical for assessing the leaching of substances from plastic materials [55].
Model Application: For Low-Density Polyethylene (LDPE) and water, the established LSER model is [55]: log K~i,LDPE/W~ = -0.529 + 1.098E - 1.557S - 2.991A - 4.617B + 3.886V
Implementation Steps:
- Solute Descriptor Acquisition: Obtain the solute descriptors (E, S, A, B, V) for the compound of interest.
- Source 1: Consult curated experimental databases where available.
- Source 2: Use Quantitative Structure-Property Relationship (QSPR) prediction tools to calculate descriptors based on chemical structure, acknowledging a potential increase in prediction error [55].
- Calculation: Input the descriptors into the LSER model equation to compute the log partition coefficient.
- Validation: For critical applications, validate predictions against an independent set of experimental data. Benchmarking studies have shown such models can achieve high accuracy (R² = 0.985) when using experimental descriptors [55].
Advanced Application: Probing Chiral Recognition Mechanisms
LSER can be uniquely adapted to gain insights into chiral recognition mechanisms by studying the separation of enantiomers on chiral stationary phases (CSPs) [60].
Principle: While two enantiomers possess identical LSER solute descriptors, they can be separated on a CSP because they form transient diastereomeric complexes with the selector. The enantioselectivity factor (α) can be modeled as [60]: log α = ΔeE + ΔsS + ΔaA + ΔbB + ΔvV
Here, the Δ terms represent the differences in interaction energies responsible for the chiral recognition.
Protocol:
- Characterize the CSP: First, determine the system parameters (e, s, a, b, v) of the chiral column using a set of achiral probe solutes with known descriptors [60].
- Perform Enantiomer Separations: Chromatographically separate the enantiomeric pairs of interest on the characterized CSP.
- Analyze Enantioselectivity: Apply the adapted LSER equation to the enantioselectivity factors (α) to determine the Δ system parameters. This reveals which specific interactions (e.g., steric v, H-bonding a/b, or polar e/s) are dominant in the chiral discrimination process [60]. For example, studies on a teicoplanin CSP showed significant contributions from interactions with solute-induced dipoles (e coefficient) and steric effects (v parameter) [60].
The Scientist's Toolkit: Essential Research Reagents and Materials
Successful implementation of the described protocols requires specific chemical reagents and computational tools.
Table 2: Essential Research Reagents and Computational Tools for LSER/PSP Research
| Item Name | Specification / Purpose | Application Context |
|---|---|---|
| LSER Probe Molecules | A set of 50-60 compounds with well-established Abraham descriptors (e.g., alkyl benzenes, ketones, alcohols, amines) [60] | Characterizing system parameters of new solvents or stationary phases [59] [60] |
| Alkyl Ketone Homologues | C~5~ to C~8~ or similar; used for determination of hold-up volume and cavity term [59] | Fast chromatographic characterization protocol [59] |
| Chirobiotic Columns | Macrocyclic glycopeptide CSPs (e.g., Teicoplanin, Vancomycin) [60] | Studying chiral recognition mechanisms via LSER [60] |
| n-Hexadecane | High-purity solvent for determining solute descriptor L [8] | Foundational for gas-solvent partition studies and descriptor determination |
| QSPR Prediction Software/Tools | Software for predicting Abraham solute descriptors (E, S, A, B, V) from molecular structure [55] | Estimating descriptors for novel compounds lacking experimental data [55] |
| LSER Database | Curated database of solute descriptors and system coefficients [8] | Core resource for model development, prediction, and validation |
The Abraham LSER model and the PSP framework represent two powerful, complementary approaches for understanding and predicting solute-solvent interactions. The LSER model excels as an empirical tool for direct prediction of partition coefficients and chromatographic retention in well-defined systems, with streamlined protocols now available for rapid system characterization [59]. In contrast, the PSP framework provides a stronger thermodynamic foundation, enabling the extraction of more fundamental properties and the extension of predictions across different conditions [8]. The choice between them depends on the research objective: LSER is optimal for specific, quantitative predictions under set conditions, while PSP is better suited for deeper thermodynamic analysis and building more generalized models. A combined approach, leveraging the strengths of both frameworks, offers the most robust strategy for advancing research in solute descriptor determination and its applications in drug development and chemical analysis.
The accurate prediction of binding affinities and solvent effects is a cornerstone of modern catalysis research and drug development. This application note details a successful, fully computational workflow for designing high-efficiency Kemp eliminase enzymes, a benchmark reaction in biocatalysis. The protocol demonstrates the extraction of thermodynamic information from Linear Solvation Energy Relationships (LSER) and the use of novel quantum chemical LSER (QC-LSER) descriptors to predict hydrogen-bonding interaction free energies, which are critical for understanding molecular interactions in catalytic processes [61] [62] [8]. By framing this within a broader thesis on LSER solute descriptors, this document provides researchers with a detailed protocol for applying these methods to predict catalytic efficiency and ligand binding.
Key Concepts and Theoretical Framework
LSER and Solvation Thermodynamics
The Abraham LSER model is a powerful tool for predicting solute transfer properties between phases. It correlates a solute's physicochemical properties with its free energy of solvation using the general form:
log K = c + eE + sS + aA + bB + vV [8]
Where the upper-case letters are solute molecular descriptors (e.g., A and B for hydrogen-bond acidity and basicity), and the lower-case letters are the complementary solvent-phase system coefficients [61] [8]. The hydrogen-bonding contribution to the solvation free energy is modeled by the sum aA + bB [61]. A key advancement is the development of QC-LSER descriptors, αG and βG, which represent a molecule's proton donor and acceptor capacities, respectively, and can be predicted from quantum chemical calculations of molecular surface charge distributions (σ-profiles) [61].
The Challenge ofDe NovoEnzyme Design
The Kemp elimination (KE) reaction, a model for proton abstraction, has long been used to test computational enzyme design. Prior designs suffered from low catalytic efficiencies (kcat/KM < 420 M⁻¹ s⁻¹) and turnover numbers (kcat < 0.7 s⁻¹), requiring extensive laboratory evolution to reach performance levels comparable to natural enzymes [62]. This highlighted a critical gap in the ability to computationally design stable, well-folded enzymes with active sites precisely organized for transition state stabilization.
Application Note: Computational Design of a High-Efficiency Kemp Eliminase
Experimental Aims
The primary aim was to design a Kemp eliminase enzyme de novo that would achieve catalytic efficiency (kcat/KM) and turnover (kcat) rivaling naturally occurring enzymes, without recourse to experimental optimization or high-throughput screening [62].
Workflow and Protocol
The following diagram illustrates the fully computational design workflow.
Protocol Steps:
Theozyme Definition: The catalytic constellation for the Kemp elimination was derived from quantum-mechanical calculations. It included a catalytic base (Asp or Glu) for proton abstraction and an aromatic side chain for π-stacking with the transition state. Notably, a polar group to stabilize the isoxazole oxygen was excluded, as a water molecule could fulfill this role, preventing undesired pKa depression of the base [62].
Backbone Generation & Scaffold Selection (Step 1):
Global Stabilization and Pre-organization (Step 2):
- Method: The PROSS (Protein Repair One Stop Shop) algorithm was applied to each generated backbone to design sequences that maximize stability and the likelihood of unique folding into the designed conformation [62].
- Objective: To create a stable, well-folded scaffold that can precisely position catalytic residues.
Active Site Design (Step 3):
- Method: Geometric matching was used to position the KE theozyme within each stabilized scaffold. All active-site positions were optimized using Rosetta atomistic calculations to identify sequences that best complement the transition state [62].
- Descriptor Link: This step is analogous to optimizing the QC-LSER descriptors (
αG,βG) within the active site environment, ensuring optimal hydrogen-bonding capacity and electrostatic preorganization for catalysis [61].
Multi-Objective Filtering (Step 4):
- Method: Millions of designs were filtered using a 'fuzzy-logic' optimization function that balances conflicting objectives: low system energy, high desolvation of the catalytic base, and precise catalytic geometry [62].
Final Active-Site Refinement (Step 5):
- Method: The FuncLib method was applied to the top designs, sampling low-energy amino acid mutations at positions surrounding the active site to fine-tune the environment without relying on natural sequence homology [62].
Key Results and Quantitative Data
The workflow resulted in several highly active Kemp eliminase designs. The most efficient designs showcased catalytic parameters that surpassed previous computational designs by orders of magnitude and rivaled laboratory-evolved and natural enzymes [62].
Table 1: Catalytic Performance of Designed Kemp Eliminases
| Enzyme Design | Catalytic Efficiency (kcat/KM), M⁻¹ s⁻¹ |
Turnover Number (kcat), s⁻¹ |
Key Features |
|---|---|---|---|
| Initial Design (Des27) | 210 | < 1 | On par with prior computational designs [62]. |
| Optimized Design (from Des61) | 3,600 | 0.85 | Showed significant improvement after FuncLib refinement [62]. |
| Lead Design (DesX) | 12,700 | 2.8 | >140 mutations from any natural protein; high thermal stability (>85 °C) [62]. |
| Top Design with Additional Mutation | > 100,000 | 30.0 | Surpassed the median efficiency of natural enzymes [62]. |
Table 2: Key Reagents and Computational Tools for LSER and Enzyme Design
| Category | Reagent / Tool / Descriptor | Function and Description |
|---|---|---|
| Computational Suites | TURBOMOLE, DMol3, SCM | Perform DFT calculations to generate σ-profiles for QC-LSER descriptor calculation [61]. |
| Rosetta | Suite for protein structure prediction and design; used for atomistic active-site optimization [62]. | |
| Databases | COSMObase | Provides pre-computed σ-profiles for thousands of molecules [61]. |
| LSER Database | Freely accessible database of Abraham solute descriptors and solvent coefficients [8]. | |
| Molecular Descriptors | Abraham Descriptors (A, B) |
Experimentally-derived descriptors for hydrogen-bond acidity and basicity [61] [8]. |
QC-LSER Descriptors (αG, βG) |
Quantum chemically-derived descriptors for proton donor and acceptor capacities; can be calculated from σ-profiles [61]. | |
Estate Descriptors |
Topological descriptors reflecting atomic electronegativity; useful in QSAR models for binding affinity [63]. |
Protocol for Determining LSER Descriptors from Binding and Solvation Data
This section outlines a general protocol for researchers to determine or utilize LSER descriptors in the context of binding affinity and solvation studies, as referenced in the case study.
Protocol: Extracting Hydrogen-Bonding Free Energies
Purpose: To estimate the hydrogen-bonding contribution to the free energy of interaction between a solute and a solvent, which is critical for predicting binding affinities and solvent effects [61] [8].
- Data Collection: Obtain the Abraham solute descriptors (
A1,B1) for your molecule of interest and the solvent system coefficients (a2,b2) for your solvent from the LSER database [8]. - Calculation: The HB contribution to the solvation free energy is given by the sum
a2A1 +b2B1. For the overall HB interaction free energy between two molecules (1 and 2), the QC-LSER model provides a simple predictive formula:ΔG_hb = 5.71 * (αG1 * βG2 + βG1 * αG2)kJ/mol at 25°C [61]. - Alternative QC Path: If experimental LSER descriptors are unavailable, compute the molecular surface charge distribution (σ-profile) using a DFT software suite (e.g., TURBOMOLE). From this σ-profile, the descriptors
αGandβGcan be derived [61].
Protocol: Integrating LSER and Machine Learning for Affinity Prediction
Purpose: To construct a quantitative model for predicting drug-target interaction (DTI) affinity using descriptors informed by LSER principles [63].
The logical relationship between data, descriptors, and model prediction is shown below.
Protocol Steps:
- Data Curation: Collect a dataset of ligands, their target proteins, and experimental affinity values (e.g.,
KdorEC50). Public databases like ChEMBL and PubChem are primary sources [63]. - Descriptor Calculation:
- Ligands: Calculate a comprehensive set of molecular descriptors. The PaDEL software can compute 1D and 2D descriptors. Prioritize descriptors related to molecular vibrations and electronic properties (e.g., E-state descriptors,
A,B), as they have shown high importance in DTI affinity models [63]. - Proteins: Compute protein sequence descriptors, such as normalized Moreau-Broto (G3) and Moran (G4) autocorrelation descriptors [63].
- Ligands: Calculate a comprehensive set of molecular descriptors. The PaDEL software can compute 1D and 2D descriptors. Prioritize descriptors related to molecular vibrations and electronic properties (e.g., E-state descriptors,
- Feature Selection: Reduce dimensionality to avoid overfitting. Remove descriptors with near-zero variance and high inter-correlation (e.g.,
r> 0.9). Select features with a significant correlation (r> 0.3) with the target affinity value [64] [63]. - Model Building and Validation: Train a machine learning model, such as Random Forest (RF), using the selected ligand and protein descriptors as input and the binding affinity as the output. Validate the model using rigorous internal cross-validation and an external test set [63].
This case study demonstrates a paradigm shift in computational catalysis. By moving beyond fixed-backbone design and achieving atomic-level precision over the entire protein structure, it is now possible to design highly efficient, stable enzymes from scratch [62]. The success of this workflow validates the underlying thermodynamic principles captured by LSER and QC-LSER descriptors, particularly the accurate prediction of hydrogen-bonding interactions, which are fundamental to binding and catalysis [61].
The integration of these descriptors with machine learning, as outlined in the DTI affinity protocol, provides a robust framework for predictive modeling in drug discovery and materials science. The described protocols offer researchers a concrete path for applying LSER-based methodologies to quantify and predict the complex interplay of interactions that govern binding affinities and solvent effects in catalytic systems.
Conclusion
The determination of LSER solute descriptors bridges fundamental thermodynamics and practical application, providing a powerful, quantitative framework for predicting molecular behavior in complex environments. The methodologies outlined—spanning experimental, computational, and hybrid machine-learning approaches—offer a robust pathway for researchers to generate accurate and reproducible descriptors. As the field evolves, the integration of these descriptors with equation-of-state thermodynamics and their application in personalized medicine—for instance, predicting drug binding to genetic variant-specific protein targets—represents a promising frontier. The continued development of open-access databases and standardized protocols will further solidify LSER's role as an indispensable tool in drug discovery, environmental chemistry, and biomolecular engineering.
References
- 1. LSER Database [https://www.ufz.de/lserd/]
- 2. Determination of Abraham model solute descriptors for the ... [https://pmc.ncbi.nlm.nih.gov/articles/PMC4369286/]
- 3. Application of Abraham's solvation parameter model to ... [https://www.sciencedirect.com/science/article/pii/S2772391724000458]
- 4. Abraham Solvation Parameter Model: Calculation of L ... [https://www.mdpi.com/2673-8015/2/3/7]
- 5. Optimization of HPLC method for determination ... [https://pubmed.ncbi.nlm.nih.gov/39922538/]
- 6. Determination of Abraham Model Solute Descriptors for 62 ... [https://www.mdpi.com/2673-8015/3/1/10]
- 7. Predicting Abraham model solvent coefficients - BMC Chemistry [https://bmcchem.biomedcentral.com/articles/10.1186/s13065-015-0085-4]
- 8. Linear Solvation–Energy Relationships (LSER) and ... [https://www.mdpi.com/2673-8015/3/1/7]
- 9. COSMO-RS and LSER models of solution thermodynamics [https://www.sciencedirect.com/science/article/abs/pii/S0167732223017981]
- 10. Linear Free Energy Relationship - an overview [https://www.sciencedirect.com/topics/engineering/linear-free-energy-relationship]
- 11. Linear solvation energy relationships (LSERs) for robust ... [https://pubmed.ncbi.nlm.nih.gov/35122951/]
- 12. AbraLlama: Predicting Abraham Model Solute Descriptors ... [https://www.mdpi.com/2673-8015/4/3/29]
- 13. Partial solvation parameters and LSER molecular descriptors [https://www.sciencedirect.com/science/article/abs/pii/S0021961412001024]
- 14. Wayne State University experimental descriptor database ... [https://www.sciencedirect.com/science/article/abs/pii/S0021967319313123]
- 15. Validation of COSMOtherm, ABSOLV, and SPARC [https://academic.oup.com/etc/article/33/7/1537/7761199]
- 16. Prediction of Hydrogen-Bonding Interaction Free-Energies ... [https://www.preprints.org/manuscript/202501.1538]
- 17. Quantum chemical calculations for predicting the partitioning ... [https://pubs.rsc.org/en/content/articlehtml/2025/em/d5em00524h]
- 18. Quantification of the Impact of Partition Coefficient ... [https://www.sciencedirect.com/science/article/pii/S0090955624077201]
- 19. Partition Coefficient (n-octanol/water): Shake Flask Method [https://www.oecd.org/en/publications/1995/07/test-no-107-partition-coefficient-n-octanol-water-shake-flask-method_g1gh28d3.html]
- 20. Practical Understanding of Partition Coefficients [https://www.chromatographyonline.com/view/practical-understanding-of-partition-coefficients]
- 21. and normal-phase retentions [https://www.sciencedirect.com/science/article/abs/pii/S0003267019310670]
- 22. Application of a modified LSER model to retention on a ... [https://pmc.ncbi.nlm.nih.gov/articles/PMC3023878/]
- 23. Retention and Selectivity of Stationary Phases Used in HILIC [https://www.chromatographyonline.com/view/retention-and-selectivity-stationary-phases-used-hilic-1]
- 24. Hydrophilic interaction liquid chromatography (HILIC) [https://pmc.ncbi.nlm.nih.gov/articles/PMC3249561/]
- 25. Reversed HILIC Gradient: A Powerful Strategy for On-Line ... [https://pmc.ncbi.nlm.nih.gov/articles/PMC10179806/]
- 26. Solving the retention time repeatability problem of ... [https://www.sciencedirect.com/science/article/pii/S0021967324004345]
- 27. HILIC Chromatography An Insight on the Retention ... [https://www.longdom.org/open-access/hilic-chromatography-an-insight-on-the-retention-mechanism-50992.html]
- 28. Can deep learning algorithms enhance the prediction of ... [https://www.sciencedirect.com/science/article/abs/pii/S0378381221004118]
- 29. Molecular Dynamics Simulations with Quantum Mechanics ... [https://pmc.ncbi.nlm.nih.gov/articles/PMC6233882/]
- 30. Text has enhanced contrast | ACT Rule | WAI [https://www.w3.org/WAI/standards-guidelines/act/rules/09o5cg/]
- 31. Color contrast - Accessibility - MDN Web Docs - Mozilla [https://developer.mozilla.org/en-US/docs/Web/Accessibility/Guides/Understanding_WCAG/Perceivable/Color_contrast]
- 32. Assessment of machine learning and group contribution ... [https://www.sciencedirect.com/science/article/pii/S2772391725000118]
- 33. Comparison of Quantitative and Qualitative (Q)SAR Models ... [https://pmc.ncbi.nlm.nih.gov/articles/PMC6192375/]
- 34. Explainable machine learning for unraveling solvent effects ... [https://www.sciencedirect.com/science/article/pii/S2772823423000027]
- 35. Interpretable correlation descriptors for quantitative structure ... [https://jcheminf.biomedcentral.com/articles/10.1186/1758-2946-1-22]
- 36. Quantum chemical descriptors in quantitative structure ... [https://www.sciencedirect.com/science/article/abs/pii/S0169743921001520]
- 37. Predicting biophysical properties of small molecules from ... [https://www.sciencedirect.com/science/article/abs/pii/S0021967324008355]
- 38. Determination of solute descriptors by chromatographic ... [https://www.sciencedirect.com/science/article/abs/pii/S0003267009005789]
- 39. Environmental impact of PFAS: Filling data gaps using ... [https://www.sciencedirect.com/science/article/pii/S0160412024001545]
- 40. Pushing the limits of solubility prediction via quality- ... [https://pmc.ncbi.nlm.nih.gov/articles/PMC7788089/]
- 41. Comparative Analysis of Chemical Descriptors by Machine ... [https://pmc.ncbi.nlm.nih.gov/articles/PMC11220795/]
- 42. Computing solvation free energies of small molecules with ... [https://arxiv.org/html/2405.18171v4]
- 43. Accurate Hydration Free Energy Calculations for Diverse ... [https://chemrxiv.org/engage/chemrxiv/article-details/68c48aa423be8e43d6a4015e]
- 44. Practical guidelines for optimising free energy calculations ... [https://www.sciencedirect.com/science/article/pii/S0009261425005378]
- 45. Free energy calculations - GROMACS 2025.0 documentation [https://manual.gromacs.org/2025.0/reference-manual/algorithms/free-energy-calculations.html]
- 46. Flexible framework of computing binding free energy using ... [https://pubmed.ncbi.nlm.nih.gov/39812245/]
- 47. Free energy calculations for protein design [https://chemrxiv.org/engage/chemrxiv/article-details/6825057950018ac7c53507eb]
- 48. Uncertainty Quantification and Digital Twins Improve ... [https://www.mathinstitutes.org/highlights/uncertainty-quantification-and-digital-twins-improve-autonomous-manufacturing]
- 49. Dispersion, Polar, and Hydrogen-Bonding Contributions to ... [https://www.mdpi.com/2673-8015/5/4/25]
- 50. Linear solvation energy relationships ( LSERs ) for robust prediction of... [https://pubmed.ncbi.nlm.nih.gov/35150822/]
- 51. Evaluation of Two Cosolvency Models to Predict Solute Partitioning ... [https://link.springer.com/article/10.1007/s11095-022-03210-4]
- 52. Quantifying uncertainty in predicted chemical partition ratios ... [https://pubs.rsc.org/en/content/articlehtml/2025/em/d5em00357a]
- 53. Consolidated octanol/water partition coefficients: combining ... [https://enveurope.springeropen.com/articles/10.1186/s12302-025-01072-2]
- 54. Linear solvation energy relationships (LSERs) for robust ... [https://www.sciencedirect.com/science/article/pii/S0928098722000227]
- 55. Linear solvation energy relationships (LSERs) for robust ... [https://www.sciencedirect.com/science/article/pii/S0928098722000239]
- 56. tnbrowncontam/ifsqsar [https://github.com/tnbrowncontam/ifsqsar]
- 57. Novel Models for Accurate Estimation of Air–Blood ... [https://pmc.ncbi.nlm.nih.gov/articles/PMC10685450/]
- 58. External validation of prognostic models: what, why, how, ... [https://pmc.ncbi.nlm.nih.gov/articles/PMC7857818/]
- 59. Characterization of solute-solvent interactions in liquid ... [https://www.sciencedirect.com/science/article/pii/S0003267023008930]
- 60. Could linear solvation energy relationships give insights ... [https://pmc.ncbi.nlm.nih.gov/articles/PMC4155902/]
- 61. Prediction of Hydrogen-Bonding Interaction Free Energies ... [https://www.mdpi.com/2673-8015/5/2/12]
- 62. Complete computational design of high-efficiency Kemp ... [https://www.nature.com/articles/s41586-025-09136-2]
- 63. Quantitative prediction model for affinity of drug–target ... [https://bmcbioinformatics.biomedcentral.com/articles/10.1186/s12859-021-04389-w]
- 64. QSAR Model for Predicting the Cannabinoid Receptor 1 ... [https://pmc.ncbi.nlm.nih.gov/articles/PMC7767513/]